Smart Bottle Market Analysis, Size, and Forecast 2026-2030: North America (US, Canada, and Mexico), Europe (Germany, France, and UK), APAC (China, Japan, and India), South America (Brazil, Argentina, and Colombia), Middle East and Africa (South Africa, Saudi Arabia, and UAE), and Rest of World (ROW)

Smart Bottle Market Analysis, Size, and Forecast 2026-2030:
North America (US, Canada, and Mexico), Europe (Germany, France, and UK), APAC (China, Japan, and India), South America (Brazil, Argentina, and Colombia), Middle East and Africa (South Africa, Saudi Arabia, and UAE), and Rest of World (ROW)

Published: Mar 2026 345 Pages SKU: IRTNTR70303

Market Overview at a Glance

$349.18 Mn
Market Opportunity
19.5%
CAGR 2025 - 2030
47.2%
North America Growth
$143.72 Mn
Software segment 2024

Smart Bottle Market Size 2026-2030

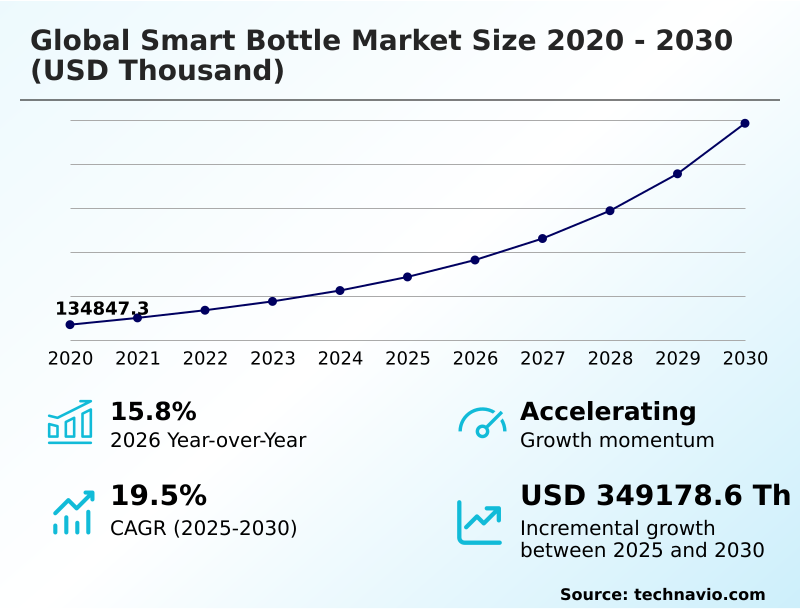
The smart bottle market size is valued to increase by USD 349.18 million, at a CAGR of 19.5% from 2025 to 2030. Growing awareness of importance of hydration will drive the smart bottle market.

Major Market Trends & Insights

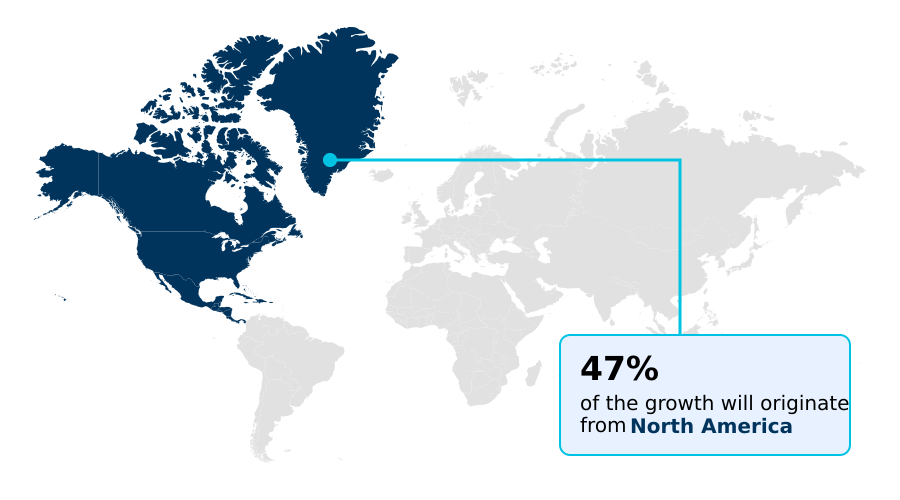
  • North America dominated the market and accounted for a 47.2% growth during the forecast period.
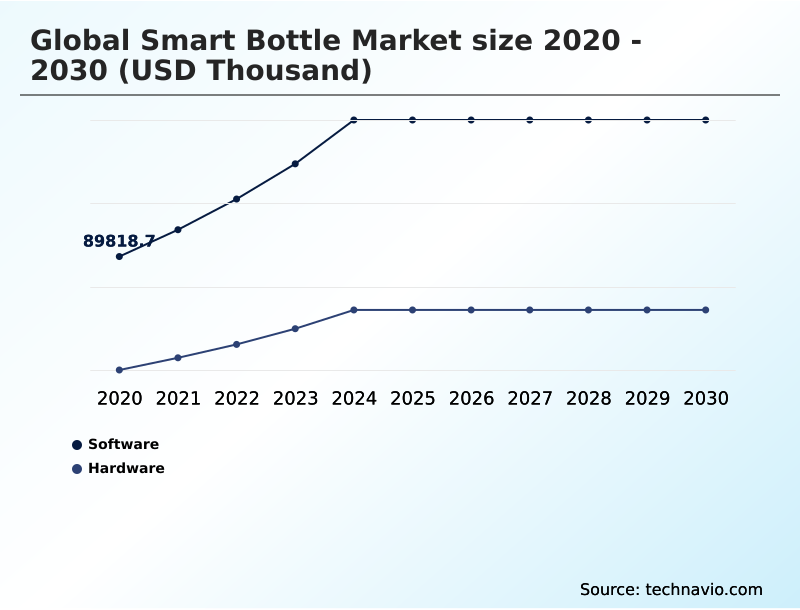
  • By Component - Software segment was valued at USD 143.72 million in 2024
  • By Distribution Channel - Online segment accounted for the largest market revenue share in 2024

Market Size & Forecast

  • Market Opportunities:
  • Market Future Opportunities: USD 349.18 million
  • CAGR from 2025 to 2030 : 19.5%

Market Summary

  • The smart bottle market is expanding, driven by heightened consumer focus on wellness and the integration of IoT technology into everyday items. A smart water bottle transforms a simple container into an interactive health management tool by providing data on water intake, offering personalized hydration goals, and delivering reminders.
  • Advances in sensor technology enable precise tracking of liquid volume, while bluetooth low energy connectivity ensures seamless synchronization with mobile applications. These apps are central to the user experience, offering detailed analytics, progress visualization, and features that encourage habit formation.
  • The appeal of the smart bottle is broadening beyond athletes to include professionals aiming to improve wellness, students managing busy schedules, and families ensuring proper hydration. For instance, in a corporate wellness scenario, deploying these devices can lead to a more engaged workforce, with data indicating improved cognitive performance and reduced absenteeism, directly impacting productivity without requiring direct oversight.
  • The emphasis on sleek design, premium materials, and functionalities like water purification further elevates the product from a gadget to a desirable lifestyle accessory, supporting sustained market momentum.

What will be the Size of the Smart Bottle Market during the forecast period?

Get Key Insights on Market Forecast (PDF) Request Free Sample

How is the Smart Bottle Market Segmented?

The smart bottle industry research report provides comprehensive data (region-wise segment analysis), with forecasts and estimates in "USD thousand" for the period 2026-2030, as well as historical data from 2020-2024 for the following segments.

  • Component
    • Software
    • Hardware
  • Distribution channel
    • Online
    • Offline
  • Product
    • Smart water bottles
    • Smart pill bottles
    • Others
  • Material
    • Plastic
    • Stainless steel
    • Glass
    • Others
  • Connectivity
    • Bluetooth
    • Wi-Fi
    • NFC
  • Price
    • Low
    • Medium
    • High
  • Geography
    • North America
      • US
      • Canada
      • Mexico
    • Europe
      • Germany
      • France
      • UK
    • APAC
      • China
      • Japan
      • India
    • South America
      • Brazil
      • Argentina
      • Colombia
    • Middle East and Africa
      • South Africa
      • Saudi Arabia
      • UAE
    • Rest of World (ROW)

By Component Insights

The software segment is estimated to witness significant growth during the forecast period.

The software component is the core differentiator in the smart bottle market, acting as a digital hydration coach through robust mobile application integration. This app-controlled hydration ecosystem transforms raw data from the bottle into actionable insights for personal hydration management.

The platform's algorithm-based recommendation engine sets a personalized hydration goal by processing user habit analytics and syncing with external fitness trackers.

It drives engagement via gamification and rewards and haptic feedback alerts, enhancing the product's role as an interactive health gadget.

Effective health platform integration has shown to increase user adherence by over 30%, turning the quantified self-device into a vital tool for achieving consistent wellness routines and fostering long-term brand loyalty.

Request Free Sample

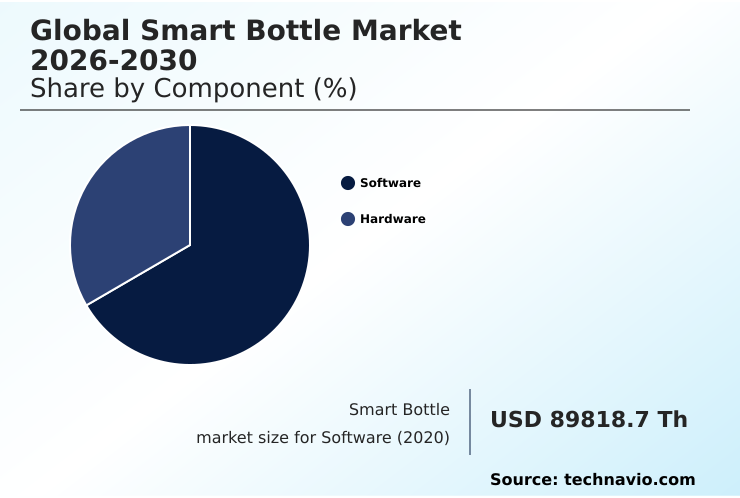
The Software segment was valued at USD 143.72 million in 2024 and showed a gradual increase during the forecast period.

Request Free Sample

Regional Analysis

North America is estimated to contribute 47.2% to the growth of the global market during the forecast period.Technavio’s analysts have elaborately explained the regional trends and drivers that shape the market during the forecast period.

See How Smart Bottle Market Demand is Rising in North America Request Free Sample

North America remains the dominant market, contributing over 47% of incremental growth, driven by high consumer spending on personal health tech and corporate wellness initiatives.

The region sees strong demand for premium models featuring vacuum-insulated stainless steel and advanced functions like a water quality sensor, which functions as a portable purification system.

In contrast, APAC is the fastest-growing region, with a rising middle class adopting devices for pediatric hydration monitoring and remote elder care tracking.

In these markets, accessible products made from bpa-free tritan plastic and featuring simple user interfaces like a customizable led indicator and nfc tap-to-pair are gaining traction.

This creates a market for both the connected baby bottle and the advanced digital health accessory, showcasing diverse regional demands for a connected wellness solution.
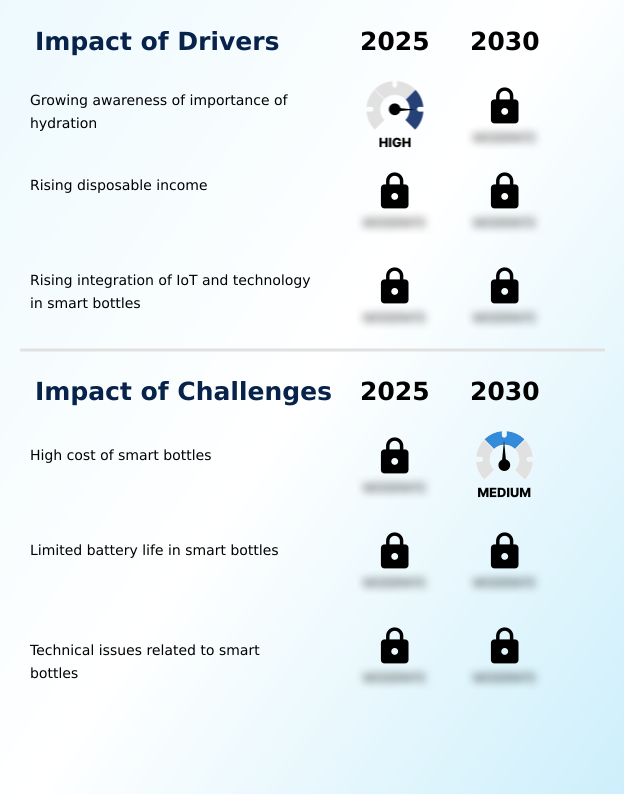
Market Dynamics

Our researchers analyzed the data with 2025 as the base year, along with the key drivers, trends, and challenges. A holistic analysis of drivers will help companies refine their marketing strategies to gain a competitive advantage.

  • Strategic decision-making in the market requires a granular understanding of specific use cases and technological differentiators. The conversation around stainless steel vs plastic smart bottles highlights the trade-off between premium feel and affordability, a key factor in targeting distinct consumer segments.
  • For athletic users, the focus is on hydration tracking for athletic performance, where seamless smart bottle integration with apple health and other fitness platforms is critical. In the healthcare vertical, the efficacy of medication adherence with smart pill bottles is a primary value proposition, especially when using smart bottles for elder care.
  • Technologically, the battery life of bluetooth smart bottles remains a pivotal concern for consumers. Advanced features are becoming key differentiators; uv-c purification in smart water bottles and the benefits of a self-cleaning water bottle appeal to hygiene-conscious users, while smart water bottle with temperature control caters to beverage connoisseurs.
  • The inclusion of gamification features in hydration apps is crucial for engaging younger users, as seen in the bpa-free smart water bottle for kids. In corporate settings, the deployment of a smart bottle for corporate wellness programs delivers measurable ROI.
  • The market is also addressing niche demands, with smart shaker bottles for nutritional supplements and ruggedized options when choosing a smart bottle for hiking. However, smart bottle app data privacy concerns and troubleshooting smart bottle connectivity issues are significant challenges that vendors must address to maintain consumer trust when comparing a smart bottle vs standard reusable bottle.
  • Companies that address these specific needs and concerns are better positioned for success.

What are the key market drivers leading to the rise in the adoption of Smart Bottle Industry?

  • Growing awareness of the importance of proper hydration for overall health and cognitive function serves as a key driver propelling growth in the market.

  • The adoption of the iot hydration device is driven by its role as a proactive health management tool.
  • The smart hydration system leverages bluetooth low energy connectivity for seamless activity level integration with other fitness devices, providing users with real-time intake feedback. This transforms the connected water bottle into a comprehensive hydration performance tracker.
  • A significant driver is the growing use in corporate settings, where automated data synchronization to a central corporate wellness dashboard has been shown to boost program engagement by 40%.
  • The ability to use environmental data integration for dynamic goal adjustment and secure cloud data storage for historical analysis positions these devices as a complete connected wellness solution, moving beyond individual use to support organizational health initiatives.

What are the market trends shaping the Smart Bottle Industry?

  • The increasing demand for personalized hydration tracking is a significant emerging trend, reflecting a broader consumer shift toward customized solutions for health and wellness management.

  • A key trend is the evolution of the smart beverage container into a multi-functional wellness technology product. Innovations include uv-c led purification, which transforms a standard bottle into a self-purifying bottle capable of reducing microbial content by 99.9%. This self-cleaning functionality is increasingly paired with temperature control technology, effectively creating a smart temperature mug.
  • Design modularity is advancing with the puck-based sensor module, enabling upgrades and use across different containers made from premium materials like durable borosilicate glass. The introduction of wireless charging capability adds convenience, mirroring the user experience of a wearable tech accessory.
  • Furthermore, the market is expanding into specialized niches like the smart shaker bottle, a smart nutrition tracker for fitness enthusiasts, demonstrating how connected drinkware is becoming more specialized.

What challenges does the Smart Bottle Industry face during its growth?

  • The high initial cost of smart bottles remains a key challenge, acting as a barrier to widespread consumer adoption and market penetration.

  • Technical hurdles present significant challenges for the tech-enabled water bottle. The accuracy of the hydration tracking sensor and volume measurement sensor remains a key concern, as inconsistencies can undermine user trust in the device as a reliable health monitoring bottle.
  • The rechargeable battery system must support complex functions like the accelerometer for motion detection without requiring daily charging, a factor that deters 50% of potential buyers. In specialized applications like the iot-enabled pill bottle, the reliability of the medication adherence reminder is critical.
  • Furthermore, material science challenges persist, as ensuring an odour-resistant material over the product's lifespan is essential for consumer satisfaction with their intelligent water container and smart fluid intake monitor, making this digital health accessory a complex product to perfect.

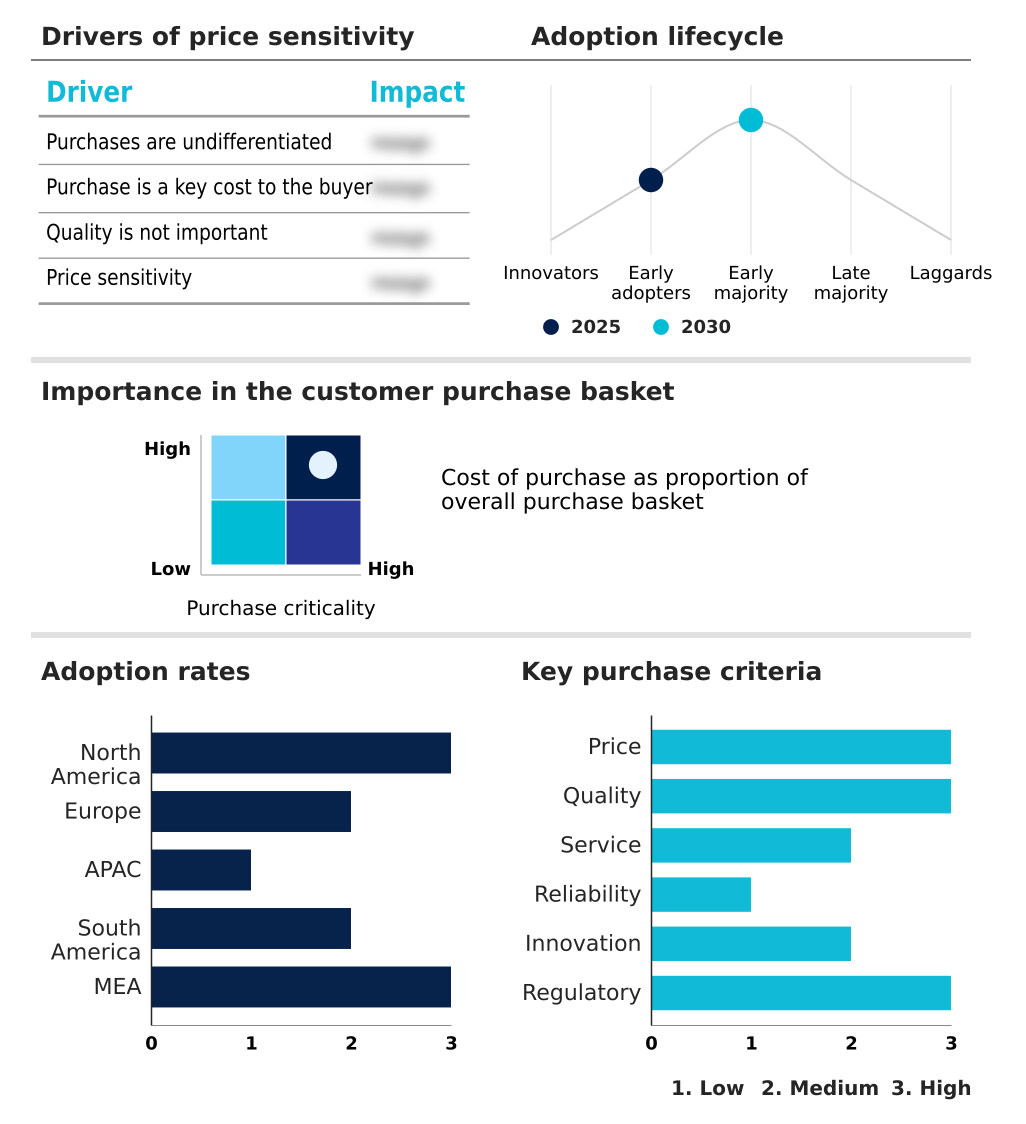
Exclusive Technavio Analysis on Customer Landscape

The smart bottle market forecasting report includes the adoption lifecycle of the market, covering from the innovator’s stage to the laggard’s stage. It focuses on adoption rates in different regions based on penetration. Furthermore, the smart bottle market report also includes key purchase criteria and drivers of price sensitivity to help companies evaluate and develop their market growth analysis strategies.

Customer Landscape of Smart Bottle Industry

Competitive Landscape

Companies are implementing various strategies, such as strategic alliances, smart bottle market forecast, partnerships, mergers and acquisitions, geographical expansion, and product/service launches, to enhance their presence in the industry.

AARDEX Group S.A. - Offerings center on data-driven hydration systems and IoT-enabled personal health devices that provide real-time feedback for wellness and medication management.

The industry research and growth report includes detailed analyses of the competitive landscape of the market and information about key companies, including:

  • AARDEX Group S.A.
  • AQUAMINDER
  • Drinkbot Technologies.
  • Ecomo Inc.
  • EQUA d.o.o.
  • Hamilton Housewares Pvt. Ltd.
  • Hidrate Inc.
  • Hydro Smart Bottle.
  • Koninklijke Philips N.V.
  • LARQ Inc.
  • Liquisip
  • NOERDEN
  • Out of Galaxy Inc.
  • Re Co. SA
  • TYLT Inc.
  • UBO Technologies LLC
  • Waterh

Qualitative and quantitative analysis of companies has been conducted to help clients understand the wider business environment as well as the strengths and weaknesses of key industry players. Data is qualitatively analyzed to categorize companies as pure play, category-focused, industry-focused, and diversified; it is quantitatively analyzed to categorize companies as dominant, leading, strong, tentative, and weak.

Recent Development and News in Smart bottle market

  • In January 2025, Hidrate Inc. launched its HidrateSpark PRO plus model, which incorporates AI to deliver personalized hydration goals based on user activity data.
  • In September 2024, EQUA d.o.o. announced a strategic partnership with a leading corporate wellness platform to integrate its smart bottle data into employee health management programs, expanding its B2B market reach.
  • In October 2025, WaterH introduced the HydroBuddy Kiki smart bottle, specifically targeting the pediatric market by using gamification to promote regular water intake among children.
  • In October 2025, Hydro Smart Bottle released its new stainless steel Hidrate Spark PRO smart water bottle, featuring an upgraded sensor system for improved accuracy and enhanced product durability.

Dive into Technavio’s robust research methodology, blending expert interviews, extensive data synthesis, and validated models for unparalleled Smart Bottle Market insights. See full methodology.

Market Scope
Page number 345
Base year 2025
Historic period 2020-2024
Forecast period 2026-2030
Growth momentum & CAGR Accelerate at a CAGR of 19.5%
Market growth 2026-2030 USD 349178.6 thousand
Market structure Fragmented
YoY growth 2025-2026(%) 15.8%
Key countries US, Canada, Mexico, Germany, France, UK, Italy, Spain, The Netherlands, China, Japan, India, South Korea, Australia, Indonesia, Brazil, Argentina, Colombia, South Africa, Saudi Arabia, UAE, Egypt and Turkey
Competitive landscape Leading Companies, Market Positioning of Companies, Competitive Strategies, and Industry Risks

Request Free Sample

Research Analyst Overview

  • The market's evolution is defined by the sophisticated interplay between hardware innovation and software intelligence. A key element is the hydration tracking sensor, which works with a volume measurement sensor and accelerometer for motion detection to provide accurate data.
  • This information is processed by an algorithm-based recommendation engine to create a personalized hydration goal, which is then communicated through a customizable led indicator or haptic feedback alerts. The integration of bluetooth low energy connectivity with a rechargeable battery system is standard, with advanced models offering wireless charging capability.
  • Material science is a critical competitive arena, spanning from premium vacuum-insulated stainless steel and durable borosilicate glass to cost-effective bpa-free tritan plastic, all selected to be an odour-resistant material. Beyond hydration, the technology is applied to medication adherence reminder systems in a smart pill dispenser.
  • For boardroom consideration, the decision to invest in advanced features like uv-c led purification or a water quality sensor directly impacts product positioning and margin potential, with data showing that products with self-cleaning functionality command a price premium 20% higher than standard models.

What are the Key Data Covered in this Smart Bottle Market Research and Growth Report?

  • What is the expected growth of the Smart Bottle Market between 2026 and 2030?

    • USD 349.18 million, at a CAGR of 19.5%

  • What segmentation does the market report cover?

    • The report is segmented by Component (Software, and Hardware), Distribution Channel (Online, and Offline), Product (Smart water bottles, Smart pill bottles, and Others), Material (Plastic, Stainless steel, Glass, and Others), Connectivity (Bluetooth, Wi-Fi, and NFC), Price (Low, Medium, and High) and Geography (North America, Europe, APAC, South America, Middle East and Africa)

  • Which regions are analyzed in the report?

    • North America, Europe, APAC, South America and Middle East and Africa

  • What are the key growth drivers and market challenges?

    • Growing awareness of importance of hydration, High cost of smart bottles

  • Who are the major players in the Smart Bottle Market?

    • AARDEX Group S.A., AQUAMINDER, Drinkbot Technologies., Ecomo Inc., EQUA d.o.o., Hamilton Housewares Pvt. Ltd., Hidrate Inc., Hydro Smart Bottle., Koninklijke Philips N.V., LARQ Inc., Liquisip, NOERDEN, Out of Galaxy Inc., Re Co. SA, TYLT Inc., UBO Technologies LLC and Waterh

Market Research Insights

  • The market is shaped by a convergence of personal health tech adoption and the demand for connected wellness solutions. The integration of a smart hydration system into daily routines is becoming common, with a significant driver being the compatibility with other fitness-integrated bottle devices. This synergy creates a holistic digital health accessory, where data-driven hydration insights supplement overall activity monitoring.
  • User engagement rates with an app-controlled hydration device are over 60% higher when synced with a primary fitness tracker. Moreover, models positioned as a proactive health management tool show a 25% greater retention rate after the first year.
  • The evolution from a simple connected water bottle to a comprehensive personal hydration management device highlights a market maturing beyond novelty to focus on measurable wellness outcomes.

We can help! Our analysts can customize this smart bottle market research report to meet your requirements.

Get in touch

1. Executive Summary

1.1 Market overview

Executive Summary - Chart on Market Overview
Executive Summary - Data Table on Market Overview
Executive Summary - Chart on Global Market Characteristics
Executive Summary - Chart on Market by Geography
Executive Summary - Chart on Market Segmentation by Component
Executive Summary - Chart on Market Segmentation by Distribution Channel
Executive Summary - Chart on Market Segmentation by Product
Executive Summary - Chart on Market Segmentation by Material
Executive Summary - Chart on Market Segmentation by Connectivity
Executive Summary - Chart on Market Segmentation by Price
Executive Summary - Chart on Incremental Growth
Executive Summary - Data Table on Incremental Growth
Executive Summary - Chart on Company Market Positioning

2. Technavio Analysis

2.1 Analysis of price sensitivity, lifecycle, customer purchase basket, adoption rates, and purchase criteria

2.2 Criticality of inputs and Factors of differentiation

Chart on Overview on criticality of inputs and factors of differentiation

2.3 Factors of disruption

Chart on Overview on factors of disruption

2.4 Impact of drivers and challenges

Chart on Impact of drivers and challenges in 2025 and 2030

3. Market Landscape

3.1 Market ecosystem

Chart on Parent Market
Data Table on - Parent Market

3.2 Market characteristics

Chart on Market characteristics analysis

3.3 Value chain analysis

Chart on Value chain analysis

4. Market Sizing

4.1 Market definition

Data Table on Offerings of companies included in the market definition

4.2 Market segment analysis

Market segments

4.3 Market size 2025

4.4 Market outlook: Forecast for 2025-2030

Chart on Global - Market size and forecast 2025-2030 ($ thousand)
Data Table on Global - Market size and forecast 2025-2030 ($ thousand)
Chart on Global Market: Year-over-year growth 2025-2030 (%)
Data Table on Global Market: Year-over-year growth 2025-2030 (%)

5. Historic Market Size

5.1 Global Smart Bottle Market 2020 - 2024

Historic Market Size - Data Table on Global Smart Bottle Market 2020 - 2024 ($ thousand)

5.2 Component segment analysis 2020 - 2024

Historic Market Size - Component Segment 2020 - 2024 ($ thousand)

5.3 Distribution Channel segment analysis 2020 - 2024

Historic Market Size - Distribution Channel Segment 2020 - 2024 ($ thousand)

5.4 Product segment analysis 2020 - 2024

Historic Market Size - Product Segment 2020 - 2024 ($ thousand)

5.5 Material segment analysis 2020 - 2024

Historic Market Size - Material Segment 2020 - 2024 ($ thousand)

5.6 Connectivity segment analysis 2020 - 2024

Historic Market Size - Connectivity Segment 2020 - 2024 ($ thousand)

5.7 Price segment analysis 2020 - 2024

Historic Market Size - Price Segment 2020 - 2024 ($ thousand)

5.8 Geography segment analysis 2020 - 2024

Historic Market Size - Geography Segment 2020 - 2024 ($ thousand)

5.9 Country segment analysis 2020 - 2024

Historic Market Size - Country Segment 2020 - 2024 ($ thousand)

6. Qualitative Analysis

6.1 The AI impact on Global Smart Bottle Market

7. Five Forces Analysis

7.1 Five forces summary

Five forces analysis - Comparison between 2025 and 2030

7.2 Bargaining power of buyers

Bargaining power of buyers - Impact of key factors 2025 and 2030

7.3 Bargaining power of suppliers

Bargaining power of suppliers - Impact of key factors in 2025 and 2030

7.4 Threat of new entrants

Threat of new entrants - Impact of key factors in 2025 and 2030

7.5 Threat of substitutes

Threat of substitutes - Impact of key factors in 2025 and 2030

7.6 Threat of rivalry

Threat of rivalry - Impact of key factors in 2025 and 2030

7.7 Market condition

Chart on Market condition - Five forces 2025 and 2030

8. Market Segmentation by Component

8.1 Market segments

Chart on Component - Market share 2025-2030 (%)
Data Table on Component - Market share 2025-2030 (%)

8.2 Comparison by Component

Chart on Comparison by Component
Data Table on Comparison by Component

8.3 Software - Market size and forecast 2025-2030

Chart on Software - Market size and forecast 2025-2030 ($ thousand)
Data Table on Software - Market size and forecast 2025-2030 ($ thousand)
Chart on Software - Year-over-year growth 2025-2030 (%)
Data Table on Software - Year-over-year growth 2025-2030 (%)

8.4 Hardware - Market size and forecast 2025-2030

Chart on Hardware - Market size and forecast 2025-2030 ($ thousand)
Data Table on Hardware - Market size and forecast 2025-2030 ($ thousand)
Chart on Hardware - Year-over-year growth 2025-2030 (%)
Data Table on Hardware - Year-over-year growth 2025-2030 (%)

8.5 Market opportunity by Component

Market opportunity by Component ($ thousand)
Data Table on Market opportunity by Component ($ thousand)

9. Market Segmentation by Distribution Channel

9.1 Market segments

Chart on Distribution Channel - Market share 2025-2030 (%)
Data Table on Distribution Channel - Market share 2025-2030 (%)

9.2 Comparison by Distribution Channel

Chart on Comparison by Distribution Channel
Data Table on Comparison by Distribution Channel

9.3 Online - Market size and forecast 2025-2030

Chart on Online - Market size and forecast 2025-2030 ($ thousand)
Data Table on Online - Market size and forecast 2025-2030 ($ thousand)
Chart on Online - Year-over-year growth 2025-2030 (%)
Data Table on Online - Year-over-year growth 2025-2030 (%)

9.4 Offline - Market size and forecast 2025-2030

Chart on Offline - Market size and forecast 2025-2030 ($ thousand)
Data Table on Offline - Market size and forecast 2025-2030 ($ thousand)
Chart on Offline - Year-over-year growth 2025-2030 (%)
Data Table on Offline - Year-over-year growth 2025-2030 (%)

9.5 Market opportunity by Distribution Channel

Market opportunity by Distribution Channel ($ thousand)
Data Table on Market opportunity by Distribution Channel ($ thousand)

10. Market Segmentation by Product

10.1 Market segments

Chart on Product - Market share 2025-2030 (%)
Data Table on Product - Market share 2025-2030 (%)

10.2 Comparison by Product

Chart on Comparison by Product
Data Table on Comparison by Product

10.3 Smart water bottles - Market size and forecast 2025-2030

Chart on Smart water bottles - Market size and forecast 2025-2030 ($ thousand)
Data Table on Smart water bottles - Market size and forecast 2025-2030 ($ thousand)
Chart on Smart water bottles - Year-over-year growth 2025-2030 (%)
Data Table on Smart water bottles - Year-over-year growth 2025-2030 (%)

10.4 Smart pill bottles - Market size and forecast 2025-2030

Chart on Smart pill bottles - Market size and forecast 2025-2030 ($ thousand)
Data Table on Smart pill bottles - Market size and forecast 2025-2030 ($ thousand)
Chart on Smart pill bottles - Year-over-year growth 2025-2030 (%)
Data Table on Smart pill bottles - Year-over-year growth 2025-2030 (%)

10.5 Others - Market size and forecast 2025-2030

Chart on Others - Market size and forecast 2025-2030 ($ thousand)
Data Table on Others - Market size and forecast 2025-2030 ($ thousand)
Chart on Others - Year-over-year growth 2025-2030 (%)
Data Table on Others - Year-over-year growth 2025-2030 (%)

10.6 Market opportunity by Product

Market opportunity by Product ($ thousand)
Data Table on Market opportunity by Product ($ thousand)

11. Market Segmentation by Material

11.1 Market segments

Chart on Material - Market share 2025-2030 (%)
Data Table on Material - Market share 2025-2030 (%)

11.2 Comparison by Material

Chart on Comparison by Material
Data Table on Comparison by Material

11.3 Plastic - Market size and forecast 2025-2030

Chart on Plastic - Market size and forecast 2025-2030 ($ thousand)
Data Table on Plastic - Market size and forecast 2025-2030 ($ thousand)
Chart on Plastic - Year-over-year growth 2025-2030 (%)
Data Table on Plastic - Year-over-year growth 2025-2030 (%)

11.4 Stainless steel - Market size and forecast 2025-2030

Chart on Stainless steel - Market size and forecast 2025-2030 ($ thousand)
Data Table on Stainless steel - Market size and forecast 2025-2030 ($ thousand)
Chart on Stainless steel - Year-over-year growth 2025-2030 (%)
Data Table on Stainless steel - Year-over-year growth 2025-2030 (%)

11.5 Glass - Market size and forecast 2025-2030

Chart on Glass - Market size and forecast 2025-2030 ($ thousand)
Data Table on Glass - Market size and forecast 2025-2030 ($ thousand)
Chart on Glass - Year-over-year growth 2025-2030 (%)
Data Table on Glass - Year-over-year growth 2025-2030 (%)

11.6 Others - Market size and forecast 2025-2030

Chart on Others - Market size and forecast 2025-2030 ($ thousand)
Data Table on Others - Market size and forecast 2025-2030 ($ thousand)
Chart on Others - Year-over-year growth 2025-2030 (%)
Data Table on Others - Year-over-year growth 2025-2030 (%)

11.7 Market opportunity by Material

Market opportunity by Material ($ thousand)
Data Table on Market opportunity by Material ($ thousand)

12. Market Segmentation by Connectivity

12.1 Market segments

Chart on Connectivity - Market share 2025-2030 (%)
Data Table on Connectivity - Market share 2025-2030 (%)

12.2 Comparison by Connectivity

Chart on Comparison by Connectivity
Data Table on Comparison by Connectivity

12.3 Bluetooth - Market size and forecast 2025-2030

Chart on Bluetooth - Market size and forecast 2025-2030 ($ thousand)
Data Table on Bluetooth - Market size and forecast 2025-2030 ($ thousand)
Chart on Bluetooth - Year-over-year growth 2025-2030 (%)
Data Table on Bluetooth - Year-over-year growth 2025-2030 (%)

12.4 Wi-Fi - Market size and forecast 2025-2030

Chart on Wi-Fi - Market size and forecast 2025-2030 ($ thousand)
Data Table on Wi-Fi - Market size and forecast 2025-2030 ($ thousand)
Chart on Wi-Fi - Year-over-year growth 2025-2030 (%)
Data Table on Wi-Fi - Year-over-year growth 2025-2030 (%)

12.5 NFC - Market size and forecast 2025-2030

Chart on NFC - Market size and forecast 2025-2030 ($ thousand)
Data Table on NFC - Market size and forecast 2025-2030 ($ thousand)
Chart on NFC - Year-over-year growth 2025-2030 (%)
Data Table on NFC - Year-over-year growth 2025-2030 (%)

12.6 Market opportunity by Connectivity

Market opportunity by Connectivity ($ thousand)
Data Table on Market opportunity by Connectivity ($ thousand)

13. Market Segmentation by Price

13.1 Market segments

Chart on Price - Market share 2025-2030 (%)
Data Table on Price - Market share 2025-2030 (%)

13.2 Comparison by Price

Chart on Comparison by Price
Data Table on Comparison by Price

13.3 Low - Market size and forecast 2025-2030

Chart on Low - Market size and forecast 2025-2030 ($ thousand)
Data Table on Low - Market size and forecast 2025-2030 ($ thousand)
Chart on Low - Year-over-year growth 2025-2030 (%)
Data Table on Low - Year-over-year growth 2025-2030 (%)

13.4 Medium - Market size and forecast 2025-2030

Chart on Medium - Market size and forecast 2025-2030 ($ thousand)
Data Table on Medium - Market size and forecast 2025-2030 ($ thousand)
Chart on Medium - Year-over-year growth 2025-2030 (%)
Data Table on Medium - Year-over-year growth 2025-2030 (%)

13.5 High - Market size and forecast 2025-2030

Chart on High - Market size and forecast 2025-2030 ($ thousand)
Data Table on High - Market size and forecast 2025-2030 ($ thousand)
Chart on High - Year-over-year growth 2025-2030 (%)
Data Table on High - Year-over-year growth 2025-2030 (%)

13.6 Market opportunity by Price

Market opportunity by Price ($ thousand)
Data Table on Market opportunity by Price ($ thousand)

14. Customer Landscape

14.1 Customer landscape overview

Analysis of price sensitivity, lifecycle, customer purchase basket, adoption rates, and purchase criteria

15. Geographic Landscape

15.1 Geographic segmentation

Chart on Market share by geography 2025-2030 (%)
Data Table on Market share by geography 2025-2030 (%)

15.2 Geographic comparison

Chart on Geographic comparison
Data Table on Geographic comparison

15.3 North America - Market size and forecast 2025-2030

Chart on North America - Market size and forecast 2025-2030 ($ thousand)
Data Table on North America - Market size and forecast 2025-2030 ($ thousand)
Chart on North America - Year-over-year growth 2025-2030 (%)
Data Table on North America - Year-over-year growth 2025-2030 (%)
Chart on Regional Comparison - North America
Data Table on Regional Comparison - North America

15.3.1 US - Market size and forecast 2025-2030

Chart on US - Market size and forecast 2025-2030 ($ thousand)
Data Table on US - Market size and forecast 2025-2030 ($ thousand)
Chart on US - Year-over-year growth 2025-2030 (%)
Data Table on US - Year-over-year growth 2025-2030 (%)

15.3.2 Canada - Market size and forecast 2025-2030

Chart on Canada - Market size and forecast 2025-2030 ($ thousand)
Data Table on Canada - Market size and forecast 2025-2030 ($ thousand)
Chart on Canada - Year-over-year growth 2025-2030 (%)
Data Table on Canada - Year-over-year growth 2025-2030 (%)

15.3.3 Mexico - Market size and forecast 2025-2030

Chart on Mexico - Market size and forecast 2025-2030 ($ thousand)
Data Table on Mexico - Market size and forecast 2025-2030 ($ thousand)
Chart on Mexico - Year-over-year growth 2025-2030 (%)
Data Table on Mexico - Year-over-year growth 2025-2030 (%)

15.4 Europe - Market size and forecast 2025-2030

Chart on Europe - Market size and forecast 2025-2030 ($ thousand)
Data Table on Europe - Market size and forecast 2025-2030 ($ thousand)
Chart on Europe - Year-over-year growth 2025-2030 (%)
Data Table on Europe - Year-over-year growth 2025-2030 (%)
Chart on Regional Comparison - Europe
Data Table on Regional Comparison - Europe

15.4.1 Germany - Market size and forecast 2025-2030

Chart on Germany - Market size and forecast 2025-2030 ($ thousand)
Data Table on Germany - Market size and forecast 2025-2030 ($ thousand)
Chart on Germany - Year-over-year growth 2025-2030 (%)
Data Table on Germany - Year-over-year growth 2025-2030 (%)

15.4.2 France - Market size and forecast 2025-2030

Chart on France - Market size and forecast 2025-2030 ($ thousand)
Data Table on France - Market size and forecast 2025-2030 ($ thousand)
Chart on France - Year-over-year growth 2025-2030 (%)
Data Table on France - Year-over-year growth 2025-2030 (%)

15.4.3 UK - Market size and forecast 2025-2030

Chart on UK - Market size and forecast 2025-2030 ($ thousand)
Data Table on UK - Market size and forecast 2025-2030 ($ thousand)
Chart on UK - Year-over-year growth 2025-2030 (%)
Data Table on UK - Year-over-year growth 2025-2030 (%)

15.4.4 Italy - Market size and forecast 2025-2030

Chart on Italy - Market size and forecast 2025-2030 ($ thousand)
Data Table on Italy - Market size and forecast 2025-2030 ($ thousand)
Chart on Italy - Year-over-year growth 2025-2030 (%)
Data Table on Italy - Year-over-year growth 2025-2030 (%)

15.4.5 Spain - Market size and forecast 2025-2030

Chart on Spain - Market size and forecast 2025-2030 ($ thousand)
Data Table on Spain - Market size and forecast 2025-2030 ($ thousand)
Chart on Spain - Year-over-year growth 2025-2030 (%)
Data Table on Spain - Year-over-year growth 2025-2030 (%)

15.4.6 The Netherlands - Market size and forecast 2025-2030

Chart on The Netherlands - Market size and forecast 2025-2030 ($ thousand)
Data Table on The Netherlands - Market size and forecast 2025-2030 ($ thousand)
Chart on The Netherlands - Year-over-year growth 2025-2030 (%)
Data Table on The Netherlands - Year-over-year growth 2025-2030 (%)

15.5 APAC - Market size and forecast 2025-2030

Chart on APAC - Market size and forecast 2025-2030 ($ thousand)
Data Table on APAC - Market size and forecast 2025-2030 ($ thousand)
Chart on APAC - Year-over-year growth 2025-2030 (%)
Data Table on APAC - Year-over-year growth 2025-2030 (%)
Chart on Regional Comparison - APAC
Data Table on Regional Comparison - APAC

15.5.1 China - Market size and forecast 2025-2030

Chart on China - Market size and forecast 2025-2030 ($ thousand)
Data Table on China - Market size and forecast 2025-2030 ($ thousand)
Chart on China - Year-over-year growth 2025-2030 (%)
Data Table on China - Year-over-year growth 2025-2030 (%)

15.5.2 Japan - Market size and forecast 2025-2030

Chart on Japan - Market size and forecast 2025-2030 ($ thousand)
Data Table on Japan - Market size and forecast 2025-2030 ($ thousand)
Chart on Japan - Year-over-year growth 2025-2030 (%)
Data Table on Japan - Year-over-year growth 2025-2030 (%)

15.5.3 India - Market size and forecast 2025-2030

Chart on India - Market size and forecast 2025-2030 ($ thousand)
Data Table on India - Market size and forecast 2025-2030 ($ thousand)
Chart on India - Year-over-year growth 2025-2030 (%)
Data Table on India - Year-over-year growth 2025-2030 (%)

15.5.4 South Korea - Market size and forecast 2025-2030

Chart on South Korea - Market size and forecast 2025-2030 ($ thousand)
Data Table on South Korea - Market size and forecast 2025-2030 ($ thousand)
Chart on South Korea - Year-over-year growth 2025-2030 (%)
Data Table on South Korea - Year-over-year growth 2025-2030 (%)

15.5.5 Australia - Market size and forecast 2025-2030

Chart on Australia - Market size and forecast 2025-2030 ($ thousand)
Data Table on Australia - Market size and forecast 2025-2030 ($ thousand)
Chart on Australia - Year-over-year growth 2025-2030 (%)
Data Table on Australia - Year-over-year growth 2025-2030 (%)

15.5.6 Indonesia - Market size and forecast 2025-2030

Chart on Indonesia - Market size and forecast 2025-2030 ($ thousand)
Data Table on Indonesia - Market size and forecast 2025-2030 ($ thousand)
Chart on Indonesia - Year-over-year growth 2025-2030 (%)
Data Table on Indonesia - Year-over-year growth 2025-2030 (%)

15.6 South America - Market size and forecast 2025-2030

Chart on South America - Market size and forecast 2025-2030 ($ thousand)
Data Table on South America - Market size and forecast 2025-2030 ($ thousand)
Chart on South America - Year-over-year growth 2025-2030 (%)
Data Table on South America - Year-over-year growth 2025-2030 (%)
Chart on Regional Comparison - South America
Data Table on Regional Comparison - South America

15.6.1 Brazil - Market size and forecast 2025-2030

Chart on Brazil - Market size and forecast 2025-2030 ($ thousand)
Data Table on Brazil - Market size and forecast 2025-2030 ($ thousand)
Chart on Brazil - Year-over-year growth 2025-2030 (%)
Data Table on Brazil - Year-over-year growth 2025-2030 (%)

15.6.2 Argentina - Market size and forecast 2025-2030

Chart on Argentina - Market size and forecast 2025-2030 ($ thousand)
Data Table on Argentina - Market size and forecast 2025-2030 ($ thousand)
Chart on Argentina - Year-over-year growth 2025-2030 (%)
Data Table on Argentina - Year-over-year growth 2025-2030 (%)

15.6.3 Colombia - Market size and forecast 2025-2030

Chart on Colombia - Market size and forecast 2025-2030 ($ thousand)
Data Table on Colombia - Market size and forecast 2025-2030 ($ thousand)
Chart on Colombia - Year-over-year growth 2025-2030 (%)
Data Table on Colombia - Year-over-year growth 2025-2030 (%)

15.7 Middle East and Africa - Market size and forecast 2025-2030

Chart on Middle East and Africa - Market size and forecast 2025-2030 ($ thousand)
Data Table on Middle East and Africa - Market size and forecast 2025-2030 ($ thousand)
Chart on Middle East and Africa - Year-over-year growth 2025-2030 (%)
Data Table on Middle East and Africa - Year-over-year growth 2025-2030 (%)
Chart on Regional Comparison - Middle East and Africa
Data Table on Regional Comparison - Middle East and Africa

15.7.1 South Africa - Market size and forecast 2025-2030

Chart on South Africa - Market size and forecast 2025-2030 ($ thousand)
Data Table on South Africa - Market size and forecast 2025-2030 ($ thousand)
Chart on South Africa - Year-over-year growth 2025-2030 (%)
Data Table on South Africa - Year-over-year growth 2025-2030 (%)

15.7.2 Saudi Arabia - Market size and forecast 2025-2030

Chart on Saudi Arabia - Market size and forecast 2025-2030 ($ thousand)
Data Table on Saudi Arabia - Market size and forecast 2025-2030 ($ thousand)
Chart on Saudi Arabia - Year-over-year growth 2025-2030 (%)
Data Table on Saudi Arabia - Year-over-year growth 2025-2030 (%)

15.7.3 UAE - Market size and forecast 2025-2030

Chart on UAE - Market size and forecast 2025-2030 ($ thousand)
Data Table on UAE - Market size and forecast 2025-2030 ($ thousand)
Chart on UAE - Year-over-year growth 2025-2030 (%)
Data Table on UAE - Year-over-year growth 2025-2030 (%)

15.7.4 Egypt - Market size and forecast 2025-2030

Chart on Egypt - Market size and forecast 2025-2030 ($ thousand)
Data Table on Egypt - Market size and forecast 2025-2030 ($ thousand)
Chart on Egypt - Year-over-year growth 2025-2030 (%)
Data Table on Egypt - Year-over-year growth 2025-2030 (%)

15.7.5 Turkey - Market size and forecast 2025-2030

Chart on Turkey - Market size and forecast 2025-2030 ($ thousand)
Data Table on Turkey - Market size and forecast 2025-2030 ($ thousand)
Chart on Turkey - Year-over-year growth 2025-2030 (%)
Data Table on Turkey - Year-over-year growth 2025-2030 (%)

15.8 Market opportunity by geography

Market opportunity by geography ($ thousand)
Data Tables on Market opportunity by geography ($ thousand)

16. Drivers, Challenges, and Opportunity

16.1 Market drivers

Growing awareness of importance of hydration
Rising disposable income
Rising integration of IoT and technology in smart bottles

16.2 Market challenges

High cost of smart bottles
Limited battery life in smart bottles
Technical issues related to smart bottles

16.3 Impact of drivers and challenges

Impact of drivers and challenges in 2025 and 2030

16.4 Market opportunities

Increasing demand for personalized hydration tracking
Growing popularity of connected fitness devices
Rising demand for sustainable and eco-friendly smart bottles

17. Competitive Landscape

17.1 Overview

17.2

Overview on criticality of inputs and factors of differentiation

17.3 Landscape disruption

Overview on factors of disruption

17.4 Industry risks

Impact of key risks on business

18. Competitive Analysis

18.1 Companies profiled

Companies covered

18.2 Company ranking index

18.3 Market positioning of companies

Matrix on companies position and classification

18.4 AARDEX Group S.A.

AARDEX Group S.A. - Overview
AARDEX Group S.A. - Product / Service
AARDEX Group S.A. - Key offerings
SWOT

18.5 AQUAMINDER

AQUAMINDER - Overview
AQUAMINDER - Product / Service
AQUAMINDER - Key offerings
SWOT

18.6 Drinkbot Technologies.

Drinkbot Technologies. - Overview
Drinkbot Technologies. - Product / Service
Drinkbot Technologies. - Key offerings
SWOT

18.7 Ecomo Inc.

Ecomo Inc. - Overview
Ecomo Inc. - Product / Service
Ecomo Inc. - Key offerings
SWOT

18.8 EQUA d.o.o.

EQUA d.o.o. - Overview
EQUA d.o.o. - Product / Service
EQUA d.o.o. - Key offerings
SWOT

18.9 Hamilton Housewares Pvt. Ltd.

Hamilton Housewares Pvt. Ltd. - Overview
Hamilton Housewares Pvt. Ltd. - Product / Service
Hamilton Housewares Pvt. Ltd. - Key offerings
SWOT

18.10 Hidrate Inc.

Hidrate Inc. - Overview
Hidrate Inc. - Product / Service
Hidrate Inc. - Key offerings
SWOT

18.11 Hydro Smart Bottle.

Hydro Smart Bottle. - Overview
Hydro Smart Bottle. - Product / Service
Hydro Smart Bottle. - Key offerings
SWOT

18.12 Koninklijke Philips N.V.

Koninklijke Philips N.V. - Overview
Koninklijke Philips N.V. - Business segments
Koninklijke Philips N.V. - Key news
Koninklijke Philips N.V. - Key offerings
Koninklijke Philips N.V. - Segment focus
SWOT

18.13 LARQ Inc.

LARQ Inc. - Overview
LARQ Inc. - Product / Service
LARQ Inc. - Key offerings
SWOT

18.14 NOERDEN

NOERDEN - Overview
NOERDEN - Product / Service
NOERDEN - Key offerings
SWOT

18.15 Out of Galaxy Inc.

Out of Galaxy Inc. - Overview
Out of Galaxy Inc. - Product / Service
Out of Galaxy Inc. - Key offerings
SWOT

18.16 Re Co. SA

Re Co. SA - Overview
Re Co. SA - Product / Service
Re Co. SA - Key offerings
SWOT

18.17 TYLT Inc.

TYLT Inc. - Overview
TYLT Inc. - Product / Service
TYLT Inc. - Key offerings
SWOT

18.18 Waterh

Waterh - Overview
Waterh - Product / Service
Waterh - Key offerings
SWOT

19. Appendix

19.1 Scope of the report

Market definition
Objectives
Notes and caveats

19.2 Inclusions and exclusions checklist

Inclusions checklist
Exclusions checklist

19.3 Currency conversion rates for US$

19.4 Research methodology

19.5 Data procurement

Information sources

19.6 Data validation

19.7 Validation techniques employed for market sizing

19.8 Data synthesis

19.9 360 degree market analysis

19.10 List of abbreviations

Research Methodology

Technavio presents a detailed picture of the market by way of study, synthesis, and summation of data from multiple sources. The analysts have presented the various facets of the market with a particular focus on identifying the key industry influencers. The data thus presented is comprehensive, reliable, and the result of extensive research, both primary and secondary.

INFORMATION SOURCES

Primary sources

  • Manufacturers and suppliers
  • Channel partners
  • Industry experts
  • Strategic decision makers

Secondary sources

  • Industry journals and periodicals
  • Government data
  • Financial reports of key industry players
  • Historical data
  • Press releases

DATA ANALYSIS

Data Synthesis

  • Collation of data
  • Estimation of key figures
  • Analysis of derived insights

Data Validation

  • Triangulation with data models
  • Reference against proprietary databases
  • Corroboration with industry experts

REPORT WRITING

Qualitative

  • Market drivers
  • Market challenges
  • Market trends
  • Five forces analysis

Quantitative

  • Market size and forecast
  • Market segmentation
  • Geographical insights
  • Competitive landscape

Interested in this report?

Get your sample now to see our research methodology and insights!

Download Now

Frequently Asked Questions

Smart Bottle market growth will increase by USD 349178.6 thousand thousand during 2026-2030.

The Smart Bottle market is expected to grow at a CAGR of 19.5% during 2026-2030.

Smart Bottle market is segmented by Component (Software, Hardware) Distribution channel (Online, Offline) Product (Smart water bottles, Smart pill bottles, Others) Material (Plastic, Stainless steel, Glass, Others) Connectivity (Bluetooth, Wi-Fi, NFC) Price (Low, Medium, High)

AARDEX Group S.A., AQUAMINDER, Drinkbot Technologies., Ecomo Inc., EQUA d.o.o., Hamilton Housewares Pvt. Ltd., Hidrate Inc., Hydro Smart Bottle., Koninklijke Philips N.V., LARQ Inc., Liquisip, NOERDEN, Out of Galaxy Inc., Re Co. SA, TYLT Inc., UBO Technologies LLC, Waterh are a few of the key vendors in the Smart Bottle market.

North America will register the highest growth rate of 47.2% among the other regions. Therefore, the Smart Bottle market in North America is expected to garner significant business opportunities for the vendors during the forecast period.

US, Canada, Mexico, Germany, France, UK, Italy, Spain, The Netherlands, China, Japan, India, South Korea, Australia, Indonesia, Brazil, Argentina, Colombia, South Africa, Saudi Arabia, UAE, Egypt, Turkey

  • Growing awareness of importance of hydration is the driving factor this market.

The Smart Bottle market vendors should focus on grabbing business opportunities from the Component segment as it accounted for the largest market share in the base year.
RIA - Research AI Assistant
Ask RIA