Smart LED Indoor Signage Market Analysis North America, APAC, Europe, South America, Middle East and Africa - US, China, Japan, Canada, UK - Size and Forecast 2024-2028

Smart LED Indoor Signage Market Analysis North America, APAC, Europe, South America, Middle East and Africa - US, China, Japan, Canada, UK - Size and Forecast 2024-2028

Published: Aug 2024 186 Pages SKU: IRTNTR71543

Market Overview at a Glance

$3.94 B
Market Opportunity
29.25%
CAGR
22.22
YoY growth 2023-2024(%)

Smart LED Indoor Signage Market Size 2024-2028

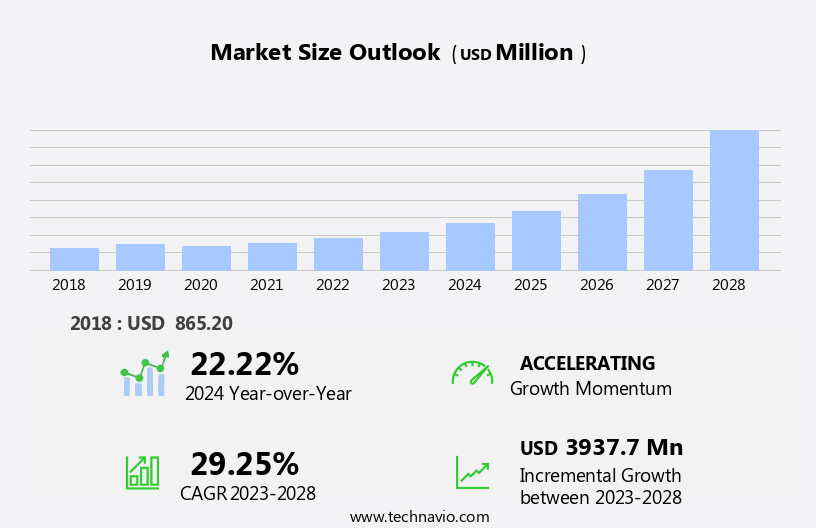
The smart led indoor signage market size is forecast to increase by USD 3.94 billion at a CAGR of 29.25% between 2023 and 2028.

  • The market is experiencing significant growth, driven by the increasing adoption of energy-efficient solutions and the rise of DIY design. With the global focus on reducing energy consumption, the low power consumption of Smart LED Indoor Signage is a key factor fueling market growth. Furthermore, the ease of DIY design and installation is attracting a large customer base, particularly among small businesses and startups. Another significant driver for the market is the growth of e-commerce and online advertising. The shift towards digital marketing and the increasing popularity of online shopping have led to a surge in demand for indoor signage solutions that can effectively display promotional content and brand messaging.
  • Additionally, the integration of advanced features such as Wi-Fi connectivity, touchscreens, and motion sensors is enhancing the functionality and value proposition of Smart LED Indoor Signage. However, the market also faces challenges, including the high initial investment costs and the need for regular maintenance and updates. The high cost of purchasing and installing Smart LED Indoor Signage can be a barrier to entry for smaller businesses and organizations. Furthermore, the rapid pace of technological advancements and the need for frequent updates can result in additional costs and complexities for businesses. To navigate these challenges, companies must focus on offering affordable financing options and providing comprehensive maintenance and support services to their customers.
  • By doing so, they can capitalize on the growing demand for Smart LED Indoor Signage and differentiate themselves from competitors.

What will be the Size of the Smart LED Indoor Signage Market during the forecast period?

Smart LED Indoor Signage Market Size

 Request Free Sample

  • The market continues to evolve, driven by advancements in technology and the increasing demand for dynamic, engaging, and interactive displays. Applications span various sectors, including corporate communications, retail marketing, and digital menu boards, among others. Seamless integration of features such as voice control, brightness levels, and remote monitoring enhances customer engagement and satisfaction. Dynamic content and remote control enable real-time updates and targeted messaging, while high-resolution displays and data visualization offer superior visual experiences. IP rating ensures durability, making these displays suitable for indoor environments. Digital out-of-home (DOOH) advertising and video walls offer new opportunities for advertising revenue and brand experience.
  • Energy efficiency and low-power consumption contribute to cost savings and sustainability. The market's continuous dynamism is reflected in emerging trends such as data analytics, customer journey mapping, employee engagement, and personalized experiences. Gesture recognition, virtual reality (VR), and augmented reality (AR) add interactivity, while content management systems facilitate content scheduling and optimization. In the retail sector, smart LED indoor signage supports omnichannel marketing strategies, retail analytics, and customer service. Wayfinding signage and cloud-based solutions streamline information dissemination and improve customer experience. The market's future lies in the integration of artificial intelligence (AI) and machine learning, enabling more effective data analysis and personalized experiences.

How is this Smart LED Indoor Signage Industry segmented?

The smart led indoor signage industry research report provides comprehensive data (region-wise segment analysis), with forecasts and estimates in "USD million" for the period 2024-2028, as well as historical data from 2018-2022 for the following segments.

  • Product
    • Less than 32 inches
    • 32 to 35 inches
    • 55 inches and above
  • End-user
    • Retail
    • QSR and restaurants
    • Education
    • Healthcare
    • Others
  • Geography
    • North America
      • US
      • Canada
    • Europe
      • UK
    • APAC
      • China
      • Japan
    • Rest of World (ROW)

    By Product Insights

    The less than 32 inches segment is estimated to witness significant growth during the forecast period.

    The market for LED indoor signage, including digital menu boards, corporate communications, and retail signage, continues to evolve with advancements in technology. High-resolution displays with immersive visuals and harmonious color reproduction are increasingly popular for digital menu boards and corporate communications, enhancing the brand experience. For retail marketing, multimedia displays with dynamic content and remote control capabilities enable real-time product promotion and customer engagement. Mounting options cater to various shop sizes and dimensions, ensuring a seamless fit for small businesses. Data analytics plays a crucial role in the customer journey, providing valuable insights for businesses to optimize their digital marketing strategies.

    Programmable LEDs and voice control offer added convenience, while brightness levels and remote monitoring ensure optimal performance. Customer satisfaction is prioritized with features such as IP rating, contrast ratio, and advertising revenue-generating capabilities. Digital out-of-home (DOOH) solutions, including video walls and interactive displays, leverage artificial intelligence (AI) and data visualization for personalized experiences. Virtual reality (VR) and augmented reality (AR) technologies further enhance the customer journey, while energy efficiency and low-power consumption contribute to cost savings. Wayfinding signage and cloud-based solutions facilitate omnichannel marketing and customer service, creating a seamless brand experience. Engagement metrics, including pixel pitch, click-through rates, and view angle, are essential considerations for businesses seeking to maximize the impact of their indoor signage investments.

    Content management systems, gesture recognition, and content scheduling enable efficient and effective use of these technologies. The future of indoor signage lies in the integration of advanced technologies such as AI, VR, AR, and data visualization, offering endless possibilities for businesses to engage customers and enhance their brand experience.

    Smart LED Indoor Signage Market Size

    Request Free Sample

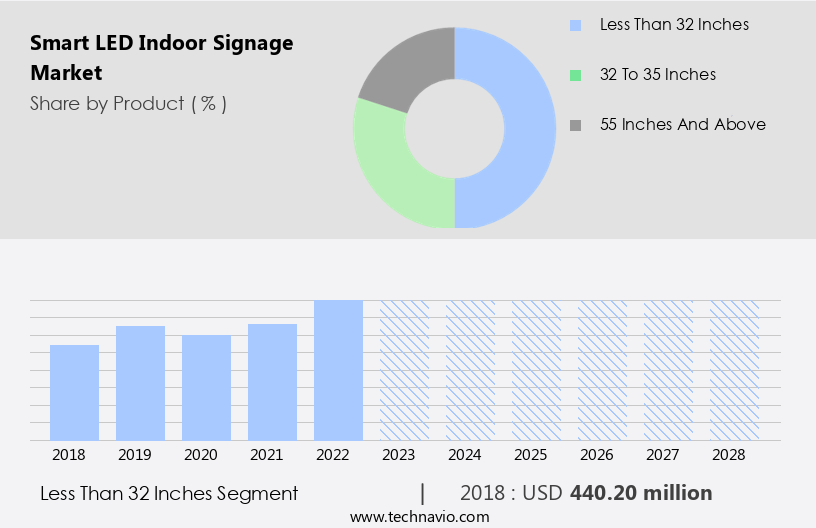
    The Less than 32 inches segment was valued at USD 440.20 billion in 2018 and showed a gradual increase during the forecast period.

    Regional Analysis

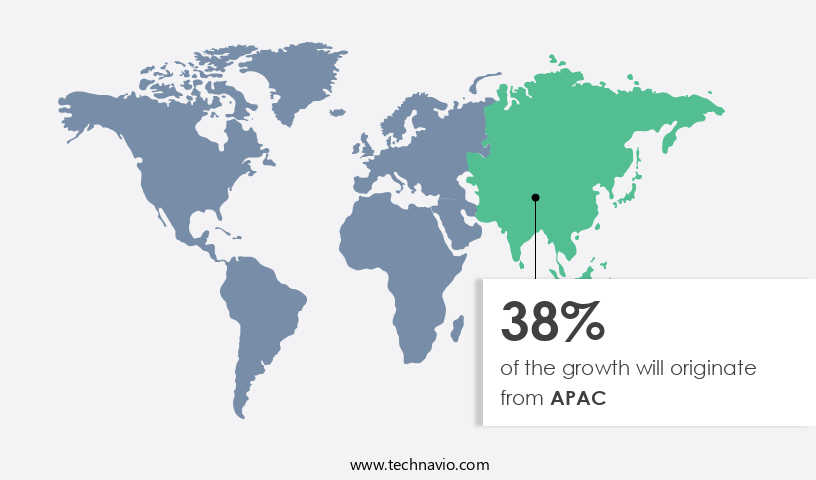
    APAC is estimated to contribute 38% to the growth of the global market during the forecast period.Technavio’s analysts have elaborately explained the regional trends and drivers that shape the market during the forecast period.

    Smart LED Indoor Signage Market Share by Geography

     Request Free Sample

    The market in North America is experiencing significant growth due to the increasing adoption of digital signage solutions for corporate communications and retail marketing. Enterprises are leveraging high-resolution, programmable LED displays to enhance customer engagement, provide personalized experiences, and gather valuable data for analytics. Mounting options catering to various indoor environments are also driving the market's expansion. Samsung's recent introduction of the new Samsung Kiosk at the National Retail Federation (NRF) event underscores this trend. The market is further fueled by the integration of advanced features such as voice control, gesture recognition, and artificial intelligence (AI) to create interactive displays.

    Virtual reality (VR) and augmented reality (AR) technologies are also gaining traction, offering immersive brand experiences. Content management systems, remote monitoring, and dynamic content updates enable enterprises to tailor their messaging to the customer journey, increasing click-through rates and advertising revenue. Energy efficiency and low-power consumption are essential considerations for indoor signage, making smart displays an attractive choice. Moreover, the integration of omnichannel marketing strategies, event promotion, and customer service through digital signage is revolutionizing the way businesses engage with their audiences. Wayfinding signage and data visualization solutions provide additional value, offering customers a seamless experience. The market's evolution is further marked by the adoption of cloud-based solutions, enabling real-time content scheduling and remote control.

    As the market continues to evolve, the focus on customer satisfaction, engagement metrics, and brand experience remains paramount.

    Market Dynamics

    Our researchers analyzed the data with 2023 as the base year, along with the key drivers, trends, and challenges. A holistic analysis of drivers will help companies refine their marketing strategies to gain a competitive advantage.

    What are the key market drivers leading to the rise in the adoption of Smart LED Indoor Signage Industry?

    • The market is driven by the fusion of low power consumption and the DIY (do-it-yourself) design trend, which caters to professionals and enthusiasts alike. 

    • Smart LED indoor signage is gaining traction in the market due to its energy efficiency and ability to enhance the customer experience. Compared to traditional digital signage, smart LED indoor signage consumes less power, leading to lower operating costs for businesses. The elimination of the need for players and extenders, which are common in traditional digital signage, further reduces power consumption. The power consumption of smart LED indoor signage depends on various factors, including the size of the display, resolution, number of LEDs, and color variants. Moreover, the integration of advanced technologies such as omnichannel marketing, retail analytics, customer service, personalized experiences, view angle, engagement metrics, and augmented reality (AR) in smart LED indoor signage is driving growth.
    • These technologies enable businesses to deliver immersive and harmonious brand experiences, providing valuable insights and improving customer engagement. The market dynamics of smart LED indoor signage are influenced by the increasing demand for information displays and smart displays that offer interactive and engaging experiences. The focus on energy efficiency and the ability to deliver real-time, targeted content are further fueling the growth of the market. As businesses continue to seek innovative ways to enhance the customer experience and optimize their marketing efforts, the demand for smart LED indoor signage is expected to increase.

    What are the market trends shaping the Smart LED Indoor Signage Industry?

    • Market trends indicate a growing emphasis on forming partnerships and collaborations. This approach is mandatory for businesses seeking to stay competitive and innovate effectively.

    • The market is witnessing an increase in partnerships and collaborations among digital signage resellers, hardware providers, software providers, and content management platforms. Major companies, including Samsung and LG, are offering partner programs to promote digital signage solutions, providing certification programs and new tools to enhance the capabilities of their partners. These programs enable partners to showcase their expertise in display technology to clients, creating a competitive edge. Digital menu boards, corporate communications, retail marketing, and employee engagement are key applications driving the growth of the market. With the rise of digital marketing strategies, high-resolution displays, multimedia displays, and programmable LEDs are becoming increasingly popular.
    • Data analytics and customer journey mapping are also essential components of smart LED indoor signage, providing valuable insights for businesses. The pixel pitch and click-through rates of these displays are crucial factors in determining their effectiveness. companies are focusing on offering immersive and harmonious signage solutions to capture the attention of consumers and emphasize the importance of clear and concise communication.

    What challenges does the Smart LED Indoor Signage Industry face during its growth?

    • The expansion of e-commerce and online advertising represents a significant challenge to the growth of traditional industries, necessitating adaptations to remain competitive in the digital marketplace. 

    • The market has witnessed significant growth due to the increasing demand for product promotion and customer engagement in various industries. With advancements in technology, these signages offer features such as high contrast ratio, voice control, and dynamic content, making them an attractive option for businesses. Brightness levels can be adjusted remotely, enabling better visibility in different lighting conditions. Moreover, remote monitoring and control add to the convenience and efficiency of these signages. IP rating ensures durability, making them suitable for indoor use. Despite these benefits, the market growth may be hindered by the relatively higher price point compared to traditional signage solutions.
    • The proliferation of digital out-of-home (DOOH) advertising displays, including video walls and LED displays, is another factor influencing market dynamics. As more businesses adopt these technologies for advertising, the demand for smart LED indoor signage may be impacted. However, customer satisfaction and the ability to create immersive, harmonious environments make these signages a worthwhile investment for businesses seeking to enhance their brand image and engage customers effectively.

    Exclusive Customer Landscape

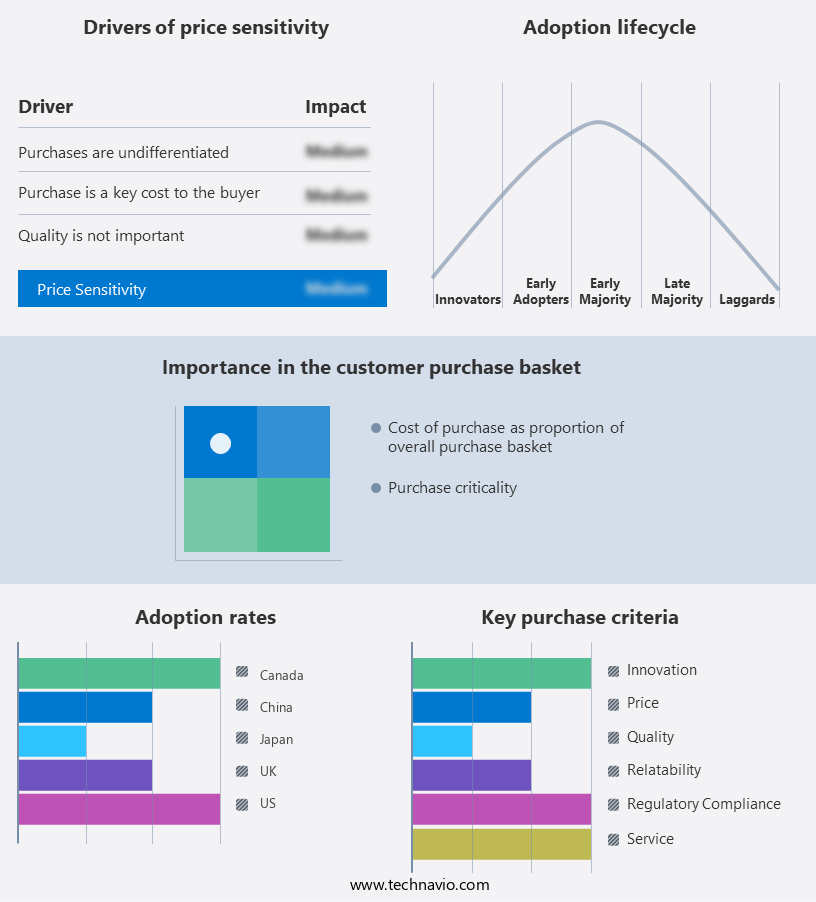
    The smart led indoor signage market forecasting report includes the adoption lifecycle of the market, covering from the innovator’s stage to the laggard’s stage. It focuses on adoption rates in different regions based on penetration. Furthermore, the smart led indoor signage market report also includes key purchase criteria and drivers of price sensitivity to help companies evaluate and develop their market growth analysis strategies.

    Smart LED Indoor Signage Market Share by Geography

     Customer Landscape

    Key Companies & Market Insights

    Companies are implementing various strategies, such as strategic alliances, smart led indoor signage market forecast, partnerships, mergers and acquisitions, geographical expansion, and product/service launches, to enhance their presence in the industry.

    Aero Digital World - The company specializes in advanced LED indoor signage solutions, including the innovative TARTAN displays. These signs leverage smart technology to enhance visual communication and engagement. The energy-efficient LED lights ensure vibrant colors and clear text, while the intelligent design adapts to various lighting conditions. By combining technology and design, the company's signage offers a modern and dynamic alternative to traditional displays. The result is a visually appealing and effective way to convey information, boost brand recognition, and captivate audiences.

    The industry research and growth report includes detailed analyses of the competitive landscape of the market and information about key companies, including:

    • Aero Digital World
    • AUO Corp.
    • Firstouch Solutions Pvt. Ltd.
    • Grandwell Industries
    • Koninklijke Philips N.V.
    • LG Corp.
    • Metroplus Advertising LLC
    • Osel Technology Pvt. Ltd.
    • Panasonic Holdings Corp.
    • Planar Systems Inc.
    • Qisda Corp.
    • Samsung Electronics Co. Ltd.
    • Shanghai Goodview Electronics Technology Co. Ltd.
    • Sharp Corp.
    • Shenzhen Absen Optoelectronic Co. Ltd.
    • Shenzhen Ledsino Optoelectronic Co. Ltd.
    • Sony Group Corp.
    • Tailong Zhixian Technology Shenzhen Co. Ltd.
    • Toshiba Corp.
    • Xtreme Media Pvt. Ltd.

    Qualitative and quantitative analysis of companies has been conducted to help clients understand the wider business environment as well as the strengths and weaknesses of key industry players. Data is qualitatively analyzed to categorize companies as pure play, category-focused, industry-focused, and diversified; it is quantitatively analyzed to categorize companies as dominant, leading, strong, tentative, and weak.

    Recent Development and News in Smart LED Indoor Signage Market

    • In January 2024, Signify, a global lighting leader, introduced its new Philips Color Kinetics Intelligent inSite Dynamic Signage Solution, combining LED lighting and digital signage capabilities (Signify Press Release). This innovation allows businesses to create engaging, interactive indoor environments while optimizing energy consumption.
    • In March 2025, LG Display and Samsung Electronics formed a strategic partnership to co-develop and commercialize large-sized OLED signage solutions, merging their expertise in display technology and manufacturing (LG Display Press Release). This collaboration aims to cater to the increasing demand for large-format, high-resolution indoor signage in various industries.
    • In June 2024, Samsung Electronics announced a USD300 million investment in its South Korean R&D center to focus on advanced display technologies, including Micro LED and QD-OLED for indoor signage applications (Samsung Press Release). This significant investment underscores the company's commitment to staying at the forefront of the rapidly evolving indoor signage market.
    • In October 2025, the European Union introduced new energy efficiency regulations for indoor signage, mandating a minimum energy performance standard and encouraging the adoption of energy-efficient LED signage (European Commission Press Release). This policy change is expected to drive demand for smart LED indoor signage solutions and contribute to the market's growth.

    Research Analyst Overview

    The market is experiencing significant growth, driven by advancements in technology and increasing demand for digital signage solutions in various industries. Wireless connectivity and data security are key considerations for businesses integrating these systems into public spaces, retail environments, corporate offices, educational institutions, healthcare facilities, and transport hubs. Screen sizes and image quality are essential factors in delivering impactful messaging, while display management software enables efficient content scheduling and design. Energy management features, ambient lighting adjustments, and color accuracy are critical for reducing operating costs and enhancing user experience (UX). Service life, maintenance costs, and remote diagnostics are essential aspects of the total cost of ownership for businesses.

    Integration with social media platforms, analytics dashboards, and advertising campaigns can boost engagement and customer feedback. Display networks, user interface (UI), video playback, and content design are essential components of effective digital signage solutions. Ambient light rejection, display calibration, and visual merchandising are crucial for optimizing performance in diverse settings. Energy management, network connectivity, and mobile app integration are emerging trends that offer additional value to businesses seeking to maximize the impact and ROI of their indoor signage investments.

    Dive into Technavio’s robust research methodology, blending expert interviews, extensive data synthesis, and validated models for unparalleled Smart LED Indoor Signage Market insights. See full methodology.

    Market Scope

    Report Coverage

    Details

    Page number

    186

    Base year

    2023

    Historic period

    2018-2022

    Forecast period

    2024-2028

    Growth momentum & CAGR

    Accelerate at a CAGR of 29.25%

    Market growth 2024-2028

    USD 3937.7 million

    Market structure

    Fragmented

    YoY growth 2023-2024(%)

    22.22

    Key countries

    US, China, Japan, Canada, and UK

    Competitive landscape

    Leading Companies, Market Positioning of Companies, Competitive Strategies, and Industry Risks

    Request Free Sample

    What are the Key Data Covered in this Smart LED Indoor Signage Market Research and Growth Report?

    • CAGR of the Smart LED Indoor Signage industry during the forecast period
    • Detailed information on factors that will drive the growth and forecasting between 2024 and 2028
    • Precise estimation of the size of the market and its contribution of the industry in focus to the parent market
    • Accurate predictions about upcoming growth and trends and changes in consumer behaviour
    • Growth of the market across North America, APAC, Europe, South America, and Middle East and Africa
    • Thorough analysis of the market’s competitive landscape and detailed information about companies
    • Comprehensive analysis of factors that will challenge the smart led indoor signage market growth of industry companies

    We can help! Our analysts can customize this smart led indoor signage market research report to meet your requirements.

    Get in touch


    1 Executive Summary

    • 1.1 Market overview
      • Executive Summary - Chart on Market Overview
      • Executive Summary - Data Table on Market Overview
      • Executive Summary - Chart on Global Market Characteristics
      • Executive Summary - Chart on Market by Geography
      • Executive Summary - Chart on Market Segmentation by Product
      • Executive Summary - Chart on Market Segmentation by End-user
      • Executive Summary - Chart on Incremental Growth
      • Executive Summary - Data Table on Incremental Growth
      • Executive Summary - Chart on Company Market Positioning

    2 Market Landscape

    • 2.1 Market ecosystem
      • Parent Market
      • Data Table on - Parent Market
    • 2.2 Market characteristics
      • Market characteristics analysis
    • 2.3 Value chain analysis
      • Value Chain Analysis

    3 Market Sizing

    • 3.1 Market definition
      • Offerings of companies included in the market definition
    • 3.2 Market segment analysis
      • Market segments
    • 3.3 Market size 2023
      • 3.4 Market outlook: Forecast for 2023-2028
        • Chart on Global - Market size and forecast 2023-2028 ($ million)
        • Data Table on Global - Market size and forecast 2023-2028 ($ million)
        • Chart on Global Market: Year-over-year growth 2023-2028 (%)
        • Data Table on Global Market: Year-over-year growth 2023-2028 (%)

      4 Historic Market Size

      • 4.1 Global Smart Led Indoor Signage Market 2018 - 2022
        • Historic Market Size - Data Table on Global Smart Led Indoor Signage Market 2018 - 2022 ($ million)
      • 4.2 Product segment analysis 2018 - 2022
        • Historic Market Size - Product Segment 2018 - 2022 ($ million)
      • 4.3 End-user segment analysis 2018 - 2022
        • Historic Market Size - End-user Segment 2018 - 2022 ($ million)
      • 4.4 Geography segment analysis 2018 - 2022
        • Historic Market Size - Geography Segment 2018 - 2022 ($ million)
      • 4.5 Country segment analysis 2018 - 2022
        • Historic Market Size - Country Segment 2018 - 2022 ($ million)

      5 Five Forces Analysis

      • 5.1 Five forces summary
        • Five forces analysis - Comparison between 2023 and 2028
      • 5.2 Bargaining power of buyers
        • Bargaining power of buyers - Impact of key factors 2023 and 2028
      • 5.3 Bargaining power of suppliers
        • Bargaining power of suppliers - Impact of key factors in 2023 and 2028
      • 5.4 Threat of new entrants
        • Threat of new entrants - Impact of key factors in 2023 and 2028
      • 5.5 Threat of substitutes
        • Threat of substitutes - Impact of key factors in 2023 and 2028
      • 5.6 Threat of rivalry
        • Threat of rivalry - Impact of key factors in 2023 and 2028
      • 5.7 Market condition
        • Chart on Market condition - Five forces 2023 and 2028

      6 Market Segmentation by Product

      • 6.1 Market segments
        • Chart on Product - Market share 2023-2028 (%)
        • Data Table on Product - Market share 2023-2028 (%)
      • 6.2 Comparison by Product
        • Chart on Comparison by Product
        • Data Table on Comparison by Product
      • 6.3 Less than 32 inches - Market size and forecast 2023-2028
        • Chart on Less than 32 inches - Market size and forecast 2023-2028 ($ million)
        • Data Table on Less than 32 inches - Market size and forecast 2023-2028 ($ million)
        • Chart on Less than 32 inches - Year-over-year growth 2023-2028 (%)
        • Data Table on Less than 32 inches - Year-over-year growth 2023-2028 (%)
      • 32 to 35 inches - Market size and forecast 2023-2028
        • Chart on 32 to 35 inches - Market size and forecast 2023-2028 ($ million)
        • Data Table on 32 to 35 inches - Market size and forecast 2023-2028 ($ million)
        • Chart on 32 to 35 inches - Year-over-year growth 2023-2028 (%)
        • Data Table on 32 to 35 inches - Year-over-year growth 2023-2028 (%)
      • 55 inches and above - Market size and forecast 2023-2028
        • Chart on 55 inches and above - Market size and forecast 2023-2028 ($ million)
        • Data Table on 55 inches and above - Market size and forecast 2023-2028 ($ million)
        • Chart on 55 inches and above - Year-over-year growth 2023-2028 (%)
        • Data Table on 55 inches and above - Year-over-year growth 2023-2028 (%)
      • 6.6 Market opportunity by Product
        • Market opportunity by Product ($ million)
        • Data Table on Market opportunity by Product ($ million)

      7 Market Segmentation by End-user

      • 7.1 Market segments
        • Chart on End-user - Market share 2023-2028 (%)
        • Data Table on End-user - Market share 2023-2028 (%)
      • 7.2 Comparison by End-user
        • Chart on Comparison by End-user
        • Data Table on Comparison by End-user
      • 7.3 Retail - Market size and forecast 2023-2028
        • Chart on Retail - Market size and forecast 2023-2028 ($ million)
        • Data Table on Retail - Market size and forecast 2023-2028 ($ million)
        • Chart on Retail - Year-over-year growth 2023-2028 (%)
        • Data Table on Retail - Year-over-year growth 2023-2028 (%)
      • 7.4 QSR and restaurants - Market size and forecast 2023-2028
        • Chart on QSR and restaurants - Market size and forecast 2023-2028 ($ million)
        • Data Table on QSR and restaurants - Market size and forecast 2023-2028 ($ million)
        • Chart on QSR and restaurants - Year-over-year growth 2023-2028 (%)
        • Data Table on QSR and restaurants - Year-over-year growth 2023-2028 (%)
      • 7.5 Education - Market size and forecast 2023-2028
        • Chart on Education - Market size and forecast 2023-2028 ($ million)
        • Data Table on Education - Market size and forecast 2023-2028 ($ million)
        • Chart on Education - Year-over-year growth 2023-2028 (%)
        • Data Table on Education - Year-over-year growth 2023-2028 (%)
      • 7.6 Healthcare - Market size and forecast 2023-2028
        • Chart on Healthcare - Market size and forecast 2023-2028 ($ million)
        • Data Table on Healthcare - Market size and forecast 2023-2028 ($ million)
        • Chart on Healthcare - Year-over-year growth 2023-2028 (%)
        • Data Table on Healthcare - Year-over-year growth 2023-2028 (%)
      • 7.7 Others - Market size and forecast 2023-2028
        • Chart on Others - Market size and forecast 2023-2028 ($ million)
        • Data Table on Others - Market size and forecast 2023-2028 ($ million)
        • Chart on Others - Year-over-year growth 2023-2028 (%)
        • Data Table on Others - Year-over-year growth 2023-2028 (%)
      • 7.8 Market opportunity by End-user
        • Market opportunity by End-user ($ million)
        • Data Table on Market opportunity by End-user ($ million)

      8 Customer Landscape

      • 8.1 Customer landscape overview
        • Analysis of price sensitivity, lifecycle, customer purchase basket, adoption rates, and purchase criteria

      9 Geographic Landscape

      • 9.1 Geographic segmentation
        • Chart on Market share by geography 2023-2028 (%)
        • Data Table on Market share by geography 2023-2028 (%)
      • 9.2 Geographic comparison
        • Chart on Geographic comparison
        • Data Table on Geographic comparison
      • 9.3 North America - Market size and forecast 2023-2028
        • Chart on North America - Market size and forecast 2023-2028 ($ million)
        • Data Table on North America - Market size and forecast 2023-2028 ($ million)
        • Chart on North America - Year-over-year growth 2023-2028 (%)
        • Data Table on North America - Year-over-year growth 2023-2028 (%)
      • 9.4 APAC - Market size and forecast 2023-2028
        • Chart on APAC - Market size and forecast 2023-2028 ($ million)
        • Data Table on APAC - Market size and forecast 2023-2028 ($ million)
        • Chart on APAC - Year-over-year growth 2023-2028 (%)
        • Data Table on APAC - Year-over-year growth 2023-2028 (%)
      • 9.5 Europe - Market size and forecast 2023-2028
        • Chart on Europe - Market size and forecast 2023-2028 ($ million)
        • Data Table on Europe - Market size and forecast 2023-2028 ($ million)
        • Chart on Europe - Year-over-year growth 2023-2028 (%)
        • Data Table on Europe - Year-over-year growth 2023-2028 (%)
      • 9.6 South America - Market size and forecast 2023-2028
        • Chart on South America - Market size and forecast 2023-2028 ($ million)
        • Data Table on South America - Market size and forecast 2023-2028 ($ million)
        • Chart on South America - Year-over-year growth 2023-2028 (%)
        • Data Table on South America - Year-over-year growth 2023-2028 (%)
      • 9.7 Middle East and Africa - Market size and forecast 2023-2028
        • Chart on Middle East and Africa - Market size and forecast 2023-2028 ($ million)
        • Data Table on Middle East and Africa - Market size and forecast 2023-2028 ($ million)
        • Chart on Middle East and Africa - Year-over-year growth 2023-2028 (%)
        • Data Table on Middle East and Africa - Year-over-year growth 2023-2028 (%)
      • 9.8 US - Market size and forecast 2023-2028
        • Chart on US - Market size and forecast 2023-2028 ($ million)
        • Data Table on US - Market size and forecast 2023-2028 ($ million)
        • Chart on US - Year-over-year growth 2023-2028 (%)
        • Data Table on US - Year-over-year growth 2023-2028 (%)
      • 9.9 China - Market size and forecast 2023-2028
        • Chart on China - Market size and forecast 2023-2028 ($ million)
        • Data Table on China - Market size and forecast 2023-2028 ($ million)
        • Chart on China - Year-over-year growth 2023-2028 (%)
        • Data Table on China - Year-over-year growth 2023-2028 (%)
      • 9.10 Japan - Market size and forecast 2023-2028
        • Chart on Japan - Market size and forecast 2023-2028 ($ million)
        • Data Table on Japan - Market size and forecast 2023-2028 ($ million)
        • Chart on Japan - Year-over-year growth 2023-2028 (%)
        • Data Table on Japan - Year-over-year growth 2023-2028 (%)
      • 9.11 Canada - Market size and forecast 2023-2028
        • Chart on Canada - Market size and forecast 2023-2028 ($ million)
        • Data Table on Canada - Market size and forecast 2023-2028 ($ million)
        • Chart on Canada - Year-over-year growth 2023-2028 (%)
        • Data Table on Canada - Year-over-year growth 2023-2028 (%)
      • 9.12 UK - Market size and forecast 2023-2028
        • Chart on UK - Market size and forecast 2023-2028 ($ million)
        • Data Table on UK - Market size and forecast 2023-2028 ($ million)
        • Chart on UK - Year-over-year growth 2023-2028 (%)
        • Data Table on UK - Year-over-year growth 2023-2028 (%)
      • 9.13 Market opportunity by geography
        • Market opportunity by geography ($ million)
        • Data Tables on Market opportunity by geography ($ million)

      10 Drivers, Challenges, and Opportunity/Restraints

      • 10.1 Market drivers
        • 10.2 Market challenges
          • 10.3 Impact of drivers and challenges
            • Impact of drivers and challenges in 2023 and 2028
          • 10.4 Market opportunities/restraints

            11 Competitive Landscape

            • 11.1 Overview
              • 11.2 Competitive Landscape
                • Overview on criticality of inputs and factors of differentiation
              • 11.3 Landscape disruption
                • Overview on factors of disruption
              • 11.4 Industry risks
                • Impact of key risks on business

              12 Competitive Analysis

              • 12.1 Companies profiled
                • Companies covered
              • 12.2 Market positioning of companies
                • Matrix on companies position and classification
              • 12.3 AUO Corp.
                • AUO Corp. - Overview
                • AUO Corp. - Business segments
                • AUO Corp. - Key news
                • AUO Corp. - Key offerings
                • AUO Corp. - Segment focus
              • 12.4 Firstouch Solutions Pvt. Ltd.
                • Firstouch Solutions Pvt. Ltd. - Overview
                • Firstouch Solutions Pvt. Ltd. - Product / Service
                • Firstouch Solutions Pvt. Ltd. - Key offerings
              • 12.5 Grandwell Industries
                • Grandwell Industries - Overview
                • Grandwell Industries - Product / Service
                • Grandwell Industries - Key offerings
              • 12.6 Koninklijke Philips N.V.
                • Koninklijke Philips N.V. - Overview
                • Koninklijke Philips N.V. - Business segments
                • Koninklijke Philips N.V. - Key news
                • Koninklijke Philips N.V. - Key offerings
                • Koninklijke Philips N.V. - Segment focus
              • 12.7 LG Corp.
                • LG Corp. - Overview
                • LG Corp. - Business segments
                • LG Corp. - Key news
                • LG Corp. - Key offerings
                • LG Corp. - Segment focus
              • 12.8 Metroplus Advertising LLC
                • Metroplus Advertising LLC - Overview
                • Metroplus Advertising LLC - Product / Service
                • Metroplus Advertising LLC - Key offerings
              • 12.9 Panasonic Holdings Corp.
                • Panasonic Holdings Corp. - Overview
                • Panasonic Holdings Corp. - Business segments
                • Panasonic Holdings Corp. - Key news
                • Panasonic Holdings Corp. - Key offerings
                • Panasonic Holdings Corp. - Segment focus
              • 12.10 Planar Systems Inc.
                • Planar Systems Inc. - Overview
                • Planar Systems Inc. - Product / Service
                • Planar Systems Inc. - Key offerings
              • 12.11 Samsung Electronics Co. Ltd.
                • Samsung Electronics Co. Ltd. - Overview
                • Samsung Electronics Co. Ltd. - Business segments
                • Samsung Electronics Co. Ltd. - Key news
                • Samsung Electronics Co. Ltd. - Key offerings
                • Samsung Electronics Co. Ltd. - Segment focus
              • 12.12 Sharp Corp.
                • Sharp Corp. - Overview
                • Sharp Corp. - Business segments
                • Sharp Corp. - Key news
                • Sharp Corp. - Key offerings
                • Sharp Corp. - Segment focus
              • 12.13 Shenzhen Absen Optoelectronic Co. Ltd.
                • Shenzhen Absen Optoelectronic Co. Ltd. - Overview
                • Shenzhen Absen Optoelectronic Co. Ltd. - Product / Service
                • Shenzhen Absen Optoelectronic Co. Ltd. - Key offerings
              • 12.14 Sony Group Corp.
                • Sony Group Corp. - Overview
                • Sony Group Corp. - Business segments
                • Sony Group Corp. - Key news
                • Sony Group Corp. - Key offerings
                • Sony Group Corp. - Segment focus
              • 12.15 Tailong Zhixian Technology Shenzhen Co. Ltd.
                • Tailong Zhixian Technology Shenzhen Co. Ltd. - Overview
                • Tailong Zhixian Technology Shenzhen Co. Ltd. - Product / Service
                • Tailong Zhixian Technology Shenzhen Co. Ltd. - Key offerings
              • 12.16 Toshiba Corp.
                • Toshiba Corp. - Overview
                • Toshiba Corp. - Business segments
                • Toshiba Corp. - Key news
                • Toshiba Corp. - Key offerings
                • Toshiba Corp. - Segment focus
              • 12.17 Xtreme Media Pvt. Ltd.
                • Xtreme Media Pvt. Ltd. - Overview
                • Xtreme Media Pvt. Ltd. - Product / Service
                • Xtreme Media Pvt. Ltd. - Key offerings

              13 Appendix

              • 13.1 Scope of the report
                • 13.2 Inclusions and exclusions checklist
                  • Inclusions checklist
                  • Exclusions checklist
                • 13.3 Currency conversion rates for US$
                  • Currency conversion rates for US$
                • 13.4 Research methodology
                  • Research methodology
                • 13.5 Data procurement
                  • Information sources
                • 13.6 Data validation
                  • Data validation
                • 13.7 Validation techniques employed for market sizing
                  • Validation techniques employed for market sizing
                • 13.8 Data synthesis
                  • Data synthesis
                • 13.9 360 degree market analysis
                  • 360 degree market analysis
                • 13.10 List of abbreviations
                  • List of abbreviations

                Research Methodology

                Technavio presents a detailed picture of the market by way of study, synthesis, and summation of data from multiple sources. The analysts have presented the various facets of the market with a particular focus on identifying the key industry influencers. The data thus presented is comprehensive, reliable, and the result of extensive research, both primary and secondary.

                INFORMATION SOURCES

                Primary sources

                • Manufacturers and suppliers
                • Channel partners
                • Industry experts
                • Strategic decision makers

                Secondary sources

                • Industry journals and periodicals
                • Government data
                • Financial reports of key industry players
                • Historical data
                • Press releases

                DATA ANALYSIS

                Data Synthesis

                • Collation of data
                • Estimation of key figures
                • Analysis of derived insights

                Data Validation

                • Triangulation with data models
                • Reference against proprietary databases
                • Corroboration with industry experts

                REPORT WRITING

                Qualitative

                • Market drivers
                • Market challenges
                • Market trends
                • Five forces analysis

                Quantitative

                • Market size and forecast
                • Market segmentation
                • Geographical insights
                • Competitive landscape

                Interested in this report?

                Get your sample now to see our research methodology and insights!

                Download Now

                Frequently Asked Questions

                Smart Led Indoor Signage market growth will increase by $ 3937.7 mn during 2024-2028.

                The Smart Led Indoor Signage market is expected to grow at a CAGR of 29.25% during 2024-2028.

                Smart Led Indoor Signage market is segmented by Product( Less than 32 inches, 32 to 35 inches, 55 inches and above, Healthcare, Others) End-user( Retail, QSR and restaurants, Education, Healthcare, Others)

                Aero Digital World, AUO Corp., Firstouch Solutions Pvt. Ltd., Grandwell Industries, Koninklijke Philips N.V., LG Corp., Metroplus Advertising LLC, Osel Technology Pvt. Ltd., Panasonic Holdings Corp., Planar Systems Inc., Qisda Corp., Samsung Electronics Co. Ltd., Shanghai Goodview Electronics Technology Co. Ltd., Sharp Corp., Shenzhen Absen Optoelectronic Co. Ltd., Shenzhen Ledsino Optoelectronic Co. Ltd., Sony Group Corp., Tailong Zhixian Technology Shenzhen Co. Ltd., Toshiba Corp., Xtreme Media Pvt. Ltd. are a few of the key vendors in the Smart Led Indoor Signage market.

                APAC will register the highest growth rate of 38% among the other regions. Therefore, the Smart Led Indoor Signage market in APAC is expected to garner significant business opportunities for the vendors during the forecast period.

                US, China, Japan, Canada, UK

                • Low power consumption and do-it-yourself (DIY) designThe power consumption of smart LED indoor signage is less than that of traditional digital signage. Low power consumption reduces the operating costs for end-users is the driving factor this market.
                • which will be one of the main factors driving the growth of the global smart LED indoor signage market. In general is the driving factor this market.
                • traditional digital signage requires a player is the driving factor this market.
                • an extender is the driving factor this market.
                • and a display. Players mostly comprise computers that require efficient cooling fans. The continuous operation of players and the use of extender equipment increase power consumption. Furthermore is the driving factor this market.
                • power consumption depends on multiple parameters is the driving factor this market.
                • such as the size of the billboard is the driving factor this market.
                • the resolution is the driving factor this market.
                • the number of LEDs is the driving factor this market.
                • and color variants. Smart LED screens contain components such as an anode is the driving factor this market.
                • a cathode is the driving factor this market.
                • and a substrate. They do not require background lighting to create visual effects is the driving factor this market.
                • which significantly reduces their power consumption. Furthermore is the driving factor this market.
                • the ultra-thin structure of smart LED screens is customizable and consumes less power than other digital signage solutions.The flexible design structure of smart LED indoor signage allows enterprises in industries such as retail and automotive to display information and advertisements both inside and outside their showrooms is the driving factor this market.
                • including on refrigerator doors and entrances. Vendors are offering different smart LED indoor signage designs to cater to the requirements of various enterprises. For instance is the driving factor this market.
                • Tailong Zhixian Technology Shenzhen Co. Ltd. offers smart LED indoor signage solutions in any screen size combination is the driving factor this market.
                • which are easy to install. Furthermore is the driving factor this market.
                • there is no need for a steel structure around the display. In addition is the driving factor this market.
                • Huake offers smart control features that enable enterprises to control the display using mobile applications is the driving factor this market.
                • besides wireless data transmission screens with cloud features or Wi-Fi.Therefore is the driving factor this market.
                • the demand for smart LED indoor signage solutions is expected to increase significantly during the forecast period. This is mainly because most market vendors are working on offering enhanced features in their products is the driving factor this market.
                • such as high transparency is the driving factor this market.
                • lightweight is the driving factor this market.
                • high brightness is the driving factor this market.
                • modular design is the driving factor this market.
                • and high picture quality with low power consumption. Thus is the driving factor this market.
                • such factors will influence the demand for smart LED indoor signage during the forecast period. is the driving factor this market.

                The Smart Led Indoor Signage market vendors should focus on grabbing business opportunities from the Less than 32 inches segment as it accounted for the largest market share in the base year.
                RIA - Research AI Assistant
                Ask RIA