Smart Personal Protective Equipment Market Size 2024-2028
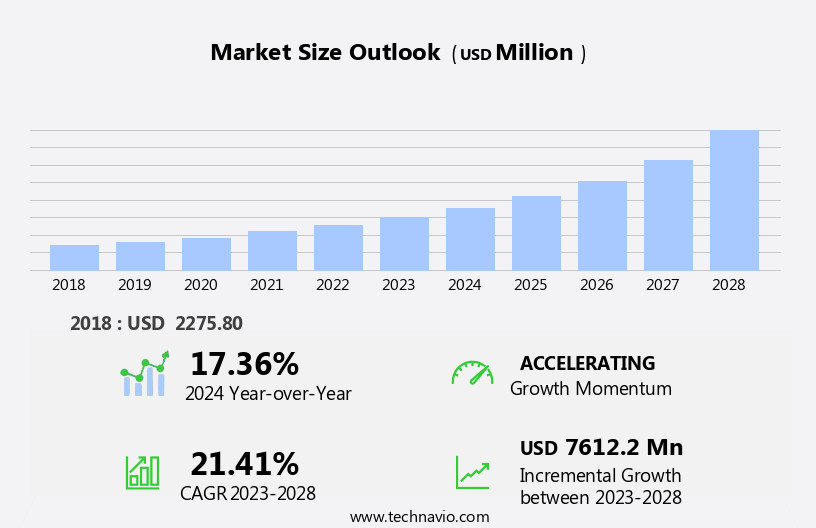
The smart personal protective equipment market size is forecast to increase by USD 7.61 billion at a CAGR of 21.41% between 2023 and 2028.
- The Smart Personal Protective Equipment (PPE) market is witnessing significant growth due to the increasing risks of physical injuries in labor-intensive industries. According to the International Labour Organization, approximately 2.3 million injury-related fatalities occur annually worldwide. Smart PPE, equipped with features like real-time monitoring, smart wearable, location tracking, and fall detection, can mitigate these risks by providing timely alerts and ensuring prompt response. Another key driver for the market is the expanding distribution channels, with smart PPE increasingly available through retail and online platforms. This not only enhances accessibility but also caters to the growing demand for advanced safety solutions.
- However, high costs associated with the development and implementation of smart PPE remain a significant challenge for market growth. Integration of advanced technologies like sensors, communication modules, and power sources adds to the overall cost, making it a significant barrier for adoption, particularly for small and medium-sized enterprises. Companies seeking to capitalize on market opportunities and navigate challenges effectively must focus on cost reduction strategies, such as economies of scale, technology partnerships, and government incentives.
What will be the Size of the Smart Personal Protective Equipment Market during the forecast period?
- The smart personal protective equipment (PPP) market continues to evolve, driven by advancements in wearable technology and the increasing demand for enhanced workplace safety. Employers across various sectors, including construction, healthcare, aerospace and defense, and mining, are adopting smart wearable systems to improve efficiency and mitigate risks. These systems incorporate smart shoes with embedded sensors and meta sensors, enabling real-time data collection on environmental conditions, user interface, and physiological parameters. Smart shoes with GPS tracking systems offer location monitoring, while data analytics capabilities provide valuable insights into worker activities, productivity, and workplace injuries. However, data security concerns remain a significant challenge, necessitating robust authentication technology to safeguard sensitive information.
- Construction workers, for instance, benefit from smart helmets with in-built sensors and connectivity features, providing real-time data on workplace hazards and enabling risk mitigation. Smart vests and safety pods offer additional protection against strikes from objects, ensuring worker safety. The ongoing unfolding of market activities reveals a growing trend towards IoT and cloud computing, enabling seamless data transfer and analysis. Smart cones and wearable devices for fall detection are also gaining popularity, enhancing workplace safety and reducing workplace fatalities. Despite the benefits, challenges persist, including counterfeiting issues and the need for comfortable, user-friendly designs. Intellinium's smart construction helmet, for example, offers an in-built sensor and AI capabilities to analyze data and provide actionable insights.
- The continuous dynamism of the smart PPE market underscores the importance of staying informed about the latest trends and applications to optimize workplace safety and efficiency.
How is this Smart Personal Protective Equipment Industry segmented?
The smart personal protective equipment industry research report provides comprehensive data (region-wise segment analysis), with forecasts and estimates in "USD million" for the period 2024-2028, as well as historical data from 2018-2022 for the following segments.
- End-user
- Firefighting industry
- Oil and gas industry
- Mining industry
- Construction industry
- Others
- Product
- Protective clothing
- Head
- eye and Face protection
- Hand and arm protection
- Foot and leg protection
- Respiratory protection
- Geography
- North America
- US
- Europe
- Germany
- UK
- APAC
- Australia
- China
- Rest of World (ROW)
- North America
By End-user Insights
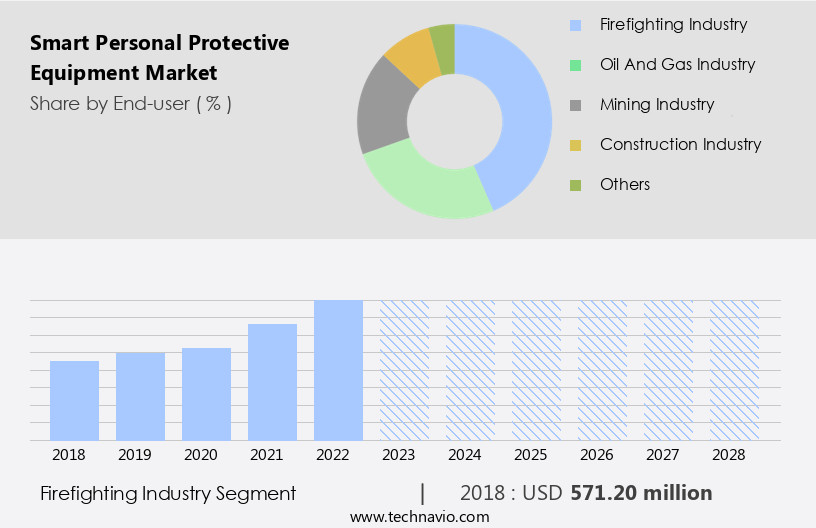
The firefighting industry segment is estimated to witness significant growth during the forecast period.
In the realm of workplace safety, businesses are increasingly investing in smart Personal Protective Equipment (PPE) to enhance the efficiency and effectiveness of their operations while ensuring the wellbeing of their workforce. Smart sensors and GPS tracking systems integrated into PPE enable real-time monitoring of environmental conditions and worker activities, providing valuable data insights for risk mitigation and productivity enhancement. Construction workers, for instance, can benefit from smart wearable systems that include embedded sensors and meta sensors, which can detect falls, strikes from objects, and other hazards. These systems can alert employers and emergency services in real-time, potentially preventing workplace fatalities and injuries.
Regulations mandating the use of advanced safety technologies are driving the demand for smart PPE, especially in high-risk industries like construction, mining, and aerospace and defense. However, data security concerns and counterfeiting issues pose challenges to the market's growth. Wearable devices, such as smart shoes, vests, and helmets, are being developed with advanced features like authentication technology, user interface, and artificial intelligence to improve performance and comfort. Data analytics capabilities and cloud computing are also being leveraged to gain valuable insights from the data generated by these systems. Overall, the smart PPE market is poised for significant growth, offering businesses a cost-effective solution to enhance workplace safety and productivity.
The Firefighting industry segment was valued at USD 571.20 billion in 2018 and showed a gradual increase during the forecast period.
Regional Analysis
North America is estimated to contribute 36% to the growth of the global market during the forecast period.Technavio's analysts have elaborately explained the regional trends and drivers that shape the market during the forecast period.
The Smart Personal Protective Equipment (PPE) market in North America is experiencing growth due to the surge in oil and gas production activities in countries like the US, Canada, and Mexico. This trend is significantly impacting industries such as aerospace and defense, mining, and construction. In construction, for instance, smart wearable systems with embedded sensors, GPS tracking, and real-time data capabilities are becoming increasingly popular. These systems offer risk mitigation, improved workplace safety, and efficiency for employers and construction workers. The market's expansion is also driven by the adoption of wearable technology, data analytics capabilities, and IoT in various industries.
However, concerns over data security and counterfeiting issues persist, requiring robust authentication technology and data security measures. Despite these challenges, the market's potential for cost savings and productivity improvements are compelling, making it an essential investment for businesses. In healthcare, smart PPE is being used to monitor physiological parameters and prevent workplace injuries and fatalities. Regulations and industry-specific applications are also contributing to the market's growth. Overall, the North American smart PPE market is expected to continue its expansion, driven by the increasing importance of workplace safety and the integration of advanced technologies.
Market Dynamics
Our researchers analyzed the data with 2023 as the base year, along with the key drivers, trends, and challenges. A holistic analysis of drivers will help companies refine their marketing strategies to gain a competitive advantage.
What are the key market drivers leading to the rise in the adoption of Smart Personal Protective Equipment Industry?
- In labor-intensive industries, the significant risk of physical injuries serves as the primary market driver.
- The market for Smart Personal Protective Equipment (PPE) is gaining traction in labor-intensive industries such as automotive, construction, manufacturing, chemicals, and ppe kit in food processing.https://https://www.technavio.com/report/ppe-market-for-food-processing-industry-analysis These industries carry a significant risk of impact-related hand injuries, including abrasion cuts, slicing cuts, and impact cuts. Hand injuries, which can result in lacerations or even amputations, lead to costly workers' compensation claims and increased emergency room visits, with an average cost of treatment exceeding USD6,000 and requiring at least 6-10 days off from work. To mitigate these risks, the adoption of advanced technologies such as IoT, cloud computing, data analysis solutions, and artificial intelligence is on the rise.
- For instance, smart helmets with connectivity features offer real-time monitoring of worker activities and provide alerts for potential hazards. Comfort is another crucial factor driving the demand for smart PPE, as traditional equipment can hinder worker productivity and increase fatigue. These advancements are revolutionizing the PPE industry, offering enhanced safety and improved worker comfort.
What are the market trends shaping the Smart Personal Protective Equipment Industry?
- The trend in the market is shifting towards expanding distribution through both retail and online channels. This approach is essential for reaching a larger customer base and staying competitive in today's business landscape.
- Smart Personal Protective Equipment (PPE) market is witnessing significant growth due to the integration of advanced technologies such as Smart sensors, GPS tracking systems, and authentication technology. These innovations enhance the performance of PPE by providing real-time monitoring of environmental conditions and location, ensuring the safety and health of workers in various industries. Cost savings is a key driver for businesses adopting smart PPE. companies are expanding their distribution channels, selling through direct sales, online platforms, and retail stores. E-commerce giants like Amazon, India MART, Medical Expo, and Alibaba are strategic partners, employing tactics such as influencer marketing and social media advertising to increase market reach.
- Online marketing reduces operational costs for companies, enabling them to offer competitive pricing. In the construction industry, for instance, smart PPE with real-time monitoring can help prevent accidents and improve overall productivity. Healthcare settings benefit from smart PPE with temperature and infection control features. Regulations continue to drive the adoption of smart PPE in industry-specific applications, ensuring compliance with safety standards. Wearable technology is revolutionizing the PPE market, offering convenience, comfort, and enhanced safety features.
What challenges does the Smart Personal Protective Equipment Industry face during its growth?
- The escalating costs of advanced PPE (Personal Protective Equipment) represent a significant barrier to growth in the industry.
- The global market for smart PPE is experiencing significant growth due to the increasing focus on employee safety and efficiency. Employers are investing in smart wearable systems, such as shoes or boots with embedded sensors and meta sensors, to enhance safety and productivity. These systems offer advanced data analytics capabilities, enabling real-time monitoring of potential hazards and providing early warnings for falls, particularly in industries like construction. However, the high cost of these smart PPE solutions is a major concern for organizations. The price includes not only the purchase cost but also the maintenance and service life expenses.
- To address this challenge, manufacturers are developing user-friendly interfaces and enhancing data security capabilities to ensure the value proposition of these wearable devices justifies their investment. Despite these advancements, data security concerns remain a significant barrier to widespread adoption. Overall, the market for smart PPE is poised for growth as organizations seek to balance the need for employee safety with the desire for operational efficiency.
Exclusive Customer Landscape
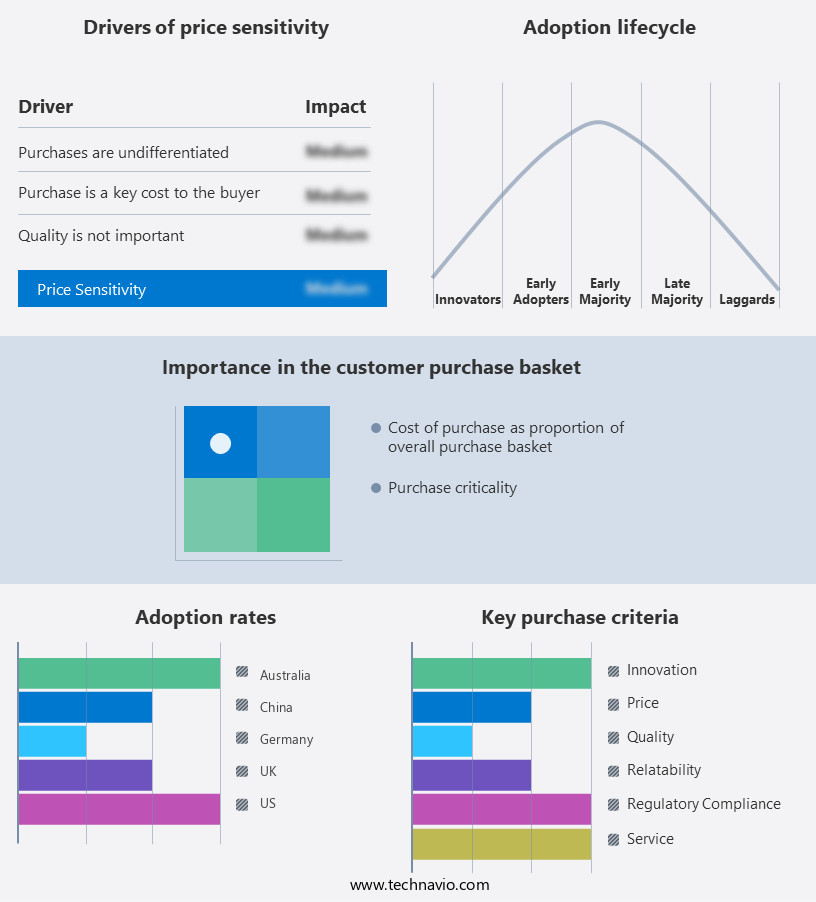
The smart personal protective equipment market forecasting report includes the adoption lifecycle of the market, covering from the innovator's stage to the laggard's stage. It focuses on adoption rates in different regions based on penetration. Furthermore, the smart personal protective equipment market report also includes key purchase criteria and drivers of price sensitivity to help companies evaluate and develop their market growth analysis strategies.
Customer Landscape
Key Companies & Market Insights
Companies are implementing various strategies, such as strategic alliances, smart personal protective equipment market forecast, partnerships, mergers and acquisitions, geographical expansion, and product/service launches, to enhance their presence in the industry.
3M Co. - This company specializes in the development and distribution of innovative sports products. Leveraging cutting-edge research and technology, we create solutions designed to enhance athletic performance and promote active lifestyles. Our offerings cater to various sports and fitness activities, ensuring versatility and applicability for diverse consumer needs. By focusing on originality and quality, we aim to elevate the user experience and set industry standards. Our commitment to continuous improvement drives US to explore new possibilities and stay at the forefront of the sports industry.
The industry research and growth report includes detailed analyses of the competitive landscape of the market and information about key companies, including:
- 3M Co.
- Ansell Ltd.
- Corvex Connected Safety
- Delta Plus Group
- Dragerwerk AG and Co. KGaA
- DuPont de Nemours Inc.
- Guardhat Inc
- Honeywell International Inc.
- Intellinium
- Iristick NV
- Kimberly Clark Corp.
- MCR Safety
- MSA Safety Inc
- North American Manufacturing
- Radians Inc.
- Rock Fall UK Ltd.
- Sioen Industries NV
- TexTech Industries Inc.
- UVEX WINTER HOLDING GmbH and Co. KG
- Vuzix Corp.
Qualitative and quantitative analysis of companies has been conducted to help clients understand the wider business environment as well as the strengths and weaknesses of key industry players. Data is qualitatively analyzed to categorize companies as pure play, category-focused, industry-focused, and diversified; it is quantitatively analyzed to categorize companies as dominant, leading, strong, tentative, and weak.
Recent Development and News in Smart Personal Protective Equipment Market
- In February 2023, Honeywell International Inc. Announced the launch of its new connected gas detection solution, Raider X3, which integrates with the Honeywell Connected Plant Suite to provide real-time gas detection and analysis for industrial facilities. This innovative product expansion underscores Honeywell's commitment to enhancing worker safety and operational efficiency in the smart PPE market (Honeywell International Inc. Press release, 2023).
- In May 2024, 3M and Microsoft Corporation entered into a strategic partnership to develop advanced safety solutions that integrate Microsoft's Azure IoT and AI technologies with 3M's PPE offerings. This collaboration aims to create a more connected and data-driven safety ecosystem, enabling real-time monitoring, predictive analytics, and automated alerts for potential hazards (Microsoft Corporation press release, 2024).
- In August 2024, Tyco International Ltd. Completed the acquisition of Sensirion AG's gas detection business, expanding its portfolio of advanced gas detection sensors and solutions. This strategic move positions Tyco as a leading player in the smart PPE market, providing a comprehensive range of gas detection products and services (Tyco International Ltd. Press release, 2024).
- In December 2025, the European Union passed the new PPE Regulation (EU) 2025/123, which mandates the integration of connected technologies and data sharing capabilities into personal protective equipment. This regulatory development is expected to drive significant growth in the smart PPE market, as manufacturers scramble to comply with the new regulations and meet the increasing demand for advanced safety solutions (European Parliament and Council of the European Union, 2025).
Research Analyst Overview
The smart Personal Protective Equipment (PPE) market is experiencing significant growth, driven by advancements in technology and increasing workplace safety regulations. Productivity improvements and labor statistics indicate that employers are investing in smart PPE solutions, such as shoes or boots with in-built sensors and smart wearable systems, to enhance safety and efficiency. Data insights from workplace injuries reveal a pressing need for advanced safety solutions. Smart sensors and user interfaces integrated into PPE, like smart vests and helmets, enable real-time data analysis and predictive maintenance. Regulations mandating the use of connected safety equipment are also fueling market expansion.
Mining and construction industries, in particular, are adopting smart PPE solutions extensively. Mining companies are implementing smart cones with embedded sensors for real-time hazard detection, while construction workers use wearable technology like the Iristick, which offers data analytics capabilities and enhanced comfort. Businesses across industries are recognizing the benefits of smart PPE, including improved safety, increased productivity, and regulatory compliance. Smart PPE systems, such as Hazardex and Intellinium, are revolutionizing workplace safety by providing connectivity and advanced safety features. The future of PPE lies in the integration of wearable technology and data analysis solutions, ensuring a safer and more productive workforce.
Dive into Technavio's robust research methodology, blending expert interviews, extensive data synthesis, and validated models for unparalleled Smart Personal Protective Equipment Market insights. See full methodology.
|
Market Scope |
|
|
Report Coverage |
Details |
|
Page number |
194 |
|
Base year |
2023 |
|
Historic period |
2018-2022 |
|
Forecast period |
2024-2028 |
|
Growth momentum & CAGR |
Accelerate at a CAGR of 21.41% |
|
Market growth 2024-2028 |
USD 7612.2 million |
|
Market structure |
Fragmented |
|
YoY growth 2023-2024(%) |
17.36 |
|
Key countries |
US, Germany, China, UK, and Australia |
|
Competitive landscape |
Leading Companies, Market Positioning of Companies, Competitive Strategies, and Industry Risks |
What are the Key Data Covered in this Smart Personal Protective Equipment Market Research and Growth Report?
- CAGR of the Smart Personal Protective Equipment industry during the forecast period
- Detailed information on factors that will drive the growth and forecasting between 2024 and 2028
- Precise estimation of the size of the market and its contribution of the industry in focus to the parent market
- Accurate predictions about upcoming growth and trends and changes in consumer behaviour
- Growth of the market across North America, Europe, APAC, South America, and Middle East and Africa
- Thorough analysis of the market's competitive landscape and detailed information about companies
- Comprehensive analysis of factors that will challenge the smart personal protective equipment market growth of industry companies
We can help! Our analysts can customize this smart personal protective equipment market research report to meet your requirements.


