Smart Railway Systems Market Analysis, Size, and Forecast 2026-2030: Europe (Germany, UK, and France), North America (US, Canada, and Mexico), APAC (China, Japan, and India), Middle East and Africa (Saudi Arabia, UAE, and South Africa), South America (Brazil, Argentina, and Colombia), and Rest of World (ROW)

Smart Railway Systems Market Analysis, Size, and Forecast 2026-2030:
Europe (Germany, UK, and France), North America (US, Canada, and Mexico), APAC (China, Japan, and India), Middle East and Africa (Saudi Arabia, UAE, and South Africa), South America (Brazil, Argentina, and Colombia), and Rest of World (ROW)

Published: Mar 2026 318 Pages SKU: IRTNTR40254

Market Overview at a Glance

$47.35 B
Market Opportunity
18.3%
CAGR 2025 - 2030
34.6%
Europe Growth
$13.18 B
Solutions segment 2024

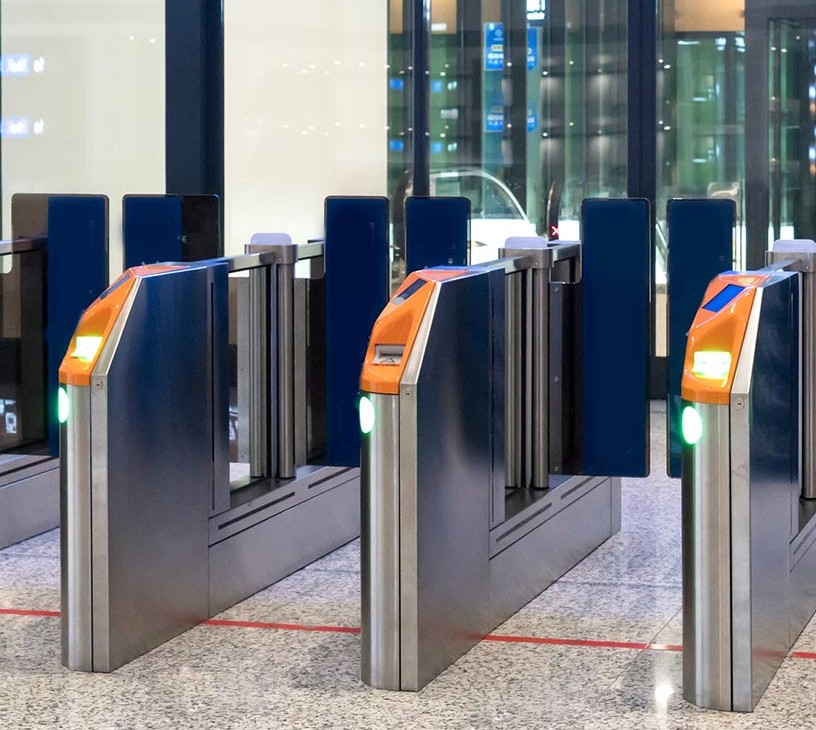
Smart Railway Systems Market Size 2026-2030

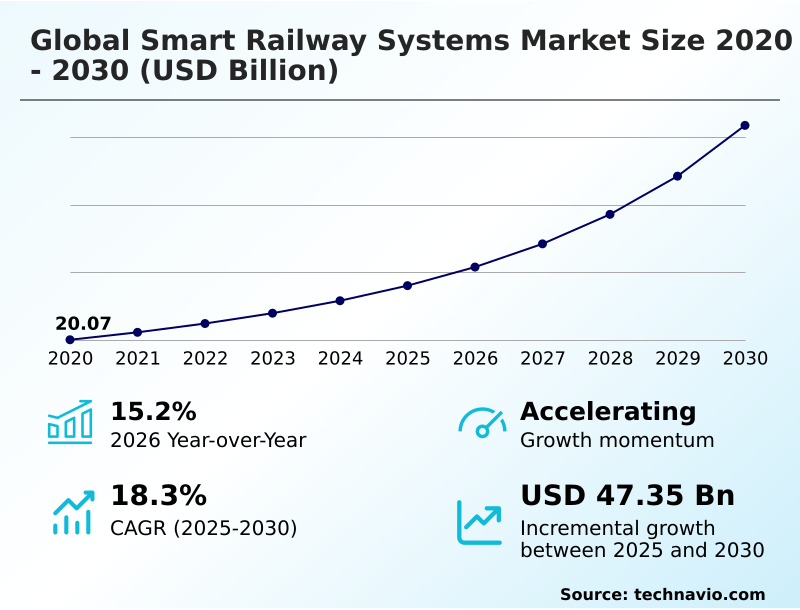
The smart railway systems market size is valued to increase by USD 47.35 billion, at a CAGR of 18.3% from 2025 to 2030. Unyielding imperative for enhanced safety and security protocols will drive the smart railway systems market.

Major Market Trends & Insights

  • Europe dominated the market and accounted for a 34.6% growth during the forecast period.
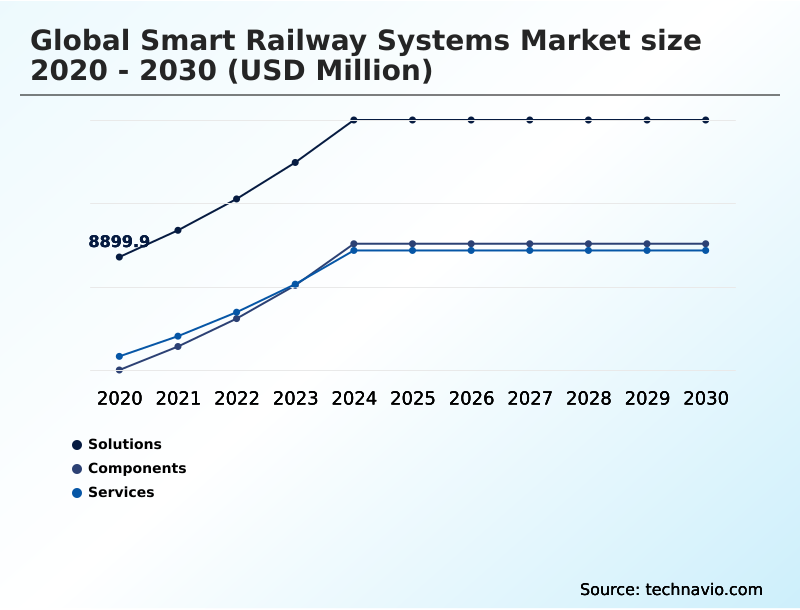
  • By Product - Solutions segment was valued at USD 13.18 billion in 2024
  • By Type - Passenger information system segment accounted for the largest market revenue share in 2024

Market Size & Forecast

  • Market Opportunities: USD 63.34 billion
  • Market Future Opportunities: USD 47.35 billion
  • CAGR from 2025 to 2030 : 18.3%

Market Summary

  • The smart railway systems market is undergoing a significant transformation, driven by the need to modernize rail infrastructure for greater efficiency, safety, and sustainability. This evolution is defined by the integration of advanced digital capabilities, including predictive maintenance platforms that utilize real-time data from extensive IoT sensor networks.
  • A key focus is the shift to condition-based maintenance, which helps optimize asset performance and reduce lifecycle costs. For example, a freight operator can leverage onboard computing and trackside analytics to predict component failures in its rolling stock, scheduling repairs proactively to prevent service disruptions and enhance network reliability.
  • While the adoption of technologies like digital twin and automated train control promises substantial benefits, the market must navigate challenges such as high initial investment costs and the need for robust interoperability standards to ensure seamless communication between legacy and modern systems.
  • The progression is toward creating a fully interconnected, data-driven ecosystem that supports both operational excellence and a superior passenger journey.

What will be the Size of the Smart Railway Systems Market during the forecast period?

Get Key Insights on Market Forecast (PDF) Request Free Sample

How is the Smart Railway Systems Market Segmented?

The smart railway systems industry research report provides comprehensive data (region-wise segment analysis), with forecasts and estimates in "USD million" for the period 2026-2030, as well as historical data from 2020-2024 for the following segments.

  • Product
    • Solutions
    • Components
    • Services
  • Type
    • Passenger information system
    • Rail and freight OMS
    • Smart ticketing system
    • Rail analytics system
    • Others
  • Deployment
    • On-premises
    • Cloud
    • Hybrid
  • Geography
    • Europe
      • Germany
      • UK
      • France
    • North America
      • US
      • Canada
      • Mexico
    • APAC
      • China
      • Japan
      • India
    • Middle East and Africa
      • Saudi Arabia
      • UAE
      • South Africa
    • South America
      • Brazil
      • Argentina
      • Colombia
    • Rest of World (ROW)

By Product Insights

The solutions segment is estimated to witness significant growth during the forecast period.

The solutions segment is central to the evolution of modern railways, providing the digital intelligence for a more connected and efficient network.

These integrated platforms enable advanced functionalities like condition-based maintenance and remote condition monitoring, shifting asset management from a reactive to a proactive model. Core offerings focus on enhancing operational control through real-time train tracking and sophisticated onboard computing.

By leveraging data for automated decision-making and intelligent traffic management, these systems are critical for network capacity enhancement.

For instance, the implementation of Mobility as a Service (MaaS) platforms has shown the potential to increase public transit integration by over 20%.

This supports the creation of a resilient transport infrastructure through proactive maintenance scheduling and seamless multimodal transport integration.

Request Free Sample

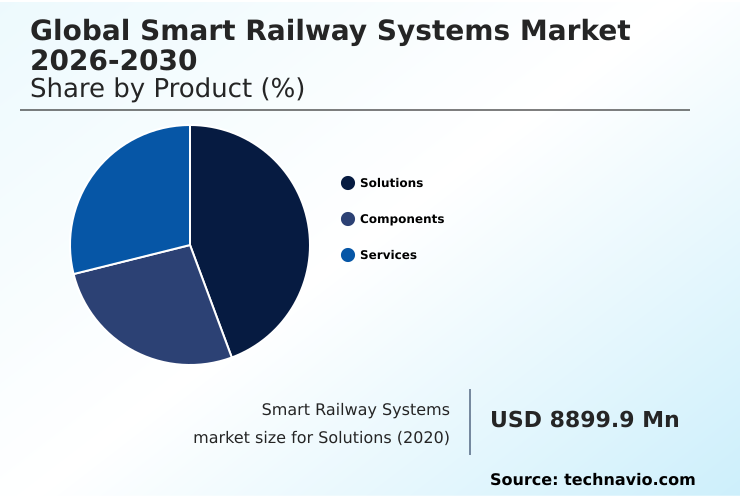
The Solutions segment was valued at USD 13.18 billion in 2024 and showed a gradual increase during the forecast period.

Request Free Sample

Regional Analysis

Europe is estimated to contribute 34.6% to the growth of the global market during the forecast period.Technavio’s analysts have elaborately explained the regional trends and drivers that shape the market during the forecast period.

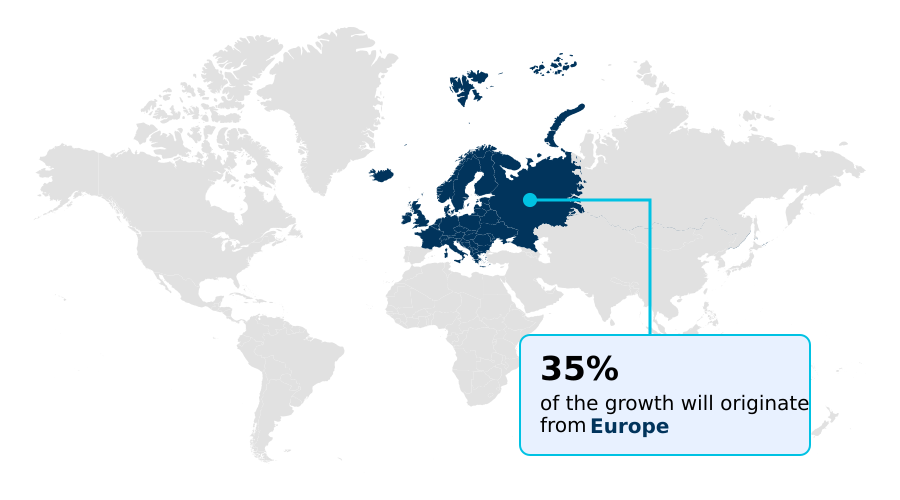
See How Smart Railway Systems Market Demand is Rising in Europe Request Free Sample

The geographic landscape of the smart railway systems market is diverse, with regional priorities shaping technology adoption. In Europe, the focus remains on enhancing cross-border connectivity, with initiatives driving demand for standardized solutions.

North America prioritizes freight efficiency, with significant investment in Positive Train Control (PTC) and automated track inspection to optimize its vast supply chain logistics.

Meanwhile, APAC is the fastest-growing region, with an 19.2% growth rate fueled by new urban mobility ecosystem projects in megacities, where Communications-Based Train Control (CBTC) and advanced passenger information systems are standard.

These projects often include high-definition surveillance and video analytics software to manage passenger flow optimization.

For instance, the deployment of smart ticketing systems in major Asian metropolitan areas has simplified multimodal journeys for millions of commuters, supporting efforts to create a seamless passenger journey and a more integrated real-time operational view for transport authorities.

Market Dynamics

Our researchers analyzed the data with 2025 as the base year, along with the key drivers, trends, and challenges. A holistic analysis of drivers will help companies refine their marketing strategies to gain a competitive advantage.

  • The global push for modernizing rail transport is creating distinct opportunities across various applications, from urban transit to heavy-haul freight. Examining the benefits of CBTC in urban rail reveals how moving block signaling significantly enhances network capacity and service frequency, a critical factor for congested cities.
  • Concurrently, the challenges of integrating legacy and new signaling systems remain a significant hurdle for brownfield projects. On high-speed lines, ETCS Level 3 implementation challenges revolve around ensuring flawless communication and data integrity for safe, high-speed operations.
  • In the freight sector, the pursuit of efficiency is leading to explorations of autonomous heavy-haul freight benefits, where automation promises substantial cost savings and safety improvements. Central to all segments is the need for effective asset management, where IoT sensor applications for track maintenance and remote diagnostics for locomotive health are becoming standard.
  • This data-driven approach, seen in the high predictive maintenance ROI for rolling stock, relies on rail analytics for service delay reduction and AI applications in railway network scheduling. As networks become more connected, addressing cybersecurity risks in automated train control and ensuring robust security solutions for rail operational technology are paramount.
  • Operators adopting these advanced data-driven asset management strategies in railways have reported a reduction in critical failures that is over 50% greater than those relying on traditional scheduled inspections, showcasing the clear advantages of this technological shift.

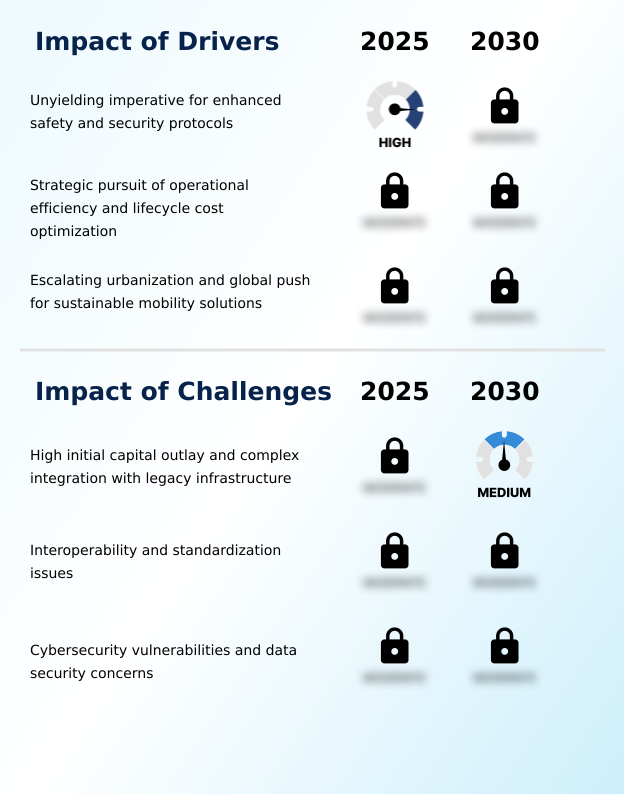
What are the key market drivers leading to the rise in the adoption of Smart Railway Systems Industry?

  • The unyielding imperative for enhanced safety and security protocols across all facets of rail operations serves as a key driver propelling investment in smart railway systems.

  • Market growth is fundamentally driven by the non-negotiable demands for enhanced safety and security, alongside the intense pressure for greater operational efficiency.
  • Regulatory mandates compelling the adoption of systems like Positive Train Control (PTC) and the European Train Control System (ETCS) create a baseline for investment, with PTC adoption being credited with reducing certain accident types by over 40%.
  • Concurrently, the pursuit of lifecycle cost optimization is fueling the deployment of smart asset management systems and digital signaling.
  • These technologies provide a clear return on investment; for example, advanced traffic management systems (TMS) can increase network capacity by up to 20% without requiring new physical track.
  • Furthermore, the global push for sustainable mobility solutions positions smart rail as a key enabler, with technologies like driver advisory systems (C-DAS) and regenerative braking optimization reducing energy consumption and supporting environmental goals.

What are the market trends shaping the Smart Railway Systems Industry?

  • The convergence of the Internet of Things (IoT) and big data analytics represents a foundational trend, establishing a new operational standard for the industry. This integration enables a fundamental shift toward intelligent, data-driven management of railway assets and infrastructure.

  • Key trends in the market are centered on creating intelligent, self-optimizing networks through the integration of digital technologies. The convergence of the Internet of Things (IoT), big data analytics, and artificial intelligence (AI) is enabling a shift toward predictive maintenance, where algorithms can forecast equipment failures with over 90% accuracy.
  • This data-driven approach is further enhanced by digital twin technology, creating virtual replicas of physical assets for simulation and analysis. The advancement toward higher grades of automation, particularly Automatic Train Operation (ATO) and the use of the moving block principle in modern signaling, is also critical.
  • These systems not only improve service reliability but have demonstrated energy savings of up to 15% on certain routes. The rollout of 5G for rail is set to accelerate these trends, providing the high-bandwidth connectivity needed for real-time data processing and advanced diagnostics.

What challenges does the Smart Railway Systems Industry face during its growth?

  • The high initial capital outlay required for deployment, combined with the complexity of integrating new digital technologies with legacy infrastructure, presents a key challenge to market growth.

  • The market faces significant challenges, primarily the high initial capital required for digital transformation in rail and the complexity of ensuring interoperability standards between new and legacy systems. Integrating next-generation signaling with older operational technology (OT) often requires bespoke solutions, elevating project costs and timelines.
  • The cost to retrofit a single line with modern automated fare collection and centralized traffic control can consume over 50% of an upgrade budget. Furthermore, the increasing connectivity of rail systems creates a larger attack surface, making cybersecurity for rail a paramount concern.
  • Recent data shows that cyber threats against critical infrastructure have risen by more than 75%, demanding substantial investment in secure communication links and high-availability systems to protect against potential disruptions and ensure the integrity of vital train control and management systems (TCMS) and wayside inspection systems.

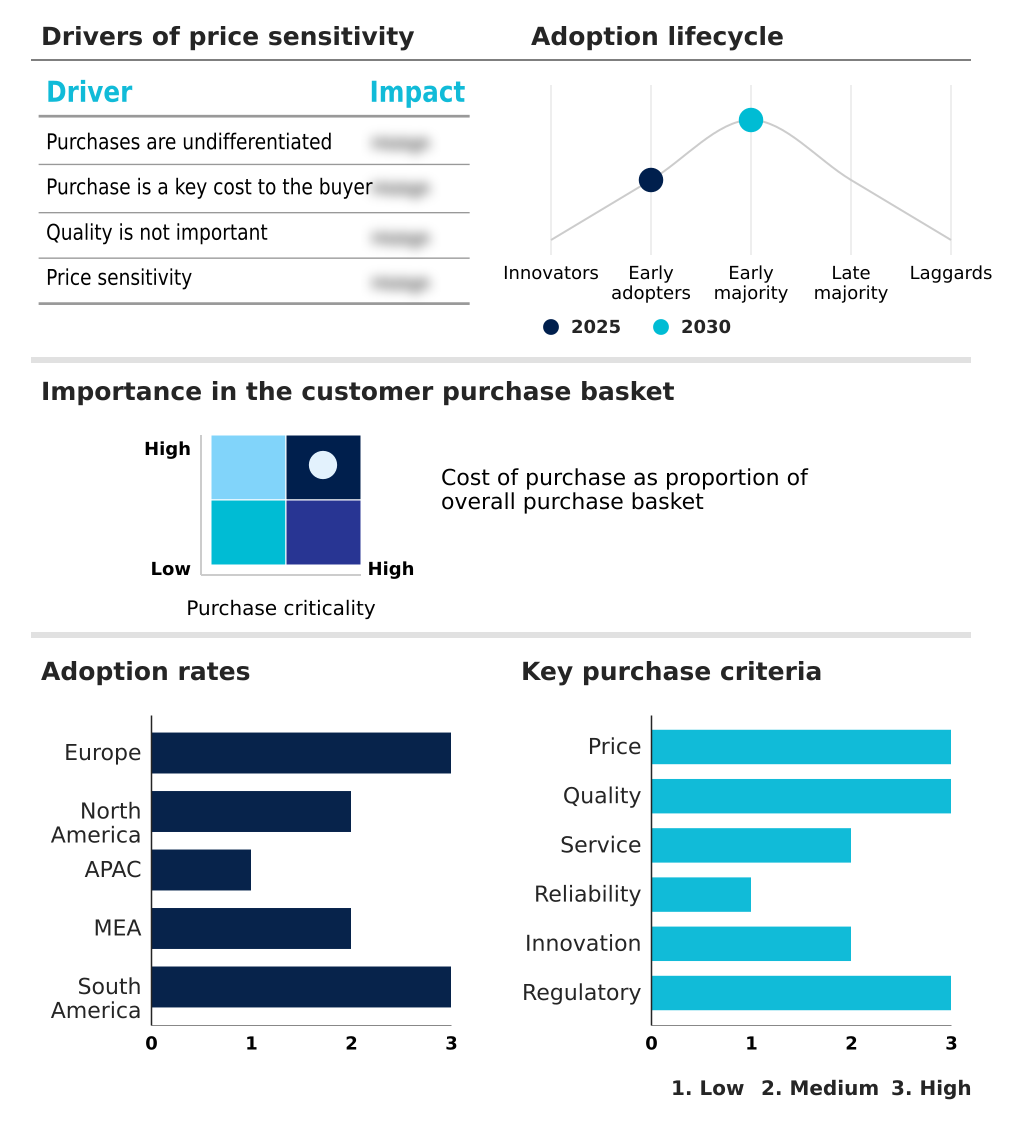
Exclusive Technavio Analysis on Customer Landscape

The smart railway systems market forecasting report includes the adoption lifecycle of the market, covering from the innovator’s stage to the laggard’s stage. It focuses on adoption rates in different regions based on penetration. Furthermore, the smart railway systems market report also includes key purchase criteria and drivers of price sensitivity to help companies evaluate and develop their market growth analysis strategies.

Customer Landscape of Smart Railway Systems Industry

Competitive Landscape

Companies are implementing various strategies, such as strategic alliances, smart railway systems market forecast, partnerships, mergers and acquisitions, geographical expansion, and product/service launches, to enhance their presence in the industry.

Advantech Co. Ltd. - Specializes in comprehensive smart railway systems, offering digital depot management, advanced CBTC signaling, and train-to-train communication to facilitate automated operations and high-frequency metro services.

The industry research and growth report includes detailed analyses of the competitive landscape of the market and information about key companies, including:

  • Advantech Co. Ltd.
  • ALSTOM SA
  • CAF Group
  • Cisco Systems Inc.
  • CRRC Corp. Ltd.
  • EKE Electronics Ltd.
  • Hitachi Rail
  • Huawei Technologies Co. Ltd.
  • IBM Corp.
  • Indra Sistemas SA
  • Kapsch TrafficCom AG
  • Kyosan Electric Mfg. Co
  • ORBCOMM Inc.
  • Siemens AG
  • Stadler Rail Ag
  • Thales Group
  • Toshiba Corp.
  • Trimble Inc.
  • Wabtec Corp.
  • ZTE Corp.

Qualitative and quantitative analysis of companies has been conducted to help clients understand the wider business environment as well as the strengths and weaknesses of key industry players. Data is qualitatively analyzed to categorize companies as pure play, category-focused, industry-focused, and diversified; it is quantitatively analyzed to categorize companies as dominant, leading, strong, tentative, and weak.

Recent Development and News in Smart railway systems market

  • In November, 2024, Alstom secured a five-year Technical Support and Spare Part Supply Agreement with the Saudi Railway Company (SAR) to enhance the operational efficiency of the diesel locomotive fleet on a vital east-west freight corridor using its HealthHub predictive maintenance platform.
  • In October, 2024, Televic GSP was chosen by Alstom to supply a complete, state-of-the-art Passenger Information System for 46 new trains for the Massachusetts Bay Transportation Authority (MBTA), featuring high-resolution displays and advanced audio announcement technology.
  • In February, 2025, Deutsche Bahn awarded a major long-term contract to a consortium led by Siemens Mobility for the nationwide rollout of digital signaling technology (DSTW) and the European Train Control System (ETCS), a cornerstone project for digitalizing Germany's rail network to boost capacity and punctuality.
  • In March, 2025, CG Power and Industrial Solutions Ltd. received a significant purchase order from Kinet Railway Solutions for a long-term supply agreement to provide critical railway components, including advanced propulsion kits and motors, for India's modern Vande Bharat trainsets.

Dive into Technavio’s robust research methodology, blending expert interviews, extensive data synthesis, and validated models for unparalleled Smart Railway Systems Market insights. See full methodology.

Market Scope
Page number 318
Base year 2025
Historic period 2020-2024
Forecast period 2026-2030
Growth momentum & CAGR Accelerate at a CAGR of 18.3%
Market growth 2026-2030 USD 47348.8 million
Market structure Fragmented
YoY growth 2025-2026(%) 15.2%
Key countries Germany, UK, France, Italy, Spain, The Netherlands, US, Canada, Mexico, China, Japan, India, South Korea, Australia, Indonesia, Saudi Arabia, UAE, South Africa, Israel, Turkey, Brazil, Argentina and Colombia
Competitive landscape Leading Companies, Market Positioning of Companies, Competitive Strategies, and Industry Risks

Request Free Sample

Research Analyst Overview

  • The smart railway systems market is defined by a strategic transition from traditional mechanical operations to an intelligent, data-driven ecosystem. This shift is centered on the deployment of core technologies like Communications-Based Train Control (CBTC), European Train Control System (ETCS), and Positive Train Control (PTC) to create safer and more efficient networks.
  • A pivotal trend is the adoption of digital twin technology, which allows operators to simulate, monitor, and manage physical assets in a virtual environment. For boardroom consideration, the decision to invest in a comprehensive predictive maintenance platform, powered by big data analytics and AI, fundamentally alters financial planning.
  • It moves expenditures from unpredictable, costly emergency repairs to manageable, data-informed operational budgets, directly impacting long-term asset value. For instance, the implementation of advanced Automatic Train Operation (ATO) systems has demonstrated the capability to improve on-time performance by over 15%, a critical metric for both passenger satisfaction and operational viability.
  • This evolution toward next-generation signaling and condition-based maintenance is reshaping the industry's approach to infrastructure management and service delivery.

What are the Key Data Covered in this Smart Railway Systems Market Research and Growth Report?

  • What is the expected growth of the Smart Railway Systems Market between 2026 and 2030?

    • USD 47.35 billion, at a CAGR of 18.3%

  • What segmentation does the market report cover?

    • The report is segmented by Product (Solutions, Components, and Services), Type (Passenger information system, Rail and freight OMS, Smart ticketing system, Rail analytics system, and Others), Deployment (On-premises, Cloud, and Hybrid) and Geography (Europe, North America, APAC, Middle East and Africa, South America)

  • Which regions are analyzed in the report?

    • Europe, North America, APAC, Middle East and Africa and South America

  • What are the key growth drivers and market challenges?

    • Unyielding imperative for enhanced safety and security protocols, High initial capital outlay and complex integration with legacy infrastructure

  • Who are the major players in the Smart Railway Systems Market?

    • Advantech Co. Ltd., ALSTOM SA, CAF Group, Cisco Systems Inc., CRRC Corp. Ltd., EKE Electronics Ltd., Hitachi Rail, Huawei Technologies Co. Ltd., IBM Corp., Indra Sistemas SA, Kapsch TrafficCom AG, Kyosan Electric Mfg. Co, ORBCOMM Inc., Siemens AG, Stadler Rail Ag, Thales Group, Toshiba Corp., Trimble Inc., Wabtec Corp. and ZTE Corp.

Market Research Insights

  • The smart railway systems market is characterized by dynamic shifts toward data-driven decision-making and lifecycle cost optimization. The emphasis on operational efficiency is paramount, with operators achieving over a 20% reduction in unplanned downtime by adopting predictive asset management strategies.
  • This move toward high-availability systems is complemented by a focus on the seamless passenger journey, where integrated ticketing and real-time information systems have contributed to a 10% increase in ridership in certain urban mobility ecosystems. Furthermore, enhanced safety and security measures, driven by strict regulatory compliance, remain a core pillar of investment.
  • These advancements underscore a strategic pivot to resilient transport infrastructure, where intelligent traffic management and proactive maintenance scheduling are not just enhancements but essential components of modern railway operations, delivering measurable improvements in both performance and financial sustainability.

We can help! Our analysts can customize this smart railway systems market research report to meet your requirements.

Get in touch

1. Executive Summary

1.1 Market overview

Executive Summary - Chart on Market Overview
Executive Summary - Data Table on Market Overview
Executive Summary - Chart on Global Market Characteristics
Executive Summary - Chart on Market by Geography
Executive Summary - Chart on Market Segmentation by Product
Executive Summary - Chart on Market Segmentation by Type
Executive Summary - Chart on Market Segmentation by Deployment
Executive Summary - Chart on Incremental Growth
Executive Summary - Data Table on Incremental Growth
Executive Summary - Chart on Company Market Positioning

2. Technavio Analysis

2.1 Analysis of price sensitivity, lifecycle, customer purchase basket, adoption rates, and purchase criteria

2.2 Criticality of inputs and Factors of differentiation

Chart on Overview on criticality of inputs and factors of differentiation

2.3 Factors of disruption

Chart on Overview on factors of disruption

2.4 Impact of drivers and challenges

Chart on Impact of drivers and challenges in 2025 and 2030

3. Market Landscape

3.1 Market ecosystem

Chart on Parent Market
Data Table on - Parent Market

3.2 Market characteristics

Chart on Market characteristics analysis

3.3 Value chain analysis

Chart on Value chain analysis

4. Market Sizing

4.1 Market definition

Data Table on Offerings of companies included in the market definition

4.2 Market segment analysis

Market segments

4.3 Market size 2025

4.4 Market outlook: Forecast for 2025-2030

Chart on Global - Market size and forecast 2025-2030 ($ million)
Data Table on Global - Market size and forecast 2025-2030 ($ million)
Chart on Global Market: Year-over-year growth 2025-2030 (%)
Data Table on Global Market: Year-over-year growth 2025-2030 (%)

5. Historic Market Size

5.1 Global Smart Railway Systems Market 2020 - 2024

Historic Market Size - Data Table on Global Smart Railway Systems Market 2020 - 2024 ($ million)

5.2 Product segment analysis 2020 - 2024

Historic Market Size - Product Segment 2020 - 2024 ($ million)

5.3 Type segment analysis 2020 - 2024

Historic Market Size - Type Segment 2020 - 2024 ($ million)

5.4 Deployment segment analysis 2020 - 2024

Historic Market Size - Deployment Segment 2020 - 2024 ($ million)

5.5 Geography segment analysis 2020 - 2024

Historic Market Size - Geography Segment 2020 - 2024 ($ million)

5.6 Country segment analysis 2020 - 2024

Historic Market Size - Country Segment 2020 - 2024 ($ million)

6. Qualitative Analysis

6.1 The AI impact on global smart railway systems market

7. Five Forces Analysis

7.1 Five forces summary

Five forces analysis - Comparison between 2025 and 2030

7.2 Bargaining power of buyers

Bargaining power of buyers - Impact of key factors 2025 and 2030

7.3 Bargaining power of suppliers

Bargaining power of suppliers - Impact of key factors in 2025 and 2030

7.4 Threat of new entrants

Threat of new entrants - Impact of key factors in 2025 and 2030

7.5 Threat of substitutes

Threat of substitutes - Impact of key factors in 2025 and 2030

7.6 Threat of rivalry

Threat of rivalry - Impact of key factors in 2025 and 2030

7.7 Market condition

Chart on Market condition - Five forces 2025 and 2030

8. Market Segmentation by Product

8.1 Market segments

Chart on Product - Market share 2025-2030 (%)
Data Table on Product - Market share 2025-2030 (%)

8.2 Comparison by Product

Chart on Comparison by Product
Data Table on Comparison by Product

8.3 Solutions - Market size and forecast 2025-2030

Chart on Solutions - Market size and forecast 2025-2030 ($ million)
Data Table on Solutions - Market size and forecast 2025-2030 ($ million)
Chart on Solutions - Year-over-year growth 2025-2030 (%)
Data Table on Solutions - Year-over-year growth 2025-2030 (%)

8.4 Components - Market size and forecast 2025-2030

Chart on Components - Market size and forecast 2025-2030 ($ million)
Data Table on Components - Market size and forecast 2025-2030 ($ million)
Chart on Components - Year-over-year growth 2025-2030 (%)
Data Table on Components - Year-over-year growth 2025-2030 (%)

8.5 Services - Market size and forecast 2025-2030

Chart on Services - Market size and forecast 2025-2030 ($ million)
Data Table on Services - Market size and forecast 2025-2030 ($ million)
Chart on Services - Year-over-year growth 2025-2030 (%)
Data Table on Services - Year-over-year growth 2025-2030 (%)

8.6 Market opportunity by Product

Market opportunity by Product ($ million)
Data Table on Market opportunity by Product ($ million)

9. Market Segmentation by Type

9.1 Market segments

Chart on Type - Market share 2025-2030 (%)
Data Table on Type - Market share 2025-2030 (%)

9.2 Comparison by Type

Chart on Comparison by Type
Data Table on Comparison by Type

9.3 Passenger information system - Market size and forecast 2025-2030

Chart on Passenger information system - Market size and forecast 2025-2030 ($ million)
Data Table on Passenger information system - Market size and forecast 2025-2030 ($ million)
Chart on Passenger information system - Year-over-year growth 2025-2030 (%)
Data Table on Passenger information system - Year-over-year growth 2025-2030 (%)

9.4 Rail and freight OMS - Market size and forecast 2025-2030

Chart on Rail and freight OMS - Market size and forecast 2025-2030 ($ million)
Data Table on Rail and freight OMS - Market size and forecast 2025-2030 ($ million)
Chart on Rail and freight OMS - Year-over-year growth 2025-2030 (%)
Data Table on Rail and freight OMS - Year-over-year growth 2025-2030 (%)

9.5 Smart ticketing system - Market size and forecast 2025-2030

Chart on Smart ticketing system - Market size and forecast 2025-2030 ($ million)
Data Table on Smart ticketing system - Market size and forecast 2025-2030 ($ million)
Chart on Smart ticketing system - Year-over-year growth 2025-2030 (%)
Data Table on Smart ticketing system - Year-over-year growth 2025-2030 (%)

9.6 Rail analytics system - Market size and forecast 2025-2030

Chart on Rail analytics system - Market size and forecast 2025-2030 ($ million)
Data Table on Rail analytics system - Market size and forecast 2025-2030 ($ million)
Chart on Rail analytics system - Year-over-year growth 2025-2030 (%)
Data Table on Rail analytics system - Year-over-year growth 2025-2030 (%)

9.7 Others - Market size and forecast 2025-2030

Chart on Others - Market size and forecast 2025-2030 ($ million)
Data Table on Others - Market size and forecast 2025-2030 ($ million)
Chart on Others - Year-over-year growth 2025-2030 (%)
Data Table on Others - Year-over-year growth 2025-2030 (%)

9.8 Market opportunity by Type

Market opportunity by Type ($ million)
Data Table on Market opportunity by Type ($ million)

10. Market Segmentation by Deployment

10.1 Market segments

Chart on Deployment - Market share 2025-2030 (%)
Data Table on Deployment - Market share 2025-2030 (%)

10.2 Comparison by Deployment

Chart on Comparison by Deployment
Data Table on Comparison by Deployment

10.3 On-premises - Market size and forecast 2025-2030

Chart on On-premises - Market size and forecast 2025-2030 ($ million)
Data Table on On-premises - Market size and forecast 2025-2030 ($ million)
Chart on On-premises - Year-over-year growth 2025-2030 (%)
Data Table on On-premises - Year-over-year growth 2025-2030 (%)

10.4 Cloud - Market size and forecast 2025-2030

Chart on Cloud - Market size and forecast 2025-2030 ($ million)
Data Table on Cloud - Market size and forecast 2025-2030 ($ million)
Chart on Cloud - Year-over-year growth 2025-2030 (%)
Data Table on Cloud - Year-over-year growth 2025-2030 (%)

10.5 Hybrid - Market size and forecast 2025-2030

Chart on Hybrid - Market size and forecast 2025-2030 ($ million)
Data Table on Hybrid - Market size and forecast 2025-2030 ($ million)
Chart on Hybrid - Year-over-year growth 2025-2030 (%)
Data Table on Hybrid - Year-over-year growth 2025-2030 (%)

10.6 Market opportunity by Deployment

Market opportunity by Deployment ($ million)
Data Table on Market opportunity by Deployment ($ million)

11. Customer Landscape

11.1 Customer landscape overview

Analysis of price sensitivity, lifecycle, customer purchase basket, adoption rates, and purchase criteria

12. Geographic Landscape

12.1 Geographic segmentation

Chart on Market share by geography 2025-2030 (%)
Data Table on Market share by geography 2025-2030 (%)

12.2 Geographic comparison

Chart on Geographic comparison
Data Table on Geographic comparison

12.3 Europe - Market size and forecast 2025-2030

Chart on Europe - Market size and forecast 2025-2030 ($ million)
Data Table on Europe - Market size and forecast 2025-2030 ($ million)
Chart on Europe - Year-over-year growth 2025-2030 (%)
Data Table on Europe - Year-over-year growth 2025-2030 (%)
Chart on Regional Comparison - Europe
Data Table on Regional Comparison - Europe

12.3.1 Germany - Market size and forecast 2025-2030

Chart on Germany - Market size and forecast 2025-2030 ($ million)
Data Table on Germany - Market size and forecast 2025-2030 ($ million)
Chart on Germany - Year-over-year growth 2025-2030 (%)
Data Table on Germany - Year-over-year growth 2025-2030 (%)

12.3.2 UK - Market size and forecast 2025-2030

Chart on UK - Market size and forecast 2025-2030 ($ million)
Data Table on UK - Market size and forecast 2025-2030 ($ million)
Chart on UK - Year-over-year growth 2025-2030 (%)
Data Table on UK - Year-over-year growth 2025-2030 (%)

12.3.3 France - Market size and forecast 2025-2030

Chart on France - Market size and forecast 2025-2030 ($ million)
Data Table on France - Market size and forecast 2025-2030 ($ million)
Chart on France - Year-over-year growth 2025-2030 (%)
Data Table on France - Year-over-year growth 2025-2030 (%)

12.3.4 Italy - Market size and forecast 2025-2030

Chart on Italy - Market size and forecast 2025-2030 ($ million)
Data Table on Italy - Market size and forecast 2025-2030 ($ million)
Chart on Italy - Year-over-year growth 2025-2030 (%)
Data Table on Italy - Year-over-year growth 2025-2030 (%)

12.3.5 Spain - Market size and forecast 2025-2030

Chart on Spain - Market size and forecast 2025-2030 ($ million)
Data Table on Spain - Market size and forecast 2025-2030 ($ million)
Chart on Spain - Year-over-year growth 2025-2030 (%)
Data Table on Spain - Year-over-year growth 2025-2030 (%)

12.3.6 The Netherlands - Market size and forecast 2025-2030

Chart on The Netherlands - Market size and forecast 2025-2030 ($ million)
Data Table on The Netherlands - Market size and forecast 2025-2030 ($ million)
Chart on The Netherlands - Year-over-year growth 2025-2030 (%)
Data Table on The Netherlands - Year-over-year growth 2025-2030 (%)

12.4 North America - Market size and forecast 2025-2030

Chart on North America - Market size and forecast 2025-2030 ($ million)
Data Table on North America - Market size and forecast 2025-2030 ($ million)
Chart on North America - Year-over-year growth 2025-2030 (%)
Data Table on North America - Year-over-year growth 2025-2030 (%)
Chart on Regional Comparison - North America
Data Table on Regional Comparison - North America

12.4.1 US - Market size and forecast 2025-2030

Chart on US - Market size and forecast 2025-2030 ($ million)
Data Table on US - Market size and forecast 2025-2030 ($ million)
Chart on US - Year-over-year growth 2025-2030 (%)
Data Table on US - Year-over-year growth 2025-2030 (%)

12.4.2 Canada - Market size and forecast 2025-2030

Chart on Canada - Market size and forecast 2025-2030 ($ million)
Data Table on Canada - Market size and forecast 2025-2030 ($ million)
Chart on Canada - Year-over-year growth 2025-2030 (%)
Data Table on Canada - Year-over-year growth 2025-2030 (%)

12.4.3 Mexico - Market size and forecast 2025-2030

Chart on Mexico - Market size and forecast 2025-2030 ($ million)
Data Table on Mexico - Market size and forecast 2025-2030 ($ million)
Chart on Mexico - Year-over-year growth 2025-2030 (%)
Data Table on Mexico - Year-over-year growth 2025-2030 (%)

12.5 APAC - Market size and forecast 2025-2030

Chart on APAC - Market size and forecast 2025-2030 ($ million)
Data Table on APAC - Market size and forecast 2025-2030 ($ million)
Chart on APAC - Year-over-year growth 2025-2030 (%)
Data Table on APAC - Year-over-year growth 2025-2030 (%)
Chart on Regional Comparison - APAC
Data Table on Regional Comparison - APAC

12.5.1 China - Market size and forecast 2025-2030

Chart on China - Market size and forecast 2025-2030 ($ million)
Data Table on China - Market size and forecast 2025-2030 ($ million)
Chart on China - Year-over-year growth 2025-2030 (%)
Data Table on China - Year-over-year growth 2025-2030 (%)

12.5.2 Japan - Market size and forecast 2025-2030

Chart on Japan - Market size and forecast 2025-2030 ($ million)
Data Table on Japan - Market size and forecast 2025-2030 ($ million)
Chart on Japan - Year-over-year growth 2025-2030 (%)
Data Table on Japan - Year-over-year growth 2025-2030 (%)

12.5.3 India - Market size and forecast 2025-2030

Chart on India - Market size and forecast 2025-2030 ($ million)
Data Table on India - Market size and forecast 2025-2030 ($ million)
Chart on India - Year-over-year growth 2025-2030 (%)
Data Table on India - Year-over-year growth 2025-2030 (%)

12.5.4 South Korea - Market size and forecast 2025-2030

Chart on South Korea - Market size and forecast 2025-2030 ($ million)
Data Table on South Korea - Market size and forecast 2025-2030 ($ million)
Chart on South Korea - Year-over-year growth 2025-2030 (%)
Data Table on South Korea - Year-over-year growth 2025-2030 (%)

12.5.5 Australia - Market size and forecast 2025-2030

Chart on Australia - Market size and forecast 2025-2030 ($ million)
Data Table on Australia - Market size and forecast 2025-2030 ($ million)
Chart on Australia - Year-over-year growth 2025-2030 (%)
Data Table on Australia - Year-over-year growth 2025-2030 (%)

12.5.6 Indonesia - Market size and forecast 2025-2030

Chart on Indonesia - Market size and forecast 2025-2030 ($ million)
Data Table on Indonesia - Market size and forecast 2025-2030 ($ million)
Chart on Indonesia - Year-over-year growth 2025-2030 (%)
Data Table on Indonesia - Year-over-year growth 2025-2030 (%)

12.6 Middle East and Africa - Market size and forecast 2025-2030

Chart on Middle East and Africa - Market size and forecast 2025-2030 ($ million)
Data Table on Middle East and Africa - Market size and forecast 2025-2030 ($ million)
Chart on Middle East and Africa - Year-over-year growth 2025-2030 (%)
Data Table on Middle East and Africa - Year-over-year growth 2025-2030 (%)
Chart on Regional Comparison - Middle East and Africa
Data Table on Regional Comparison - Middle East and Africa

12.6.1 Saudi Arabia - Market size and forecast 2025-2030

Chart on Saudi Arabia - Market size and forecast 2025-2030 ($ million)
Data Table on Saudi Arabia - Market size and forecast 2025-2030 ($ million)
Chart on Saudi Arabia - Year-over-year growth 2025-2030 (%)
Data Table on Saudi Arabia - Year-over-year growth 2025-2030 (%)

12.6.2 UAE - Market size and forecast 2025-2030

Chart on UAE - Market size and forecast 2025-2030 ($ million)
Data Table on UAE - Market size and forecast 2025-2030 ($ million)
Chart on UAE - Year-over-year growth 2025-2030 (%)
Data Table on UAE - Year-over-year growth 2025-2030 (%)

12.6.3 South Africa - Market size and forecast 2025-2030

Chart on South Africa - Market size and forecast 2025-2030 ($ million)
Data Table on South Africa - Market size and forecast 2025-2030 ($ million)
Chart on South Africa - Year-over-year growth 2025-2030 (%)
Data Table on South Africa - Year-over-year growth 2025-2030 (%)

12.6.4 Israel - Market size and forecast 2025-2030

Chart on Israel - Market size and forecast 2025-2030 ($ million)
Data Table on Israel - Market size and forecast 2025-2030 ($ million)
Chart on Israel - Year-over-year growth 2025-2030 (%)
Data Table on Israel - Year-over-year growth 2025-2030 (%)

12.6.5 Turkey - Market size and forecast 2025-2030

Chart on Turkey - Market size and forecast 2025-2030 ($ million)
Data Table on Turkey - Market size and forecast 2025-2030 ($ million)
Chart on Turkey - Year-over-year growth 2025-2030 (%)
Data Table on Turkey - Year-over-year growth 2025-2030 (%)

12.7 South America - Market size and forecast 2025-2030

Chart on South America - Market size and forecast 2025-2030 ($ million)
Data Table on South America - Market size and forecast 2025-2030 ($ million)
Chart on South America - Year-over-year growth 2025-2030 (%)
Data Table on South America - Year-over-year growth 2025-2030 (%)
Chart on Regional Comparison - South America
Data Table on Regional Comparison - South America

12.7.1 Brazil - Market size and forecast 2025-2030

Chart on Brazil - Market size and forecast 2025-2030 ($ million)
Data Table on Brazil - Market size and forecast 2025-2030 ($ million)
Chart on Brazil - Year-over-year growth 2025-2030 (%)
Data Table on Brazil - Year-over-year growth 2025-2030 (%)

12.7.2 Argentina - Market size and forecast 2025-2030

Chart on Argentina - Market size and forecast 2025-2030 ($ million)
Data Table on Argentina - Market size and forecast 2025-2030 ($ million)
Chart on Argentina - Year-over-year growth 2025-2030 (%)
Data Table on Argentina - Year-over-year growth 2025-2030 (%)

12.7.3 Colombia - Market size and forecast 2025-2030

Chart on Colombia - Market size and forecast 2025-2030 ($ million)
Data Table on Colombia - Market size and forecast 2025-2030 ($ million)
Chart on Colombia - Year-over-year growth 2025-2030 (%)
Data Table on Colombia - Year-over-year growth 2025-2030 (%)

12.8 Market opportunity by geography

Market opportunity by geography ($ million)
Data Tables on Market opportunity by geography ($ million)

13. Drivers, Challenges, and Opportunity

13.1 Market drivers

Unyielding imperative for enhanced safety and security protocols
Strategic pursuit of operational efficiency and lifecycle cost optimization
Escalating urbanization and global push for sustainable mobility solutions

13.2 Market challenges

High initial capital outlay and complex integration with legacy infrastructure
Interoperability and standardization issues
Cybersecurity vulnerabilities and data security concerns

13.3 Impact of drivers and challenges

Impact of drivers and challenges in 2025 and 2030

13.4 Market opportunities

Convergence of IoT and big data analytics as foundational enabler
Ascendancy of MaaS and prioritization of seamless passenger journey
Progressive advancement toward higher grades of automation and next-generation train control

14. Competitive Landscape

14.1 Overview

14.2

Overview on criticality of inputs and factors of differentiation

14.3 Landscape disruption

Overview on factors of disruption

14.4 Industry risks

Impact of key risks on business

15. Competitive Analysis

15.1 Companies profiled

Companies covered

15.2 Company ranking index

15.3 Market positioning of companies

Matrix on companies position and classification

15.4 Advantech Co. Ltd.

Advantech Co. Ltd. - Overview
Advantech Co. Ltd. - Business segments
Advantech Co. Ltd. - Key news
Advantech Co. Ltd. - Key offerings
Advantech Co. Ltd. - Segment focus
SWOT

15.5 ALSTOM SA

ALSTOM SA - Overview
ALSTOM SA - Business segments
ALSTOM SA - Key offerings
ALSTOM SA - Segment focus
SWOT

15.6 CAF Group

CAF Group - Overview
CAF Group - Product / Service
CAF Group - Key offerings
SWOT

15.7 Cisco Systems Inc.

Cisco Systems Inc. - Overview
Cisco Systems Inc. - Business segments
Cisco Systems Inc. - Key news
Cisco Systems Inc. - Key offerings
Cisco Systems Inc. - Segment focus
SWOT

15.8 EKE Electronics Ltd.

EKE Electronics Ltd. - Overview
EKE Electronics Ltd. - Product / Service
EKE Electronics Ltd. - Key offerings
SWOT

15.9 Hitachi Rail

Hitachi Rail - Overview
Hitachi Rail - Product / Service
Hitachi Rail - Key offerings
SWOT

15.10 Huawei Technologies Co. Ltd.

Huawei Technologies Co. Ltd. - Overview
Huawei Technologies Co. Ltd. - Product / Service
Huawei Technologies Co. Ltd. - Key news
Huawei Technologies Co. Ltd. - Key offerings
SWOT

15.11 IBM Corp.

IBM Corp. - Overview
IBM Corp. - Business segments
IBM Corp. - Key news
IBM Corp. - Key offerings
IBM Corp. - Segment focus
SWOT

15.12 Kyosan Electric Mfg. Co

Kyosan Electric Mfg. Co - Overview
Kyosan Electric Mfg. Co - Product / Service
Kyosan Electric Mfg. Co - Key offerings
SWOT

15.13 Siemens AG

Siemens AG - Overview
Siemens AG - Business segments
Siemens AG - Key news
Siemens AG - Key offerings
Siemens AG - Segment focus
SWOT

15.14 Stadler Rail Ag

Stadler Rail Ag - Overview
Stadler Rail Ag - Business segments
Stadler Rail Ag - Key offerings
Stadler Rail Ag - Segment focus
SWOT

15.15 Toshiba Corp.

Toshiba Corp. - Overview
Toshiba Corp. - Business segments
Toshiba Corp. - Key news
Toshiba Corp. - Key offerings
Toshiba Corp. - Segment focus
SWOT

15.16 Trimble Inc.

Trimble Inc. - Overview
Trimble Inc. - Business segments
Trimble Inc. - Key news
Trimble Inc. - Key offerings
Trimble Inc. - Segment focus
SWOT

15.17 Wabtec Corp.

Wabtec Corp. - Overview
Wabtec Corp. - Business segments
Wabtec Corp. - Key offerings
Wabtec Corp. - Segment focus
SWOT

15.18 ZTE Corp.

ZTE Corp. - Overview
ZTE Corp. - Business segments
ZTE Corp. - Key offerings
ZTE Corp. - Segment focus
SWOT

16. Appendix

16.1 Scope of the report

Market definition
Objectives
Notes and caveats

16.2 Inclusions and exclusions checklist

Inclusions checklist
Exclusions checklist

16.3 Currency conversion rates for US$

16.4 Research methodology

16.5 Data procurement

Information sources

16.6 Data validation

16.7 Validation techniques employed for market sizing

16.8 Data synthesis

16.9 360 degree market analysis

16.10 List of abbreviations

Research Methodology

Technavio presents a detailed picture of the market by way of study, synthesis, and summation of data from multiple sources. The analysts have presented the various facets of the market with a particular focus on identifying the key industry influencers. The data thus presented is comprehensive, reliable, and the result of extensive research, both primary and secondary.

INFORMATION SOURCES

Primary sources

  • Manufacturers and suppliers
  • Channel partners
  • Industry experts
  • Strategic decision makers

Secondary sources

  • Industry journals and periodicals
  • Government data
  • Financial reports of key industry players
  • Historical data
  • Press releases

DATA ANALYSIS

Data Synthesis

  • Collation of data
  • Estimation of key figures
  • Analysis of derived insights

Data Validation

  • Triangulation with data models
  • Reference against proprietary databases
  • Corroboration with industry experts

REPORT WRITING

Qualitative

  • Market drivers
  • Market challenges
  • Market trends
  • Five forces analysis

Quantitative

  • Market size and forecast
  • Market segmentation
  • Geographical insights
  • Competitive landscape

Interested in this report?

Get your sample now to see our research methodology and insights!

Download Now

Frequently Asked Questions

Smart Railway Systems market growth will increase by USD 47348.8 million during 2026-2030.

The Smart Railway Systems market is expected to grow at a CAGR of 18.3% during 2026-2030.

Smart Railway Systems market is segmented by Product (Solutions, Components, Services) Type (Passenger information system, Rail and freight OMS, Smart ticketing system, Rail analytics system, Others) Deployment (On-premises, Cloud, Hybrid)

Advantech Co. Ltd., ALSTOM SA, CAF Group, Cisco Systems Inc., CRRC Corp. Ltd., EKE Electronics Ltd., Hitachi Rail, Huawei Technologies Co. Ltd., IBM Corp., Indra Sistemas SA, Kapsch TrafficCom AG, Kyosan Electric Mfg. Co, ORBCOMM Inc., Siemens AG, Stadler Rail Ag, Thales Group, Toshiba Corp., Trimble Inc., Wabtec Corp., ZTE Corp. are a few of the key vendors in the Smart Railway Systems market.

Europe will register the highest growth rate of 34.6% among the other regions. Therefore, the Smart Railway Systems market in Europe is expected to garner significant business opportunities for the vendors during the forecast period.

Germany, UK, France, Italy, Spain, The Netherlands, US, Canada, Mexico, China, Japan, India, South Korea, Australia, Indonesia, Saudi Arabia, UAE, South Africa, Israel, Turkey, Brazil, Argentina, Colombia

  • Unyielding imperative for enhanced safety and security protocols is the driving factor this market.

The Smart Railway Systems market vendors should focus on grabbing business opportunities from the Product segment as it accounted for the largest market share in the base year.
RIA - Research AI Assistant
Ask RIA