Smart Shoes Market Analysis, Size, and Forecast 2024-2028: North America (US), Europe (France, Germany, and UK), APAC (China), and Rest of World (ROW)

Smart Shoes Market Analysis, Size, and Forecast 2024-2028:
North America (US), Europe (France, Germany, and UK), APAC (China), and Rest of World (ROW)

Published: Aug 2024 170 Pages SKU: IRTNTR70304

Market Overview at a Glance

$984.9 Mn
Market Opportunity
28.4%
CAGR
22.17
YoY growth 2023-2024(%)

Smart Shoes Market Size 2024-2028

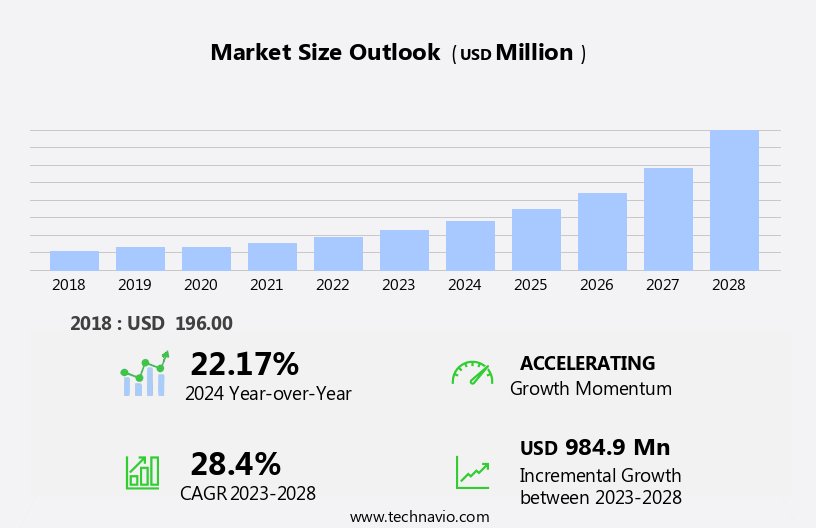
The smart shoes market size is forecast to increase by USD 984.9 million, at a CAGR of 28.4% between 2023 and 2028.

  • The market is experiencing significant growth, driven by the increasing trend towards product innovation and premiumization. Manufacturers are integrating advanced technologies into footwear, offering features such as personalized fitness coaching and seamless integration with wearable devices. This market dynamic is transforming the footwear industry, as consumers seek more functional and tech-savvy options. However, this market landscape is not without challenges. One major obstacle is the complex integration of various technologies into a single product. Ensuring compatibility and seamless functionality between different components is a significant hurdle for manufacturers.
  • Additionally, ensuring user-friendly design and affordability remains crucial in a competitive market. Companies must navigate these challenges while continuing to innovate and meet evolving consumer demands to capitalize on the growing potential of the market.

What will be the Size of the Smart Shoes Market during the forecast period?

Smart Shoes Market Size

Explore in-depth regional segment analysis with market size data - historical 2018-2022 and forecasts 2024-2028 - in the full report.  
Request Free Sample

The market continues to evolve, integrating advanced technologies to enhance user experience and expand applications across various sectors. Pressure sensors and mobile app integration enable real-time analysis of user data, including posture and gait. User profiles and water resistance cater to diverse needs, while data transmission and machine learning facilitate personalized health recommendations. Human factors and data privacy are prioritized, ensuring seamless integration of biometric data and activity tracking. Predictive analytics and fitness goals drive user engagement, with smart insoles offering additional health benefits, such as diabetes management and physical therapy. Sensor fusion, power management, and customer support further enhance functionality.

The market's continuous dynamism extends to software development, material science, and user interface, with wireless communication, Bluetooth connectivity, and security protocols ensuring seamless integration. Smart shoe applications span from medical to fitness, with regulatory compliance and pricing strategies shaping sales channels. Ongoing advancements in battery life, firmware updates, and charging technology further propel market growth.

How is this Smart Shoes Industry segmented?

The smart shoes industry research report provides comprehensive data (region-wise segment analysis), with forecasts and estimates in "USD million" for the period 2024-2028, as well as historical data from 2018-2022 for the following segments.

  • Distribution Channel
    • Offline
    • Online
  • End-user
    • Adults
    • Senior citizens
    • Users with disability
    • Kids
  • Product Type
    • Fitness Tracking Shoes
    • Navigation Shoes
    • Smart Running Shoes
  • Technology
    • Sensors
    • GPS
    • Bluetooth Connectivity
    • AI Integration
  • Geography
    • North America
      • US
    • Europe
      • France
      • Germany
      • UK
    • APAC
      • China
    • Rest of World (ROW)

By Distribution Channel Insights

The offline segment is estimated to witness significant growth during the forecast period.

The global market for smart shoes is witnessing significant growth due to the integration of advanced technologies such as wearable technology, posture analysis, and calorie tracking. These shoes offer physical therapy benefits, including fall detection, balance assessment, and gait analysis. Wireless communication features enable seamless data transmission to mobile apps for user profiles and real-time health recommendations. Battery life is a crucial factor, with manufacturers focusing on power management and energy harvesting for extended usage. Regulatory compliance and data privacy are essential considerations, with firms implementing robust security protocols and machine learning algorithms for data analytics. Smart insoles with pressure sensors and step counting capabilities are gaining popularity, while predictive analytics and fitness goals help users monitor their progress.

Healthcare professionals are increasingly recommending these shoes for diabetes management and rehabilitation. Pricing strategies vary, with offline distribution channels dominating due to convenience and product variety. Specialty stores like STADIUM GOODS and brand stores such as Nike cater to consumers seeking a wide range of options. Online sales channels are also growing, with e-commerce platforms offering competitive pricing and ease of access. Software development and personalization algorithms enable customized user experiences, while material science innovations ensure water resistance and durability. Bluetooth connectivity and wi-fi capabilities facilitate seamless integration with other health and fitness devices. Quality control, supply chain management, and customer support are essential components of the market, with firms focusing on ensuring product reliability and user satisfaction.

The integration of artificial intelligence and machine learning enhances the overall user experience and enables real-time health monitoring and recommendations. In conclusion, the market is evolving rapidly, with a focus on advanced technologies, user experience, and healthcare applications. Firms are investing in research and development, regulatory compliance, and customer support to meet the growing demand for these innovative products.

Smart Shoes Market Size

Request Free Sample

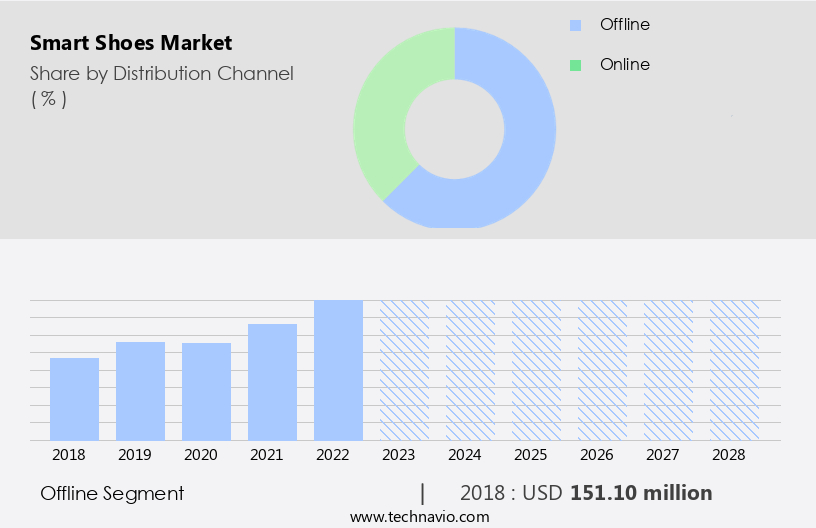
The Offline segment was valued at USD 151.10 million in 2018 and showed a gradual increase during the forecast period.

Regional Analysis

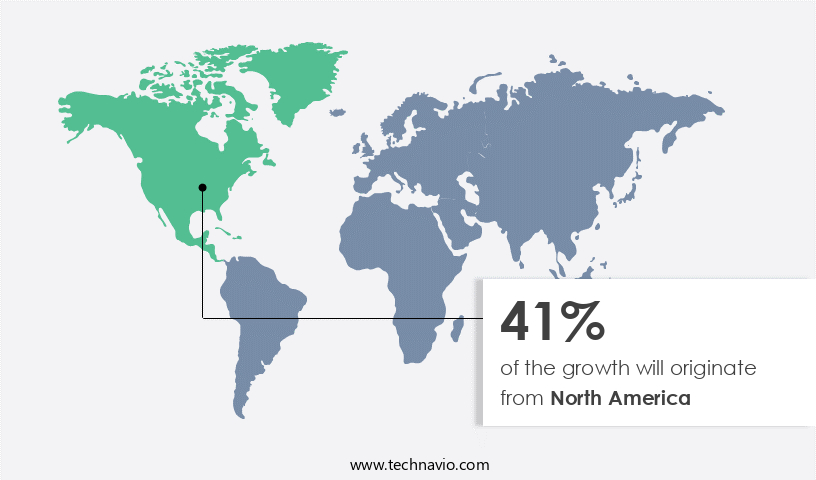
North America is estimated to contribute 41% to the growth of the global market during the forecast period.Technavio's analysts have elaborately explained the regional trends and drivers that shape the market during the forecast period.

Smart Shoes Market Share by Geography

 Request Free Sample

The market in North America is experiencing significant growth due to increasing consumer interest in wearable technology and prioritization of health and fitness. Advanced features such as posture analysis, calorie tracking, physical therapy, fall detection, balance assessment, and sleep monitoring are driving demand for these innovative shoes. Wireless communication, firmware updates, and mobile app integration offer seamless user experiences, while biometric data collection and machine learning enable personalized health recommendations. Regulatory compliance and data privacy are crucial considerations, ensuring user trust and satisfaction. Smart insoles, step counting, power management, and customer support are essential features that cater to diverse consumer needs.

Diabetes management and gait analysis are medical applications that expand the market's reach. The integration of artificial intelligence, fitness goals, and predictive analytics enhances user experience and engagement. With the growing popularity of smart shoes, companies focus on quality control, supply chain management, energy harvesting, and smart shoe integration. The market's evolution is fueled by advancements in material science, user interface, and connectivity technologies like Bluetooth and Wi-Fi. Target demographics include fitness enthusiasts, healthcare professionals, and individuals with specific health conditions. Technical support and sales channels ensure accessibility and convenience for consumers.

Market Dynamics

Our researchers analyzed the data with 2023 as the base year, along with the key drivers, trends, and challenges. A holistic analysis of drivers will help companies refine their marketing strategies to gain a competitive advantage.

In the dynamic world of technology, the market is making significant strides, merging fashion and function in innovative ways. These shoes, equipped with advanced technologies, offer features such as activity tracking, wireless charging, health monitoring, and even haptic feedback. Smart shoes are designed with premium materials, ensuring both style and durability. They cater to diverse consumer needs, including those with diabetes, athletes, and fashion enthusiasts. The integration of AI and IoT in smart shoes enhances user experience, providing personalized recommendations and real-time alerts. With features like fall detection, weather resistance, and customizable designs, smart shoes are revolutionizing footwear, offering a blend of technology, comfort, and style.

What are the key market drivers leading to the rise in the adoption of Smart Shoes Industry?

  • Product innovation's continuous advancement is the primary catalyst for the market's increasing trend toward premium offerings. 
  • The market is experiencing significant growth due to the increasing adoption of wearable technology for health and fitness applications. These advanced shoes incorporate features such as posture analysis, calorie tracking, physical therapy, fall detection, balance assessment, wireless communication, sleep monitoring, and firmware updates. Consumers are increasingly seeking these innovative solutions to enhance their fitness routines and monitor their biometric data in real-time. To remain competitive, market players must prioritize continuous product innovation and regulatory compliance. User experience is a crucial factor in the market's success, and companies must ensure their offerings are intuitive and user-friendly. Smart shoes with features like step-counting, real-time feedback, and immersive user experiences are popular among consumers engaged in athletic and fitness activities.
  • Battery life is another essential consideration for consumers, as they require shoes that can last throughout their workouts. Additionally, the ability to receive firmware updates ensures that the shoes remain technologically advanced and provide accurate data. The market's growth is driven by the increasing awareness of health and fitness, the availability of advanced wearable technology, and the convenience of integrating fitness tracking into daily life. As the market continues to evolve, we can expect to see further advancements in biometric data collection, wireless communication, and battery life, making smart shoes an essential tool for those seeking to optimize their fitness routines.

What are the market trends shaping the Smart Shoes Industry?

  • Personalized fitness coaching is an emerging trend in the market. As a professional virtual assistant, I can connect you with knowledgeable coaches who provide customized fitness programs to help you reach your health goals.
  • The market is witnessing significant advancements as companies introduce innovative features to cater to evolving consumer needs. These new offerings include pressure sensors, mobile app integration, and user profiles, among others. Water resistance is another essential feature, ensuring shoes remain functional during various weather conditions. Data transmission enables real-time monitoring and analysis, while machine learning algorithms offer personalized recommendations based on individual fitness goals. Sensor fusion technology allows for accurate activity tracking, providing valuable insights into users' physical performance. Predictive analytics offer customized health recommendations, enhancing overall wellness. Smart insoles are a popular choice due to their discreet design and ability to seamlessly integrate with daily routines.
  • Human factors are prioritized, ensuring data privacy and security. Competition in the market is intense, leading companies to continuously innovate and improve their offerings. These advancements include personalized coaching, suggesting dietary requirements, workout plans, and further improvement plans based on individual fitness goals. By focusing on user experience, companies aim to create immersive, harmonious experiences that strike a balance between functionality and style. In conclusion, recent research indicates a growing trend towards smart shoes, offering numerous benefits for users seeking to enhance their fitness journey.

What challenges does the Smart Shoes Industry face during its growth?

  • The expansion of the wearable fitness device market poses a significant challenge to the industry's growth trajectory. 
  • The market is experiencing significant growth due to the increasing demand for footwear that integrates advanced technologies. These shoes offer features such as step counting, power management, and GPS modules, making them popular among athletes and fitness enthusiasts. Additionally, smart shoes are increasingly being used for medical applications, particularly in diabetes management, where they can help monitor glucose levels and provide real-time alerts. The integration of artificial intelligence (AI) and personalization algorithms enables these shoes to provide customized fitness plans and recommendations based on individual user data. Furthermore, energy harvesting technology is being used to power these shoes, eliminating the need for frequent battery replacements.
  • Customer support and quality control are crucial aspects of the market, ensuring that the shoes are functioning optimally and providing accurate data. Supply chain management is also a significant consideration, as the production and distribution of these shoes require a high level of coordination and efficiency. Software development is a critical component of smart shoes, enabling the integration of various features and ensuring seamless connectivity with other devices. GPS modules allow users to track their location and distance covered during workouts, while fitness trackers provide real-time data on steps taken, calories burned, and other metrics.
  • In conclusion, The market is driven by the demand for footwear that offers advanced features and functionality, particularly in the areas of fitness and health management. The integration of AI, energy harvesting, and other technologies is enabling the development of innovative products that meet the evolving needs of consumers.

Exclusive Customer Landscape

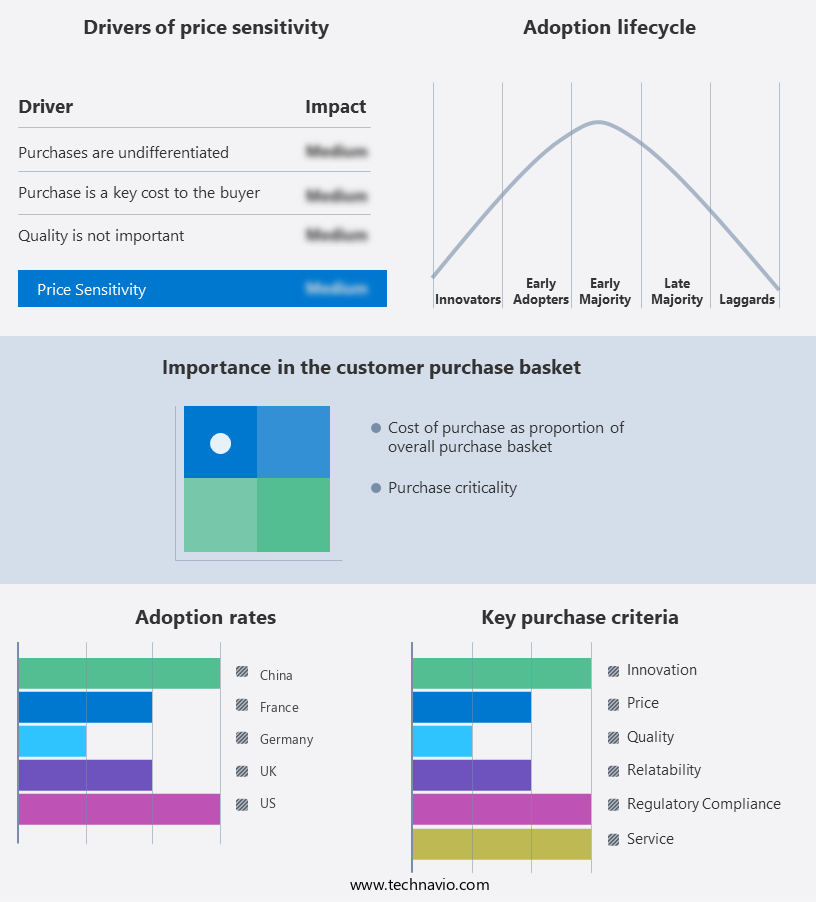
The smart shoes market forecasting report includes the adoption lifecycle of the market, covering from the innovator's stage to the laggard's stage. It focuses on adoption rates in different regions based on penetration. Furthermore, the smart shoes market report also includes key purchase criteria and drivers of price sensitivity to help companies evaluate and develop their market growth analysis strategies.

Smart Shoes Market Share by Geography

 Customer Landscape

Key Companies & Market Insights

Companies are implementing various strategies, such as strategic alliances, smart shoes market forecast, partnerships, mergers and acquisitions, geographical expansion, and product/service launches, to enhance their presence in the industry.

Adidas AG - The company introduces innovative footwear solutions, branded as SmartShoesX. These advanced shoes integrate cutting-edge technology, enhancing user experience and functionality. SmartShoesX embody superior comfort, adaptability, and performance through features like adjustable insoles, biometric sensors, and energy-returning soles. 

The industry research and growth report includes detailed analyses of the competitive landscape of the market and information about key companies, including:

  • Adidas AG
  • Alegria Shoes
  • ASICS Corp.
  • Digitsole
  • Ducere Technologies Inc.
  • ELTEN GmbH
  • FeetMe
  • Groupe Artemis
  • Li Ning Co. Ltd.
  • Nike Inc.
  • Powerlace Technology Inc.
  • ReTiSense Inc.
  • SALTED Co. Ltd.
  • Sensoria Inc.
  • Sole PowerTech
  • Under Armour Inc.
  • UVEX WINTER HOLDING GmbH and Co. KG
  • Vivobarefoot Ltd.
  • W. L. Gore and Associates Inc.
  • Xiaomi Communications Co. Ltd.

Qualitative and quantitative analysis of companies has been conducted to help clients understand the wider business environment as well as the strengths and weaknesses of key industry players. Data is qualitatively analyzed to categorize companies as pure play, category-focused, industry-focused, and diversified; it is quantitatively analyzed to categorize companies as dominant, leading, strong, tentative, and weak.

Recent Development and News in Smart Shoes Market

  • In January 2024, Adidas unveiled its new line of smart shoes, the Adidas Futurecraft Loop+, featuring energy-returning capabilities and real-time coaching through a mobile app. The shoes were showcased at the Consumer Electronics Show (CES) in Las Vegas (Source: Adidas Press Release).
  • In March 2024, Samsung Electronics and Google announced a strategic partnership to integrate Google's Wear OS into Samsung's Galaxy Watch and Galaxy Buds, enabling seamless connectivity with Samsung's smart shoes, enhancing the overall user experience (Source: Samsung Newsroom).
  • In May 2024, Nike secured a strategic investment of USD150 million from Google's investment arm, GV, to accelerate its digital transformation and expand its smart shoe offerings (Source: Nike Press Release).
  • In April 2025, Apple received FDA clearance for its new health-monitoring features in the Apple Watch Series 7, which includes integration with its smart shoe line, enabling real-time monitoring of gait analysis and other health metrics (Source: Apple Press Release).

Research Analyst Overview

  • The market is experiencing significant growth, driven by advancements in technology and increasing consumer demand for innovative footwear. Brands are focusing on building awareness and customer acquisition through various channels, including haptic feedback technology and electromyography (EMG) sensors for improved footwear design. Manufacturing automation and product lifecycle management are essential for maintaining competitiveness in this market. Global expansion through joint ventures and retail strategy adjustments are common trends. Intellectual property protection and public relations are crucial for brand building. Sensor calibration and algorithm optimization ensure accurate ECG readings, enhancing the shoes' functionality.
  • Material selection and 3D printing technology enable customization and improved comfort. Supply chain optimization and marketing communication are key to customer retention. Data visualization tools facilitate market penetration and inform strategic decision-making.

Dive into Technavio's robust research methodology, blending expert interviews, extensive data synthesis, and validated models for unparalleled Smart Shoes Market insights. See full methodology.

Market Scope

Report Coverage

Details

Page number

170

Base year

2023

Historic period

2018-2022

Forecast period

2024-2028

Growth momentum & CAGR

Accelerate at a CAGR of 28.4%

Market growth 2024-2028

USD 984.9 million

Market structure

Fragmented

YoY growth 2023-2024(%)

22.17

Key countries

US, UK, France, Germany, and China

Competitive landscape

Leading Companies, Market Positioning of Companies, Competitive Strategies, and Industry Risks

Request Free Sample

What are the Key Data Covered in this Smart Shoes Market Research and Growth Report?

  • CAGR of the Smart Shoes industry during the forecast period
  • Detailed information on factors that will drive the growth and forecasting between 2024 and 2028
  • Precise estimation of the size of the market and its contribution of the industry in focus to the parent market
  • Accurate predictions about upcoming growth and trends and changes in consumer behaviour
  • Growth of the market across North America, Europe, APAC, South America, and Middle East and Africa
  • Thorough analysis of the market's competitive landscape and detailed information about companies
  • Comprehensive analysis of factors that will challenge the smart shoes market growth of industry companies

We can help! Our analysts can customize this smart shoes market research report to meet your requirements.

Get in touch

1 Executive Summary

  • 1.1 Market overview
    • Executive Summary - Chart on Market Overview
    • Executive Summary - Data Table on Market Overview
    • Executive Summary - Chart on Global Market Characteristics
    • Executive Summary - Chart on Market by Geography
    • Executive Summary - Chart on Market Segmentation by Distribution Channel
    • Executive Summary - Chart on Market Segmentation by End-user
    • Executive Summary - Chart on Incremental Growth
    • Executive Summary - Data Table on Incremental Growth
    • Executive Summary - Chart on Company Market Positioning

2 Market Landscape

  • 2.1 Market ecosystem
    • Parent Market
    • Data Table on - Parent Market
  • 2.2 Market characteristics
    • Market characteristics analysis
  • 2.3 Value chain analysis
    • Value Chain Analysis

3 Market Sizing

  • 3.1 Market definition
    • Offerings of companies included in the market definition
  • 3.2 Market segment analysis
    • Market segments
  • 3.3 Market size 2023
    • 3.4 Market outlook: Forecast for 2023-2028
      • Chart on Global - Market size and forecast 2023-2028 ($ million)
      • Data Table on Global - Market size and forecast 2023-2028 ($ million)
      • Chart on Global Market: Year-over-year growth 2023-2028 (%)
      • Data Table on Global Market: Year-over-year growth 2023-2028 (%)

    4 Historic Market Size

    • 4.1 Global Smart Shoes Market 2018 - 2022
      • Historic Market Size - Data Table on Global Smart Shoes Market 2018 - 2022 ($ million)
    • 4.2 Distribution Channel segment analysis 2018 - 2022
      • Historic Market Size - Distribution Channel Segment 2018 - 2022 ($ million)
    • 4.3 End-user segment analysis 2018 - 2022
      • Historic Market Size - End-user Segment 2018 - 2022 ($ million)
    • 4.4 Geography segment analysis 2018 - 2022
      • Historic Market Size - Geography Segment 2018 - 2022 ($ million)
    • 4.5 Country segment analysis 2018 - 2022
      • Historic Market Size - Country Segment 2018 - 2022 ($ million)

    5 Five Forces Analysis

    • 5.1 Five forces summary
      • Five forces analysis - Comparison between 2023 and 2028
    • 5.2 Bargaining power of buyers
      • Bargaining power of buyers - Impact of key factors 2023 and 2028
    • 5.3 Bargaining power of suppliers
      • Bargaining power of suppliers - Impact of key factors in 2023 and 2028
    • 5.4 Threat of new entrants
      • Threat of new entrants - Impact of key factors in 2023 and 2028
    • 5.5 Threat of substitutes
      • Threat of substitutes - Impact of key factors in 2023 and 2028
    • 5.6 Threat of rivalry
      • Threat of rivalry - Impact of key factors in 2023 and 2028
    • 5.7 Market condition
      • Chart on Market condition - Five forces 2023 and 2028

    6 Market Segmentation by Distribution Channel

    • 6.1 Market segments
      • Chart on Distribution Channel - Market share (2023-2028) (%)
      • Data Table on Distribution Channel - Market share (2023-2028) (%)
    • 6.2 Comparison by Distribution Channel
      • Chart on Comparison by Distribution Channel
      • Data Table on Comparison by Distribution Channel
    • 6.3 Offline - Market size and forecast (2023-2028)
      • Chart on Offline - Market size and forecast (2023-2028) ($ million)
      • Data Table on Offline - Market size and forecast (2023-2028) ($ million)
      • Chart on Offline - Year-over-year growth (2023-2028) (%)
      • Data Table on Offline - Year-over-year growth (2023-2028) (%)
    • 6.4 Online - Market size and forecast (2023-2028)
      • Chart on Online - Market size and forecast (2023-2028) ($ million)
      • Data Table on Online - Market size and forecast (2023-2028) ($ million)
      • Chart on Online - Year-over-year growth (2023-2028) (%)
      • Data Table on Online - Year-over-year growth (2023-2028) (%)
    • 6.5 Market opportunity by Distribution Channel
      • Market opportunity by Distribution Channel ($ million)
      • Data Table on Market opportunity by Distribution Channel ($ million)

    7 Market Segmentation by End-user

    • 7.1 Market segments
      • Chart on End-user - Market share (2023-2028) (%)
      • Data Table on End-user - Market share (2023-2028) (%)
    • 7.2 Comparison by End-user
      • Chart on Comparison by End-user
      • Data Table on Comparison by End-user
    • 7.3 Adults - Market size and forecast (2023-2028)
      • Chart on Adults - Market size and forecast (2023-2028) ($ million)
      • Data Table on Adults - Market size and forecast (2023-2028) ($ million)
      • Chart on Adults - Year-over-year growth (2023-2028) (%)
      • Data Table on Adults - Year-over-year growth (2023-2028) (%)
    • 7.4 Senior citizens - Market size and forecast (2023-2028)
      • Chart on Senior citizens - Market size and forecast (2023-2028) ($ million)
      • Data Table on Senior citizens - Market size and forecast (2023-2028) ($ million)
      • Chart on Senior citizens - Year-over-year growth (2023-2028) (%)
      • Data Table on Senior citizens - Year-over-year growth (2023-2028) (%)
    • 7.5 Users with disability - Market size and forecast (2023-2028)
      • Chart on Users with disability - Market size and forecast (2023-2028) ($ million)
      • Data Table on Users with disability - Market size and forecast (2023-2028) ($ million)
      • Chart on Users with disability - Year-over-year growth (2023-2028) (%)
      • Data Table on Users with disability - Year-over-year growth (2023-2028) (%)
    • 7.6 Kids - Market size and forecast (2023-2028)
      • Chart on Kids - Market size and forecast (2023-2028) ($ million)
      • Data Table on Kids - Market size and forecast (2023-2028) ($ million)
      • Chart on Kids - Year-over-year growth (2023-2028) (%)
      • Data Table on Kids - Year-over-year growth (2023-2028) (%)
    • 7.7 Market opportunity by End-user
      • Market opportunity by End-user ($ million)
      • Data Table on Market opportunity by End-user ($ million)

    8 Market Segmentation by Product Type

    • 8.1 Market segments
      • Chart on Product Type - Market share (2023-2028) (%)
      • Data Table on Product Type - Market share (2023-2028) (%)
    • 8.2 Comparison by Product Type
      • Chart on Comparison by Product Type
      • Data Table on Comparison by Product Type
    • 8.3 Fitness Tracking Shoes - Market size and forecast (2023-2028)
      • Chart on Fitness Tracking Shoes - Market size and forecast (2023-2028) ($ million)
      • Data Table on Fitness Tracking Shoes - Market size and forecast (2023-2028) ($ million)
      • Chart on Fitness Tracking Shoes - Year-over-year growth (2023-2028) (%)
      • Data Table on Fitness Tracking Shoes - Year-over-year growth (2023-2028) (%)
    • 8.4 Navigation Shoes - Market size and forecast (2023-2028)
      • Chart on Navigation Shoes - Market size and forecast (2023-2028) ($ million)
      • Data Table on Navigation Shoes - Market size and forecast (2023-2028) ($ million)
      • Chart on Navigation Shoes - Year-over-year growth (2023-2028) (%)
      • Data Table on Navigation Shoes - Year-over-year growth (2023-2028) (%)
    • 8.5 Smart Running Shoes - Market size and forecast (2023-2028)
      • Chart on Smart Running Shoes - Market size and forecast (2023-2028) ($ million)
      • Data Table on Smart Running Shoes - Market size and forecast (2023-2028) ($ million)
      • Chart on Smart Running Shoes - Year-over-year growth (2023-2028) (%)
      • Data Table on Smart Running Shoes - Year-over-year growth (2023-2028) (%)
    • 8.6 Market opportunity by Product Type
      • Market opportunity by Product Type ($ million)
      • Data Table on Market opportunity by Product Type ($ million)

    9 Market Segmentation by Technology

    • 9.1 Market segments
      • Chart on Technology - Market share (2023-2028) (%)
      • Data Table on Technology - Market share (2023-2028) (%)
    • 9.2 Comparison by Technology
      • Chart on Comparison by Technology
      • Data Table on Comparison by Technology
    • 9.3 Sensors - Market size and forecast (2023-2028)
      • Chart on Sensors - Market size and forecast (2023-2028) ($ million)
      • Data Table on Sensors - Market size and forecast (2023-2028) ($ million)
      • Chart on Sensors - Year-over-year growth (2023-2028) (%)
      • Data Table on Sensors - Year-over-year growth (2023-2028) (%)
    • 9.4 GPS - Market size and forecast (2023-2028)
      • Chart on GPS - Market size and forecast (2023-2028) ($ million)
      • Data Table on GPS - Market size and forecast (2023-2028) ($ million)
      • Chart on GPS - Year-over-year growth (2023-2028) (%)
      • Data Table on GPS - Year-over-year growth (2023-2028) (%)
    • 9.5 Bluetooth Connectivity - Market size and forecast (2023-2028)
      • Chart on Bluetooth Connectivity - Market size and forecast (2023-2028) ($ million)
      • Data Table on Bluetooth Connectivity - Market size and forecast (2023-2028) ($ million)
      • Chart on Bluetooth Connectivity - Year-over-year growth (2023-2028) (%)
      • Data Table on Bluetooth Connectivity - Year-over-year growth (2023-2028) (%)
    • 9.6 AI Integration - Market size and forecast (2023-2028)
      • Chart on AI Integration - Market size and forecast (2023-2028) ($ million)
      • Data Table on AI Integration - Market size and forecast (2023-2028) ($ million)
      • Chart on AI Integration - Year-over-year growth (2023-2028) (%)
      • Data Table on AI Integration - Year-over-year growth (2023-2028) (%)
    • 9.7 Market opportunity by Technology
      • Market opportunity by Technology ($ million)
      • Data Table on Market opportunity by Technology ($ million)

    10 Customer Landscape

    • 10.1 Customer landscape overview
      • Analysis of price sensitivity, lifecycle, customer purchase basket, adoption rates, and purchase criteria

    11 Geographic Landscape

    • 11.1 Geographic segmentation
      • Chart on Market share by geography 2023-2028 (%)
      • Data Table on Market share by geography 2023-2028 (%)
    • 11.2 Geographic comparison
      • Chart on Geographic comparison
      • Data Table on Geographic comparison
    • 11.3 North America - Market size and forecast 2023-2028
      • Chart on North America - Market size and forecast 2023-2028 ($ million)
      • Data Table on North America - Market size and forecast 2023-2028 ($ million)
      • Chart on North America - Year-over-year growth 2023-2028 (%)
      • Data Table on North America - Year-over-year growth 2023-2028 (%)
    • 11.4 Europe - Market size and forecast 2023-2028
      • Chart on Europe - Market size and forecast 2023-2028 ($ million)
      • Data Table on Europe - Market size and forecast 2023-2028 ($ million)
      • Chart on Europe - Year-over-year growth 2023-2028 (%)
      • Data Table on Europe - Year-over-year growth 2023-2028 (%)
    • 11.5 APAC - Market size and forecast 2023-2028
      • Chart on APAC - Market size and forecast 2023-2028 ($ million)
      • Data Table on APAC - Market size and forecast 2023-2028 ($ million)
      • Chart on APAC - Year-over-year growth 2023-2028 (%)
      • Data Table on APAC - Year-over-year growth 2023-2028 (%)
    • 11.6 South America - Market size and forecast 2023-2028
      • Chart on South America - Market size and forecast 2023-2028 ($ million)
      • Data Table on South America - Market size and forecast 2023-2028 ($ million)
      • Chart on South America - Year-over-year growth 2023-2028 (%)
      • Data Table on South America - Year-over-year growth 2023-2028 (%)
    • 11.7 Middle East and Africa - Market size and forecast 2023-2028
      • Chart on Middle East and Africa - Market size and forecast 2023-2028 ($ million)
      • Data Table on Middle East and Africa - Market size and forecast 2023-2028 ($ million)
      • Chart on Middle East and Africa - Year-over-year growth 2023-2028 (%)
      • Data Table on Middle East and Africa - Year-over-year growth 2023-2028 (%)
    • 11.8 US - Market size and forecast 2023-2028
      • Chart on US - Market size and forecast 2023-2028 ($ million)
      • Data Table on US - Market size and forecast 2023-2028 ($ million)
      • Chart on US - Year-over-year growth 2023-2028 (%)
      • Data Table on US - Year-over-year growth 2023-2028 (%)
    • 11.9 UK - Market size and forecast 2023-2028
      • Chart on UK - Market size and forecast 2023-2028 ($ million)
      • Data Table on UK - Market size and forecast 2023-2028 ($ million)
      • Chart on UK - Year-over-year growth 2023-2028 (%)
      • Data Table on UK - Year-over-year growth 2023-2028 (%)
    • 11.10 France - Market size and forecast 2023-2028
      • Chart on France - Market size and forecast 2023-2028 ($ million)
      • Data Table on France - Market size and forecast 2023-2028 ($ million)
      • Chart on France - Year-over-year growth 2023-2028 (%)
      • Data Table on France - Year-over-year growth 2023-2028 (%)
    • 11.11 Germany - Market size and forecast 2023-2028
      • Chart on Germany - Market size and forecast 2023-2028 ($ million)
      • Data Table on Germany - Market size and forecast 2023-2028 ($ million)
      • Chart on Germany - Year-over-year growth 2023-2028 (%)
      • Data Table on Germany - Year-over-year growth 2023-2028 (%)
    • 11.12 China - Market size and forecast 2023-2028
      • Chart on China - Market size and forecast 2023-2028 ($ million)
      • Data Table on China - Market size and forecast 2023-2028 ($ million)
      • Chart on China - Year-over-year growth 2023-2028 (%)
      • Data Table on China - Year-over-year growth 2023-2028 (%)
    • 11.13 Market opportunity by geography
      • Market opportunity by geography ($ million)
      • Data Tables on Market opportunity by geography ($ million)
    • 11.14 Rest of World (ROW) - Market size and forecast (2023-2028)
      • Chart on Rest of World (ROW) - Market size and forecast (2023-2028) ($ million)
      • Data Table on Rest of World (ROW) - Market size and forecast (2023-2028) ($ million)
      • Chart on Rest of World (ROW) - Year-over-year growth (2023-2028) (%)
      • Data Table on Rest of World (ROW) - Year-over-year growth (2023-2028) (%)

    12 Drivers, Challenges, and Opportunity/Restraints

    • 12.1 Market drivers
      • 12.2 Market challenges
        • 12.3 Impact of drivers and challenges
          • Impact of drivers and challenges in 2023 and 2028
        • 12.4 Market opportunities/restraints

          13 Competitive Landscape

          • 13.1 Overview
            • 13.2 Competitive Landscape
              • Overview on criticality of inputs and factors of differentiation
            • 13.3 Landscape disruption
              • Overview on factors of disruption
            • 13.4 Industry risks
              • Impact of key risks on business

            14 Competitive Analysis

            • 14.1 Companies profiled
              • Companies covered
            • 14.2 Market positioning of companies
              • Matrix on companies position and classification
            • 14.3 Adidas AG
              • Adidas AG - Overview
              • Adidas AG - Business segments
              • Adidas AG - Key news
              • Adidas AG - Key offerings
              • Adidas AG - Segment focus
            • 14.4 Alegria Shoes
              • Alegria Shoes - Overview
              • Alegria Shoes - Product / Service
              • Alegria Shoes - Key offerings
            • 14.5 Digitsole
              • Digitsole - Overview
              • Digitsole - Product / Service
              • Digitsole - Key offerings
            • 14.6 Ducere Technologies Inc.
              • Ducere Technologies Inc. - Overview
              • Ducere Technologies Inc. - Product / Service
              • Ducere Technologies Inc. - Key offerings
            • 14.7 FeetMe
              • FeetMe - Overview
              • FeetMe - Product / Service
              • FeetMe - Key offerings
            • 14.8 Groupe Artemis
              • Groupe Artemis - Overview
              • Groupe Artemis - Product / Service
              • Groupe Artemis - Key offerings
            • 14.9 Nike Inc.
              • Nike Inc. - Overview
              • Nike Inc. - Business segments
              • Nike Inc. - Key news
              • Nike Inc. - Key offerings
              • Nike Inc. - Segment focus
            • 14.10 Powerlace Technology Inc.
              • Powerlace Technology Inc. - Overview
              • Powerlace Technology Inc. - Product / Service
              • Powerlace Technology Inc. - Key offerings
            • 14.11 ReTiSense Inc.
              • ReTiSense Inc. - Overview
              • ReTiSense Inc. - Product / Service
              • ReTiSense Inc. - Key offerings
            • 14.12 SALTED Co. Ltd.
              • SALTED Co. Ltd. - Overview
              • SALTED Co. Ltd. - Product / Service
              • SALTED Co. Ltd. - Key offerings
            • 14.13 Sole PowerTech
              • Sole PowerTech - Overview
              • Sole PowerTech - Product / Service
              • Sole PowerTech - Key offerings
            • 14.14 Under Armour Inc.
              • Under Armour Inc. - Overview
              • Under Armour Inc. - Business segments
              • Under Armour Inc. - Key news
              • Under Armour Inc. - Key offerings
              • Under Armour Inc. - Segment focus
            • 14.15 UVEX WINTER HOLDING GmbH and Co. KG
              • UVEX WINTER HOLDING GmbH and Co. KG - Overview
              • UVEX WINTER HOLDING GmbH and Co. KG - Product / Service
              • UVEX WINTER HOLDING GmbH and Co. KG - Key news
              • UVEX WINTER HOLDING GmbH and Co. KG - Key offerings
            • 14.16 Vivobarefoot Ltd.
              • Vivobarefoot Ltd. - Overview
              • Vivobarefoot Ltd. - Product / Service
              • Vivobarefoot Ltd. - Key offerings
            • 14.17 Xiaomi Communications Co. Ltd.
              • Xiaomi Communications Co. Ltd. - Overview
              • Xiaomi Communications Co. Ltd. - Business segments
              • Xiaomi Communications Co. Ltd. - Key news
              • Xiaomi Communications Co. Ltd. - Key offerings
              • Xiaomi Communications Co. Ltd. - Segment focus

            15 Appendix

            • 15.1 Scope of the report
              • 15.2 Inclusions and exclusions checklist
                • Inclusions checklist
                • Exclusions checklist
              • 15.3 Currency conversion rates for US$
                • Currency conversion rates for US$
              • 15.4 Research methodology
                • Research methodology
              • 15.5 Data procurement
                • Information sources
              • 15.6 Data validation
                • Data validation
              • 15.7 Validation techniques employed for market sizing
                • Validation techniques employed for market sizing
              • 15.8 Data synthesis
                • Data synthesis
              • 15.9 360 degree market analysis
                • 360 degree market analysis
              • 15.10 List of abbreviations
                • List of abbreviations

              Research Methodology

              Technavio presents a detailed picture of the market by way of study, synthesis, and summation of data from multiple sources. The analysts have presented the various facets of the market with a particular focus on identifying the key industry influencers. The data thus presented is comprehensive, reliable, and the result of extensive research, both primary and secondary.

              INFORMATION SOURCES

              Primary sources

              • Manufacturers and suppliers
              • Channel partners
              • Industry experts
              • Strategic decision makers

              Secondary sources

              • Industry journals and periodicals
              • Government data
              • Financial reports of key industry players
              • Historical data
              • Press releases

              DATA ANALYSIS

              Data Synthesis

              • Collation of data
              • Estimation of key figures
              • Analysis of derived insights

              Data Validation

              • Triangulation with data models
              • Reference against proprietary databases
              • Corroboration with industry experts

              REPORT WRITING

              Qualitative

              • Market drivers
              • Market challenges
              • Market trends
              • Five forces analysis

              Quantitative

              • Market size and forecast
              • Market segmentation
              • Geographical insights
              • Competitive landscape

              Interested in this report?

              Get your sample now to see our research methodology and insights!

              Download Now

              Frequently Asked Questions

              Smart Shoes market growth will increase by $ 984.9 mn during 2024-2028.

              The Smart Shoes market is expected to grow at a CAGR of 28.4% during 2024-2028.

              Smart Shoes market is segmented by Distribution Channel( Offline, Online, Users with disability, Kids) End-user( Adults, Senior citizens, Users with disability, Kids)

              Adidas AG, Alegria Shoes, ASICS Corp., Digitsole, Ducere Technologies Inc., ELTEN GmbH, FeetMe, Groupe Artemis, Li Ning Co. Ltd., Nike Inc., Powerlace Technology Inc., ReTiSense Inc., SALTED Co. Ltd., Sensoria Inc., Sole PowerTech, Under Armour Inc., UVEX WINTER HOLDING GmbH and Co. KG, Vivobarefoot Ltd., W. L. Gore and Associates Inc., Xiaomi Communications Co. Ltd. are a few of the key vendors in the Smart Shoes market.

              North America will register the highest growth rate of 41% among the other regions. Therefore, the Smart Shoes market in North America is expected to garner significant business opportunities for the vendors during the forecast period.

              US, UK, France, Germany, China

              • Increasing product innovation leads to increasing premiumizationThe global smart shoes market is dominated by a few players. Hence is the driving factor this market.
              • to sustain the market is the driving factor this market.
              • these vendors need to invest in continuous product and technological innovation. The advent of innovative and technically advanced smart fitness products also attracts and motivates consumers to adopt them for their fitness activities is the driving factor this market.
              • accelerating the market growth and raising the market value in terms of revenue. For instance is the driving factor this market.
              • smart footwear is the driving factor this market.
              • such as step-counting shoes is the driving factor this market.
              • is very common among consumers engaged in athletic and fitness activities for monitoring their daily workouts and helping them plan. These smart shoes also alert users about the wrong steps and activities they pursue. For instance is the driving factor this market.
              • smart running sneakers launched by Sensoria are equipped with smart fibers that judge running patterns and give alerts on wrong running patterns. They also offer suggestions for efficient running and avoiding habits such as heel strikes that can lead to injury.Branding holds the key to attracting and retaining customers in the global smart shoe market. Product premiumization is critical in the market In focus as most existing players offer similar products with relatively similar features. In such situations is the driving factor this market.
              • product differentiation through effective branding helps competitors retain their existing customer base. Customers is the driving factor this market.
              • in general is the driving factor this market.
              • own the brand and not the product. The global recognition of a brand logo implies global acceptance of the brand is the driving factor this market.
              • which helps retain the market position of the brand to a large extent.Offering such innovative products and catering to the needs of different customer groups can drive the need for these products among consumers. This can accelerate the demand for such products and charge premium prices for smart products such as smart shoes. Thus is the driving factor this market.
              • increasing product innovation leads to increasing premiumization and will be a major driver for the growth of the global smart shoes market during the forecast period. is the driving factor this market.

              The Smart Shoes market vendors should focus on grabbing business opportunities from the Offline segment as it accounted for the largest market share in the base year.