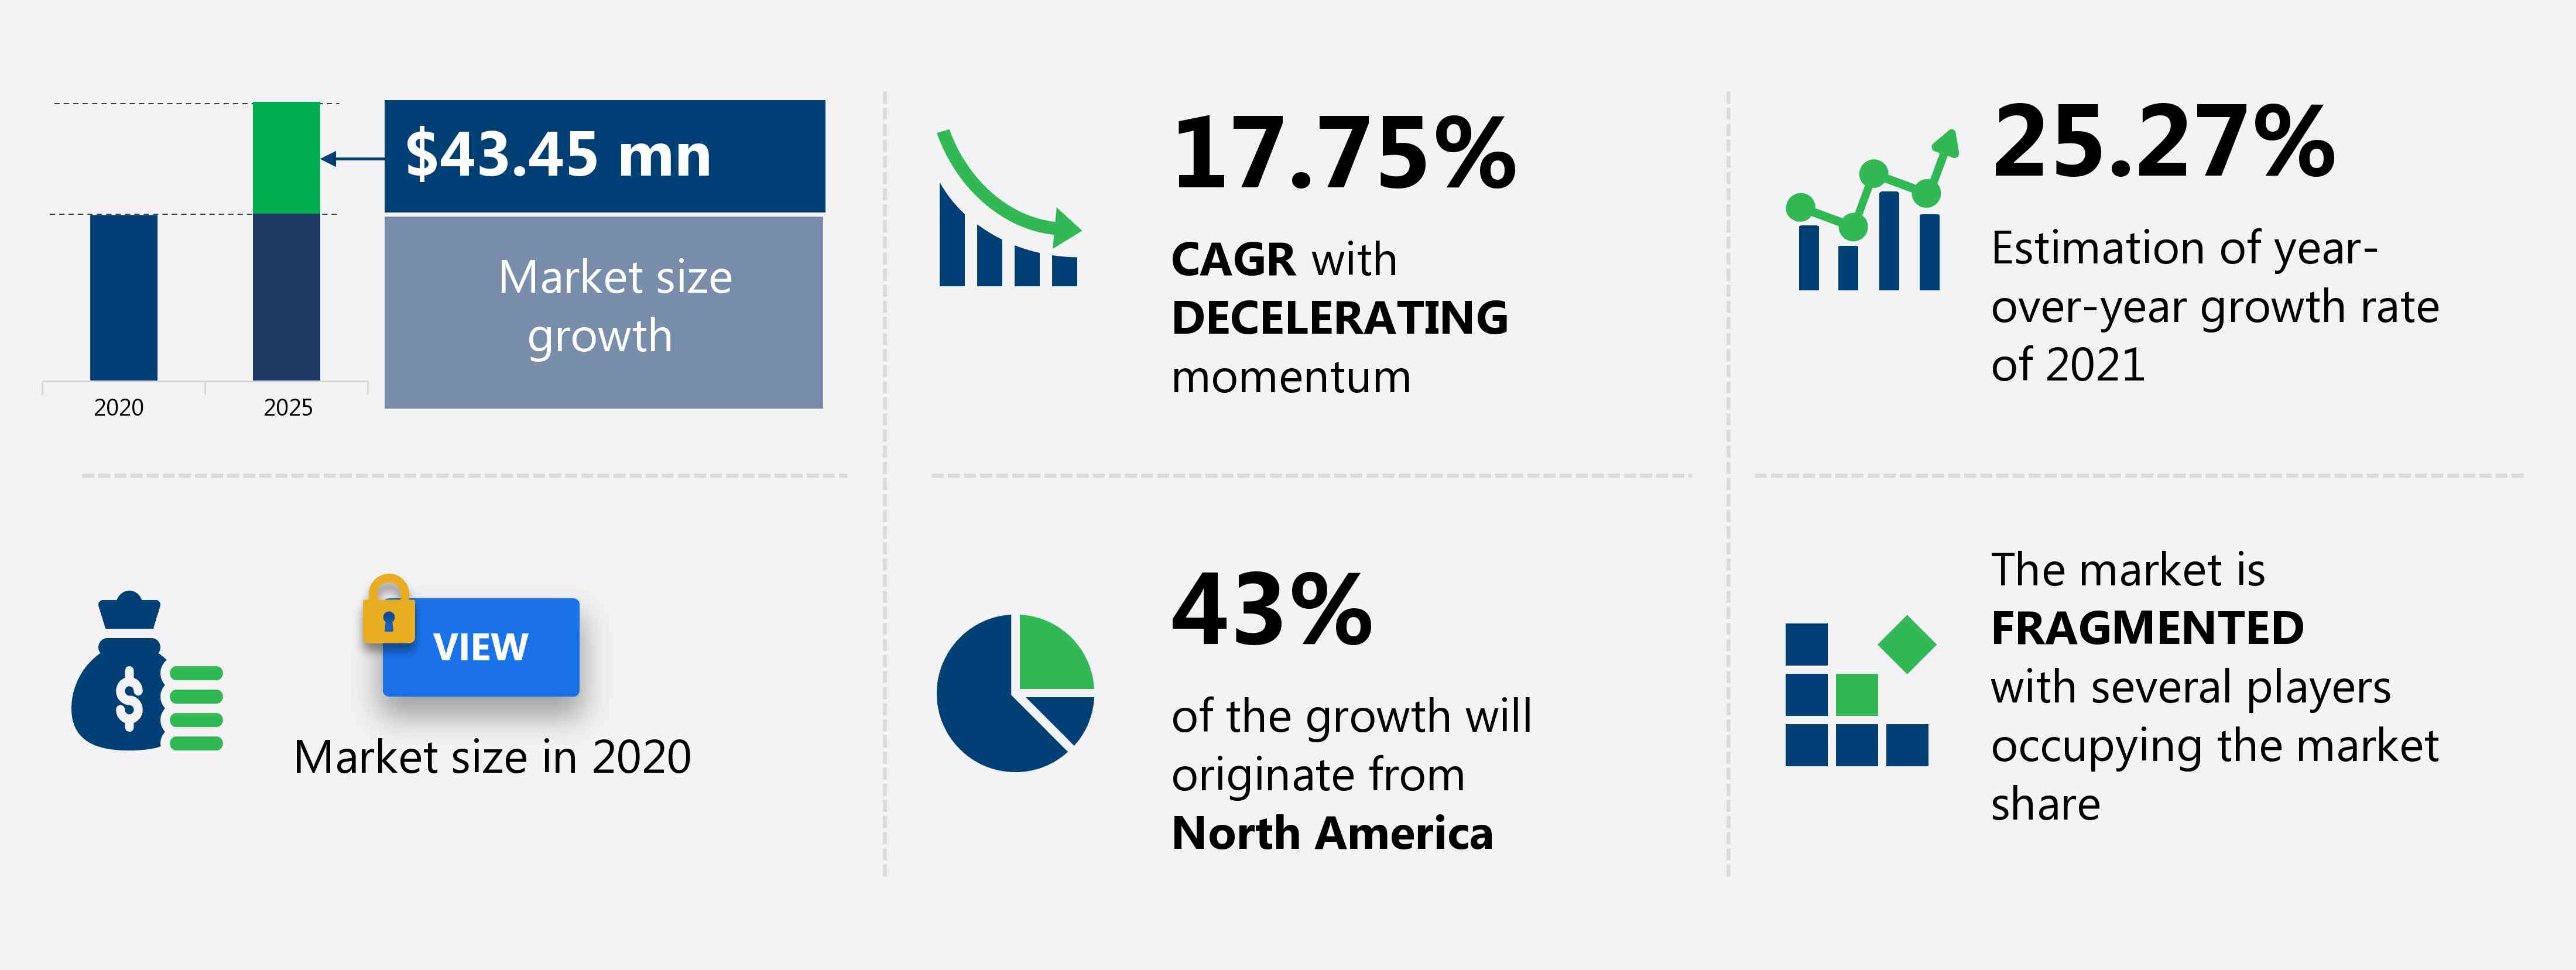
The smart soil moisture sensor market share is expected to increase by USD 43.45 million from 2020 to 2025, at a CAGR of 17.75%.
This market research report extensively covers market segmentation by product (gypsum blocks, GMS, tensiometer, and others), distribution channel (offline and online), application (agriculture, landscaping, sports turfs, and others), and geography (North America, Europe, APAC, South America, and MEA). The market report also offers information on several market vendors, including Campbell Scientific Inc., Davis Instruments Corp., Element Materials Technology Group Ltd., Felwood Holding Co., Husqvarna AB, Imagintronix Ltd., Irrometer Co. Inc., RIQ Intelligent Tools Sarl, The Scotts Co. LLC, and The Toro Co. among others.
What will the Smart Soil Moisture Sensor Market Size be During the Forecast Period?
Download the Free Report Sample to Unlock the Market Size for the Forecast Period and Other Important Statistics
Smart Soil Moisture Sensor Market: Key Drivers, Trends, and Challenges
The growing need for improving farm productivity to feed the rising population is notably driving the market growth, although factors such as high initial investment in smart soil moisture sensor technology may impede the market growth. Our research analysts have studied the historical data and deduced the key market drivers and the COVID-19 pandemic impact on the smart soil moisture sensor industry. The holistic analysis of the drivers will help in deducing end goals and refining marketing strategies to gain a competitive edge.
Key Smart Soil Moisture Sensor Market Driver
One of the key factors driving the global market growth is the growing need for improving farm productivity to feed the rising population. Soil monitoring has grown increasingly vital as the world's population grows, potentially resulting in food shortages. To address the danger of food security for future generations, the farming sector is under enormous pressure to increase agricultural productivity in a variety of ways. Technology has a significant role in increasing crop yield per acre in this area. Good irrigation or water management practices, such as using soil moisture sensors to monitor the water level in the soil, can assist in increasing yields and improving crop quality. These sensors make farming more profitable by assisting in water and energy conservation as well as significant cost savings, which will support the growth of the market in focus during the forecast period.
Key Smart Soil Moisture Sensor Market Trend
Another key factor driving the global market growth is the big data in smart soil moisture sensors, which is giving rise to a lot of opportunities in the agriculture industry. Improvement in wireless communication in the agricultural field is leading to growth in production levels. In addition, improvements in functional safety and repair and maintenance of equipment in the field are giving rise to a crop production level that will accelerate the rate of adoption of big data in smart soil moisture sensors. With the use of GPS trackers and 3D sensors; granular data points on soil conditions; and detailed information on wind, fertilizer requirement, water availability, and pesticide requirements can be conveyed to farmers. The assistance of big data in data acquisition and storage will promote decision-making and other practices used by farmers, which will positively impact the market growth during the forecast period.
Key Smart Soil Moisture Sensor Market Challenge
One of the key challenges to global market growth is the high initial investment in smart soil moisture sensor technology. The adoption of smart soil moisture sensor technology depends on the land area. For instance, farmers that have a small land area find it difficult to match the level of investment with the crop production level in their fields. For larger farms, although investments are not a major concern, the integration cost of hardware and software solutions with the entire farm area remains a major challenge. If the farmers have low technical skills, the immediate benefits of advanced technology cannot be achieved, which acts as a major challenge for end-users of smart soil moisture sensors. Such factors are expected to hamper the adoption of data analytics tools and sensors, which is expected to negatively impact the growth of the market in focus during the forecast period.
This market analysis report also provides detailed information on other upcoming trends and challenges that will have a far-reaching effect on the market growth. The actionable insights on the trends and challenges will help companies evaluate and develop growth strategies for 2021-2025.
Parent Market Analysis
Technavio categorizes the global smart soil moisture sensor market as a part of the global electronic equipment and instruments market. Our research report has extensively covered external factors influencing the parent market growth potential in the coming years, which will determine the levels of growth of the market during the forecast period.
Who are the Major Smart Soil Moisture Sensor Market Vendors?
The report analyzes the market’s competitive landscape and offers information on several market vendors, including:
- Campbell Scientific Inc.
- Davis Instruments Corp.
- Element Materials Technology Group Ltd.
- Felwood Holding Co.
- Husqvarna AB
- Imagintronix Ltd.
- Irrometer Co. Inc.
- RIQ Intelligent Tools Sarl
- The Scotts Co. LLC
- The Toro Co.
This statistical study of the market encompasses successful business strategies deployed by the key vendors. The market is fragmented and the vendors are deploying growth strategies such as business expansion to different emerging markets to compete in the market.
Product Insights and News
-
Husqvarna AB - The company offers smart soil moisture sensor products such as Soil Scout.
To make the most of the opportunities and recover from post COVID-19 impact, market vendors should focus more on the growth prospects in the fast-growing segments, while maintaining their positions in the slow-growing segments.
The market forecast report offers in-depth insights into key vendor profiles. The profiles include information on the production, sustainability, and prospects of the leading companies.
Smart Soil Moisture Sensor Market Value Chain Analysis
Our report provides extensive information on the value chain analysis for the market, which vendors can leverage to gain a competitive advantage during the forecast period. The end-to-end understanding of the value chains is essential in profit margin optimization and evaluation of business strategies. The data available in our value chain analysis segment can help vendors drive costs and enhance customer services during the forecast period.
The value chain of the global electronic equipment and instruments market includes the following core components:
- Inputs
- Inbound logistics
- Operations
- Outbound logistics
- Marketing and sales
- Aftersale service
- Support activities
- Innovation
The report has further elucidated on other innovative approaches being followed by manufacturers to ensure a sustainable market presence.
Which are the Key Regions for Smart Soil Moisture Sensor Market?
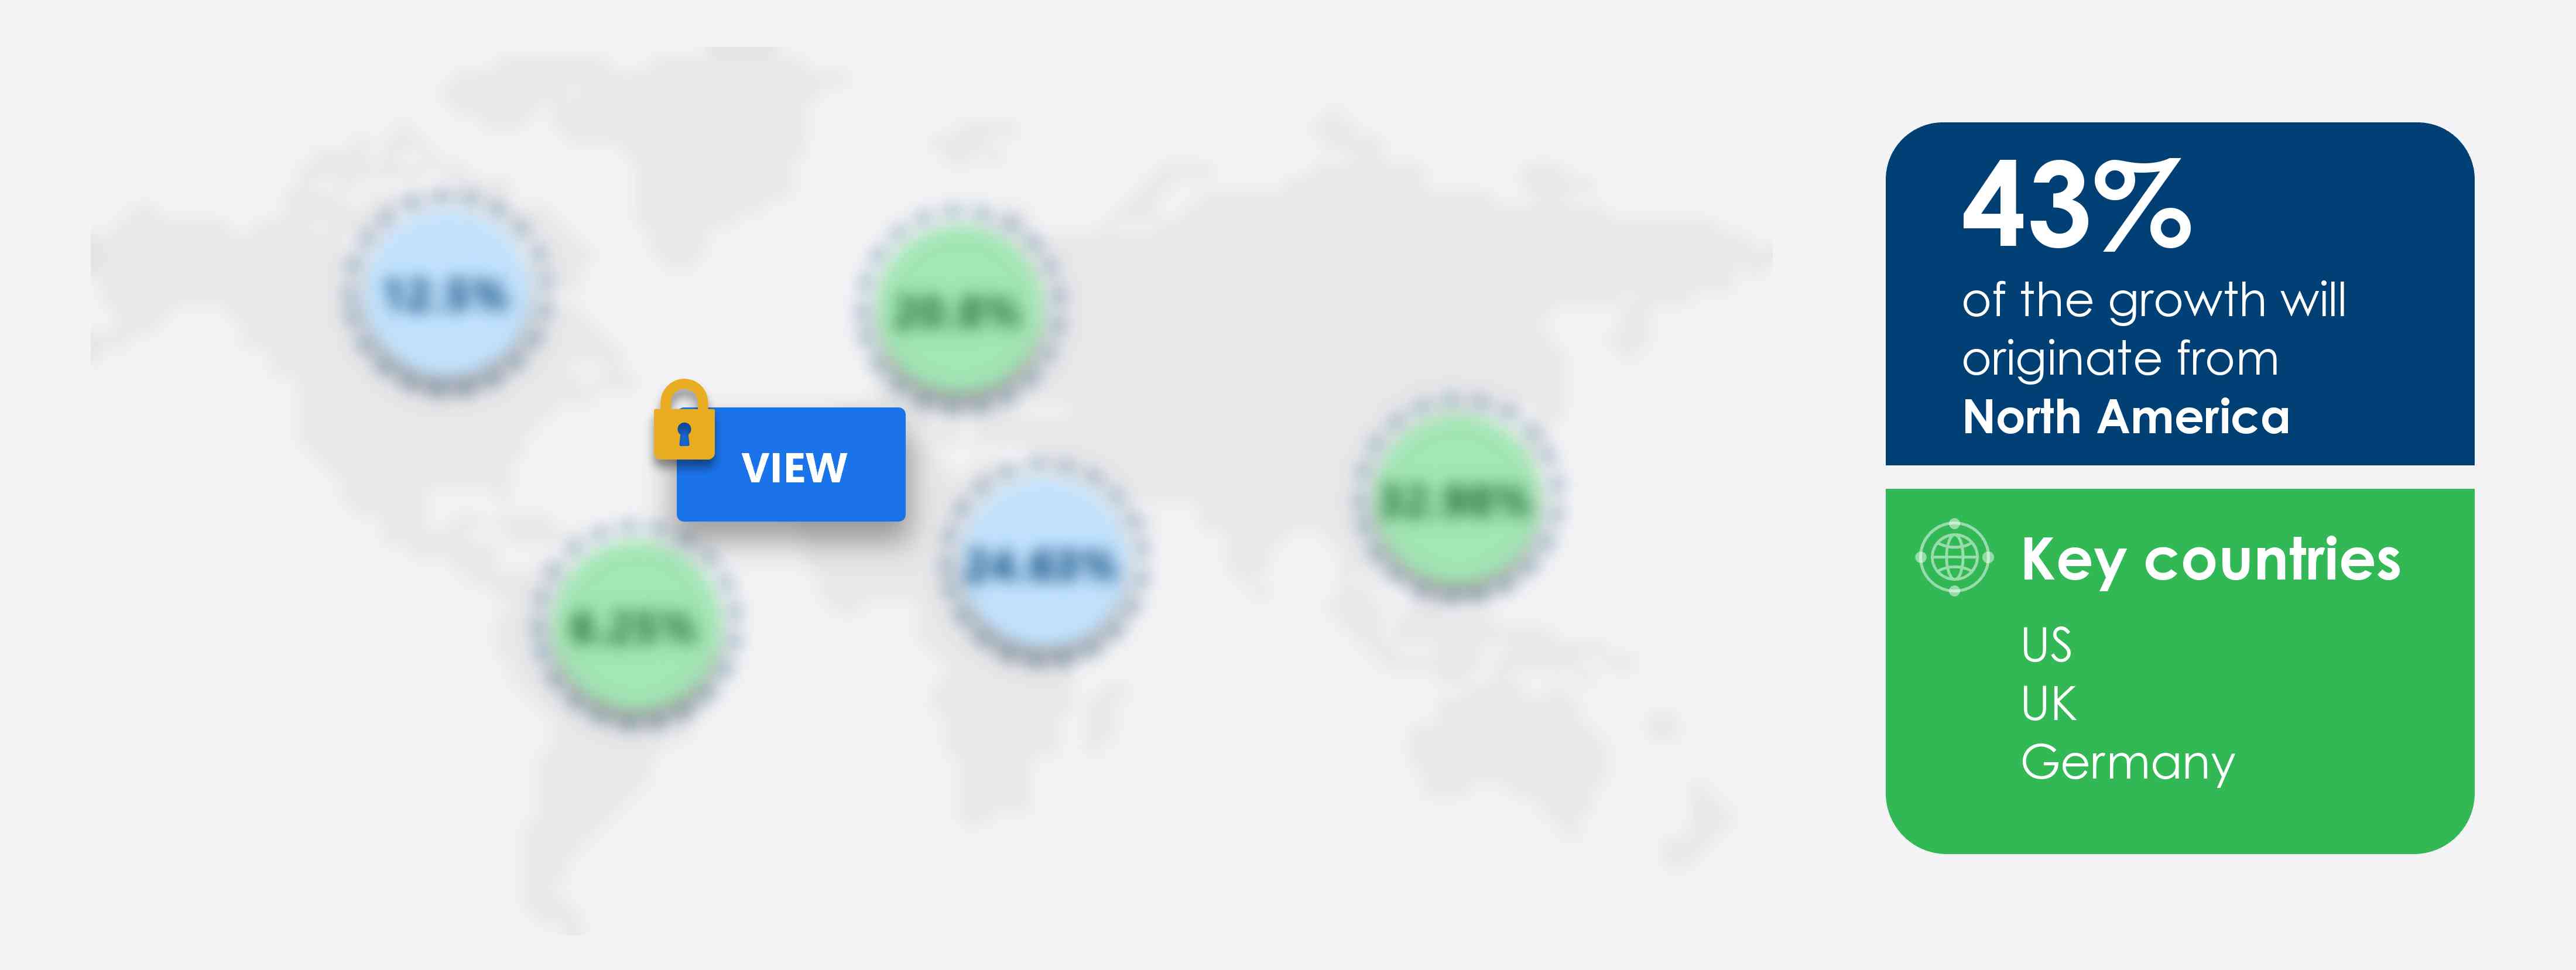
For more insights on the market share of various regions Request for a FREE sample now!
43% of the market’s growth will originate from North America during the forecast period. The US is the key market for smart soil moisture sensors in North America. However, market growth in this region will be slower than the growth of the market in Europe, APAC, and MEA.
The rapid adoption of smart farming tools and techniques to gain productivity and growth rate will facilitate the market growth in North America over the forecast period. This market research report entails detailed information on the competitive intelligence, marketing gaps, and regional opportunities in store for vendors, which will assist in creating efficient business plans.
COVID Impact and Recovery Analysis
However, the supply chain for smart agriculture solutions was negatively impacted due to the outbreak of COVID-19. However, with the lifting of lockdown restrictions in H1 2021, various governments have been investing and offering subsidies and loans to farmers to mitigate the after-effects of the pandemic. Factors such as government investment to revive the sector is expected to stimulate the recovery of the market in focus during the forecast period.
What are the Revenue-generating Product Segments in the Smart Soil Moisture Sensor Market?
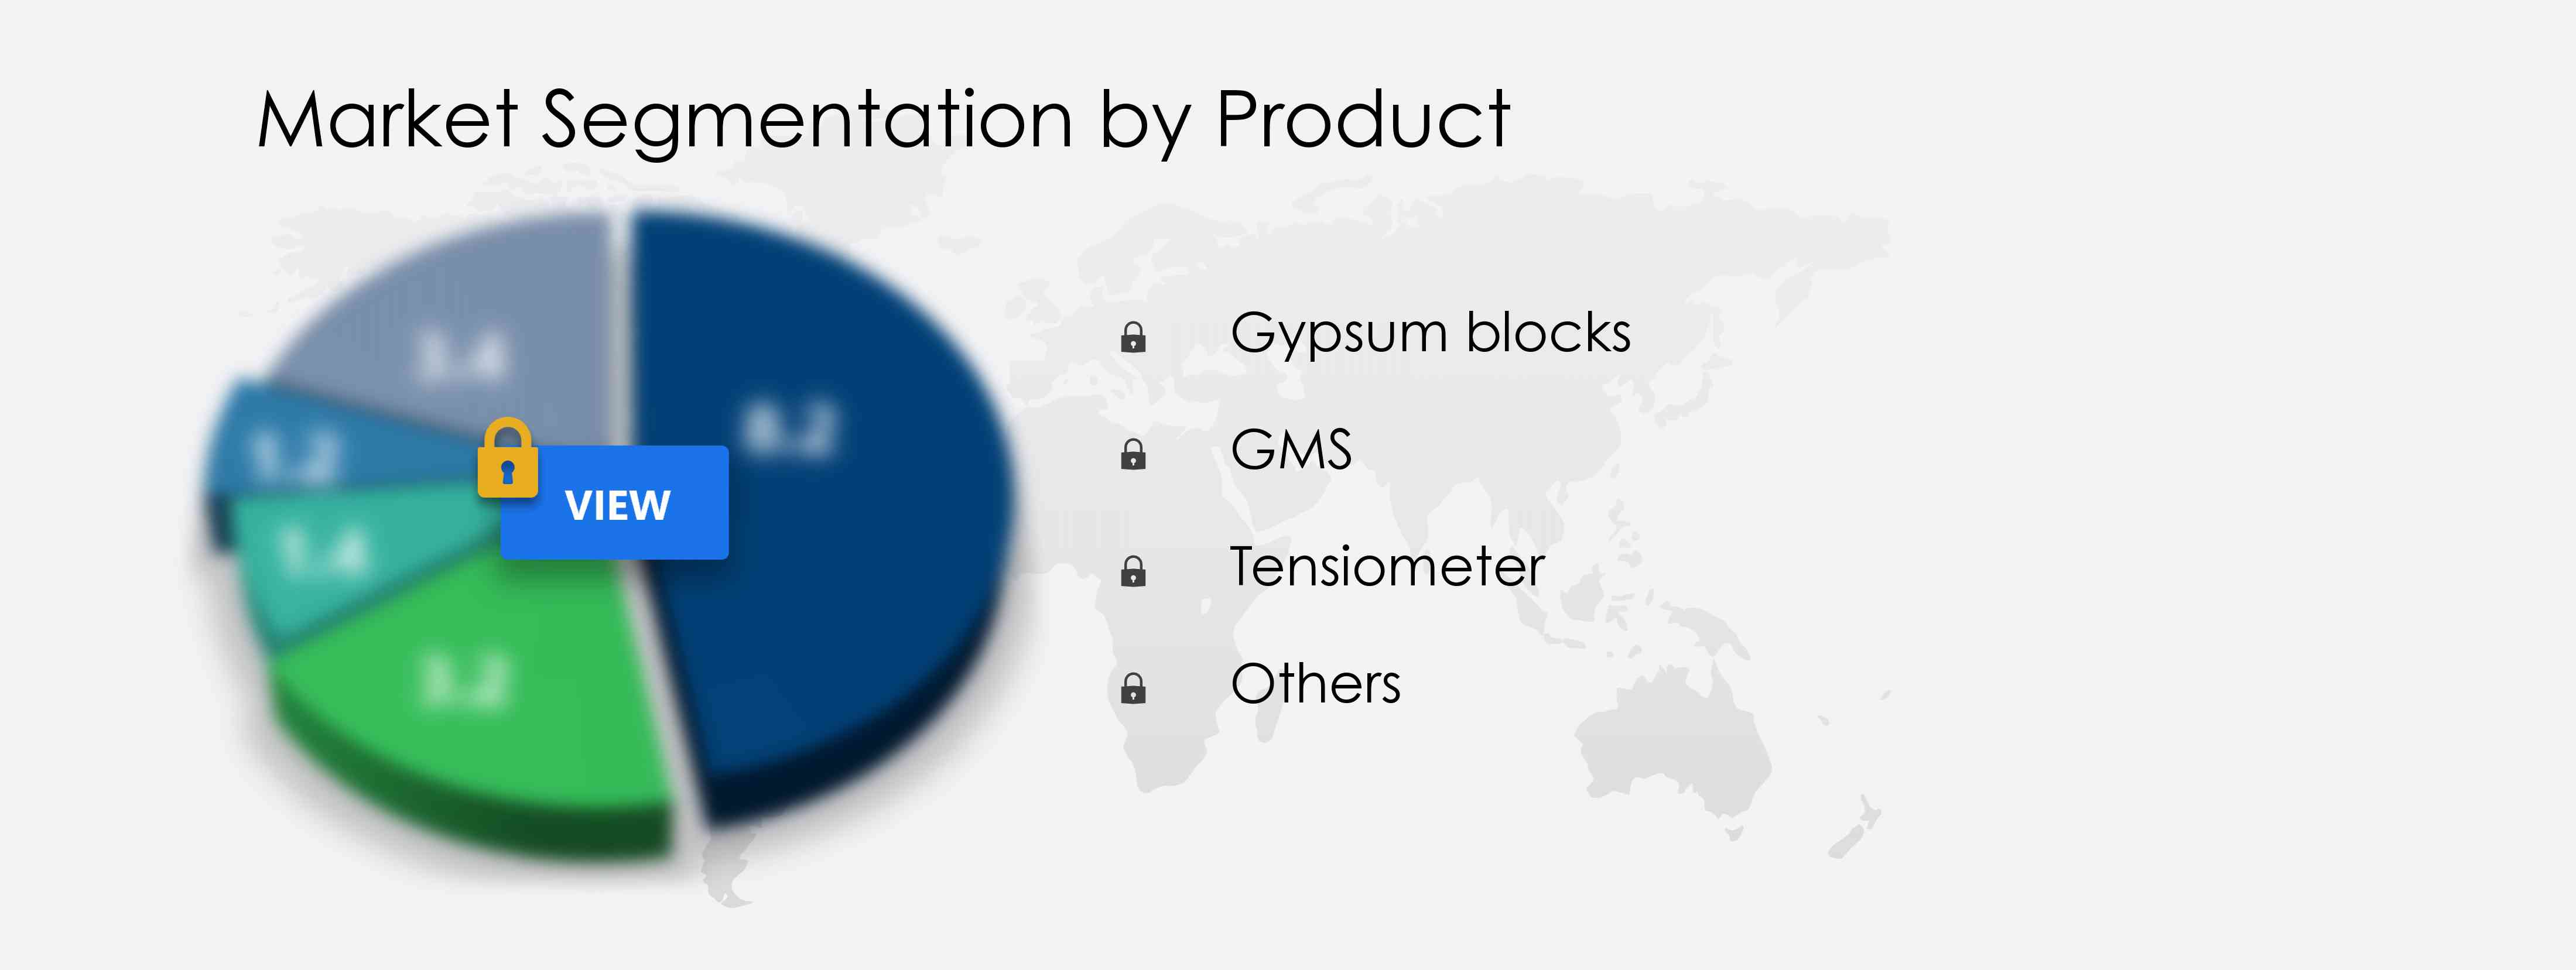
To gain further insights on the market contribution of various segments Request for a FREE sample
The market share growth by the gypsum blocks segment will be significant during the forecast period. The growth is attributed to the multiple benefits of gypsum blocks over other product types such as affordability, easy installation, and availability.
This report provides an accurate prediction of the contribution of all the segments to the growth of the market size and actionable market insights on post COVID-19 impact on each segment.
|
Smart Soil Moisture Sensor Market Scope |
|
|
Report Coverage |
Details |
|
Page number |
120 |
|
Base year |
2020 |
|
Forecast period |
2021-2025 |
|
Growth momentum & CAGR |
Decelerate at a CAGR of 17.75% |
|
Market growth 2021-2025 |
$ 43.45 million |
|
Market structure |
Fragmented |
|
YoY growth (%) |
25.27 |
|
Regional analysis |
North America, Europe, APAC, South America, and MEA |
|
Performing market contribution |
North America at 43% |
|
Key consumer countries |
US, UK, Germany, China, and Brazil |
|
Competitive landscape |
Leading companies, Competitive strategies, Consumer engagement scope |
|
Key companies profiled |
Campbell Scientific Inc., Davis Instruments Corp., Element Materials Technology Group Ltd., Felwood Holding Co., Husqvarna AB, Imagintronix Ltd., Irrometer Co. Inc., RIQ Intelligent Tools Sarl, The Scotts Co. LLC, and The Toro Co. |
|
Market dynamics |
Parent market analysis, Market growth inducers and obstacles, Fast-growing and slow-growing segment analysis, COVID-19 impact and recovery analysis and future consumer dynamics, Market condition analysis for the forecast period |
|
Customization purview |
If our report has not included the data that you are looking for, you can reach out to our analysts and get segments customized. |
What are the Key Data Covered in this Smart Soil Moisture Sensor Market Report?
- CAGR of the market during the forecast period 2021-2025
- Detailed information on factors that will drive market growth during the next five years
- Precise estimation of the market size and its contribution to the parent market
- Accurate predictions on upcoming trends and changes in consumer behaviour
- The growth of the smart soil moisture sensor industry across North America, Europe, APAC, South America, and MEA
- A thorough analysis of the market’s competitive landscape and detailed information on vendors
- Comprehensive details of factors that will challenge the growth of market vendors
We can help! Our analysts can customize this report to meet your requirements. Get in touch
 RIA -
RIA - 
