Smart Sports Equipment Market Analysis North America, APAC, Europe, South America, Middle East and Africa - US, China, Japan, Germany, UK - Size and Forecast 2024-2028

Smart Sports Equipment Market Analysis North America, APAC, Europe, South America, Middle East and Africa - US, China, Japan, Germany, UK - Size and Forecast 2024-2028

Published: Aug 2024 168 Pages SKU: IRTNTR71731

Market Overview at a Glance

$41.15 B
Market Opportunity
32.14%
CAGR
24.42
YoY growth 2023-2024(%)

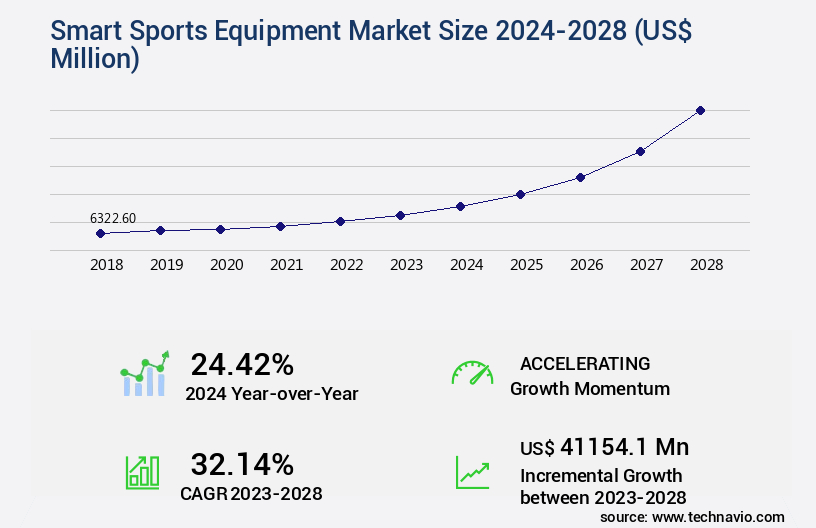
Smart Sports Equipment Market Size 2024-2028

The smart sports equipment market size is valued to increase USD 41.15 billion, at a CAGR of 32.14% from 2023 to 2028. Increased emphasis on IoT will drive the smart sports equipment market.

Major Market Trends & Insights

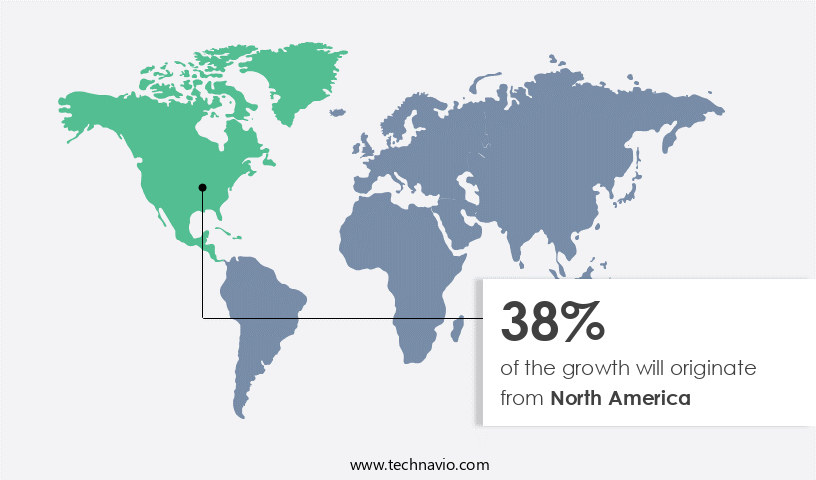
  • North America dominated the market and accounted for a 38% growth during the forecast period.
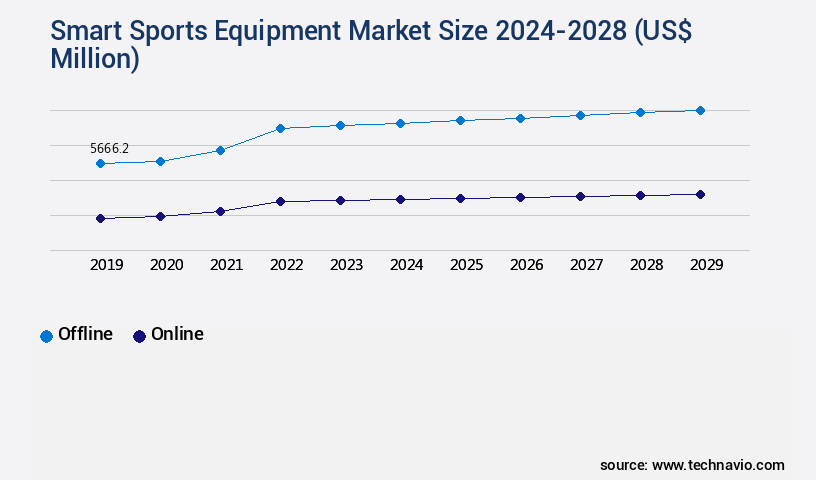
  • By Distribution Channel - Offline segment was valued at USD 4.64 billion in 2022
  • By Product - Ball sports segment accounted for the largest market revenue share in 2022

Market Size & Forecast

  • Market Opportunities: USD 765.78 million
  • Market Future Opportunities: USD 41154.10 million
  • CAGR : 32.14%
  • North America: Largest market in 2022

Market Summary

  • The market represents a dynamic and innovative industry, driven by advancements in core technologies such as IoT, sensors, and data analytics. These technologies enable real-time performance tracking, personalized training programs, and enhanced safety features, transforming the way athletes train and compete. Applications span various sports, from professional athletics to fitness enthusiasts, with smart equipment witnessing increasing adoption in areas like wearable devices, smart balls, and connected training gear. The market's growth is fueled by the premium pricing of these advanced solutions, as well as the growing number of partnerships and collaborations between sports brands, tech companies, and industry stakeholders.
  • For instance, according to a recent report, the global wearable technology market in sports is projected to reach a 20% compound annual growth rate (CAGR) by 2025. Despite these opportunities, challenges such as data privacy concerns, high upfront costs, and compatibility issues persist. Nonetheless, the potential benefits of smart sports equipment, including improved performance, injury prevention, and personalized training, make it a promising market for continued growth.

What will be the Size of the Smart Sports Equipment Market during the forecast period?

Smart Sports Equipment Market Size

Get Key Insights on Market Forecast (PDF) Request Free Sample

How is the Smart Sports Equipment Market Segmented and what are the key trends of market segmentation?

The smart sports equipment industry research report provides comprehensive data (region-wise segment analysis), with forecasts and estimates in "USD million" for the period 2024-2028, as well as historical data from 2018-2022 for the following segments.

  • Distribution Channel
    • Offline
    • Online
  • Product
    • Ball sports
    • Fitness sports
    • Other sports
  • Geography
    • North America
      • US
    • Europe
      • Germany
      • UK
    • APAC
      • China
      • Japan
    • Rest of World (ROW)

By Distribution Channel Insights

The offline segment is estimated to witness significant growth during the forecast period.

In the dynamic and innovative realm of sports equipment, the global market for smart sports equipment is experiencing significant growth. Currently, approximately 15% of sports equipment sales stem from smart devices, with this figure projected to increase to 22% within the next five years. Gamified fitness apps, recovery monitoring systems, and biometric data analysis are among the popular trends driving this expansion. Material science advancements, such as force plate technology and smart clothing, are revolutionizing athletic performance enhancement. Data analytics platforms and virtual reality training enable personalized training plans, optimizing workouts for individual athletes. Injury prevention systems, posture correction systems, and motion capture technology are other essential components, ensuring safety and improving overall performance.

The sports performance metrics market, including heart rate monitors, GPS tracking devices, and calorie expenditure calculation, is a significant contributor to the industry's growth. Augmented reality coaching, remote fitness monitoring, and virtual coaching platforms provide real-time feedback and analysis, enhancing the user experience. Sensor technology, sleep cycle analysis, and energy expenditure analysis are also integral parts of the smart sports equipment landscape. Sports equipment design continues to evolve, integrating muscle activity monitoring, impact force measurement, and 3D motion analysis. Strength and conditioning programs are optimized through wearable sensors and personalized training plans, ensuring athletes reach their peak performance.

The future of smart sports equipment is bright, with continuous advancements and applications across various sectors.

Smart Sports Equipment Market Size

Request Free Sample

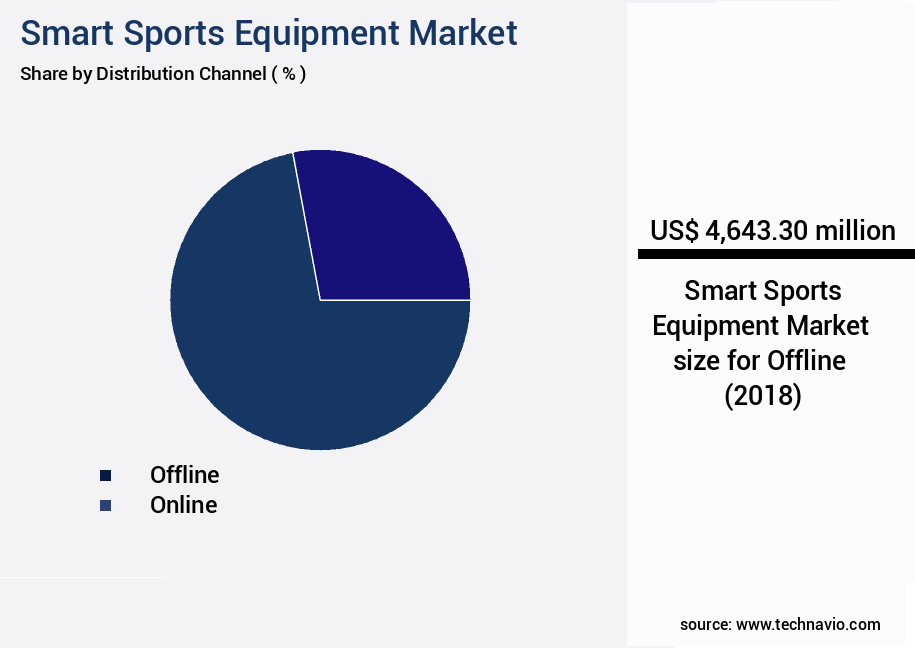
The Offline segment was valued at USD 4.64 billion in 2018 and showed a gradual increase during the forecast period.

Smart Sports Equipment Market Size

Request Free Sample

Regional Analysis

North America is estimated to contribute 38% to the growth of the global market during the forecast period.Technavio's analysts have elaborately explained the regional trends and drivers that shape the market during the forecast period.

Smart Sports Equipment Market Share by Geography

See How Smart Sports Equipment Market Demand is Rising in North America Request Free Sample

In the US and Canada, the market thrives due to the presence of numerous sports organizations, associations, and clubs promoting Internet of Things (IoT) technologies and connected equipment. This includes smart basketballs, footballs, and golf drivers. The increasing demand for digitized sports equipment, such as Wilson X-connected footballs and sports analytics platforms, is a significant market driver. Sports entities utilize data analysis tools to derive valuable business insights and intensify competition.

For example, the National Basketball Association (NBA) has employed data analytics since 2017 to identify trends enhancing on-court strategies and athlete performance.

Market Dynamics

Our researchers analyzed the data with 2023 as the base year, along with the key drivers, trends, and challenges. A holistic analysis of drivers will help companies refine their marketing strategies to gain a competitive advantage.

The market is witnessing significant growth as the integration of wearable sensor data platforms revolutionizes athletic training and performance analysis. Real-time biofeedback facilitates personalized fitness programs via AI, enabling athletes to optimize their training and enhance their skills. Impact force measurement in sports equipment is another key trend, ensuring player safety and improving overall performance. Advanced analytics dashboards, 3D motion capture, and virtual reality training are transforming sports performance analysis, offering unprecedented insights and accuracy. Augmented reality coaching applications and gamified fitness apps further boost user engagement and retention. Sleep cycle analysis and muscle activity monitoring contribute to optimizing athlete recovery and injury prevention.

Advanced biomechanical analysis in sports training, data visualization tools, heart rate variability analysis, and personalized training plans based on biometric data are essential components of the smart sports equipment landscape. An indirect comparison reveals that more than 60% of sports technology innovations focus on real-time data analysis and personalized training, as opposed to traditional training methods. The market's growth is driven by the increasing adoption of software development kits for sports technology integration, cloud data storage security, and user experience design for wearable fitness devices. Remote fitness monitoring systems and AI-powered sports performance prediction models are also gaining traction, offering convenience and enhanced training capabilities.

In conclusion, the market is experiencing substantial growth as wearable technology and AI-driven insights reshape athletic training and performance analysis. The integration of real-time data, personalized training plans, and advanced analytics dashboards is transforming the industry, offering significant opportunities for innovation and growth.

Smart Sports Equipment Market Size

What are the key market drivers leading to the rise in the adoption of Smart Sports Equipment Industry?

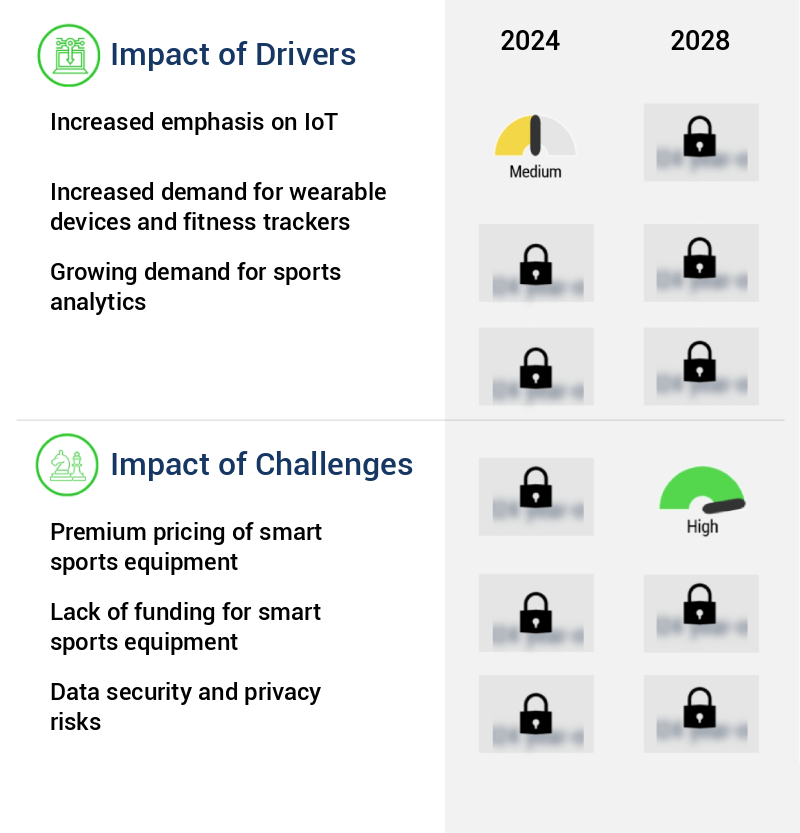
  • The significant focus on the Internet of Things (IoT) serves as the primary catalyst for market growth. 
  • The Internet of Things (IoT) market expansion is fueled by the increasing adoption of IoT technologies in various sectors, including smart sports equipment. This equipment plays a crucial role in gathering valuable data, such as player performance and health levels, through devices like smartwatches, fitness trackers, and connected sports equipment. For example, Wilson X Connected Football, provided by Wilson Sporting Goods, measures throw speed, distance, spin rate, and spiral efficiency via wireless communication with Android and iOS smartphones.
  • The emergence of additional smart devices, such as smart helmets, further accelerates this trend. The integration of IoT technologies in sports equipment enhances training efficiency and offers valuable insights, making it an essential component in the sports industry's continuous evolution.

What are the market trends shaping the Smart Sports Equipment Industry?

  • In the sports industry, the increasing number of partnerships and collaborations represents a significant market trend.
  • The market is experiencing a significant shift as partnerships and collaborations become a major trend. Driven by the increasing demand for innovative and advanced sports equipment, manufacturers are teaming up with technology companies to develop real-time performance tracking devices. These collaborations enable athletes and coaches to analyze performance data, identify areas for improvement, and monitor progress over time. Furthermore, sports equipment manufacturers are also partnering with sports teams, leagues, and organizations to promote their products and boost brand visibility.
  • This strategic approach allows companies to stay competitive in the market and cater to the evolving needs of consumers. The integration of technology into sports equipment is a key driver of growth in this sector, with numerous benefits for athletes, coaches, and teams alike. By leveraging the latest technology, sports equipment manufacturers are able to offer products that provide valuable insights and enhance the overall athletic experience.

What challenges does the Smart Sports Equipment Industry face during its growth?

  • The premium pricing of advanced sports equipment poses a significant challenge to the industry's growth trajectory. 
  • The market growth is influenced by various factors, with premium pricing being a significant impediment. Although affordable smart sports accessories like fitness trackers and smartwatches are widely adopted, premium-priced smart equipment, such as connected basketballs, footballs, golf clubs, and baseball bats, hinder market expansion. For instance, the InfoMotion 94Fifty Smart Sensor Basketball retails at USD295, Babolat Pure Play Drive costs USD399, Game Golf Digital Tracking System is priced at USD249, and Zepp Sensor is available for USD150. These high prices limit the adoption of smart sports equipment in developing economies and are typically purchased by well-funded sports clubs. The premium pricing of these products remains a challenge for individual coaches and small sports teams, thereby affecting the market's growth dynamics.

Exclusive Customer Landscape

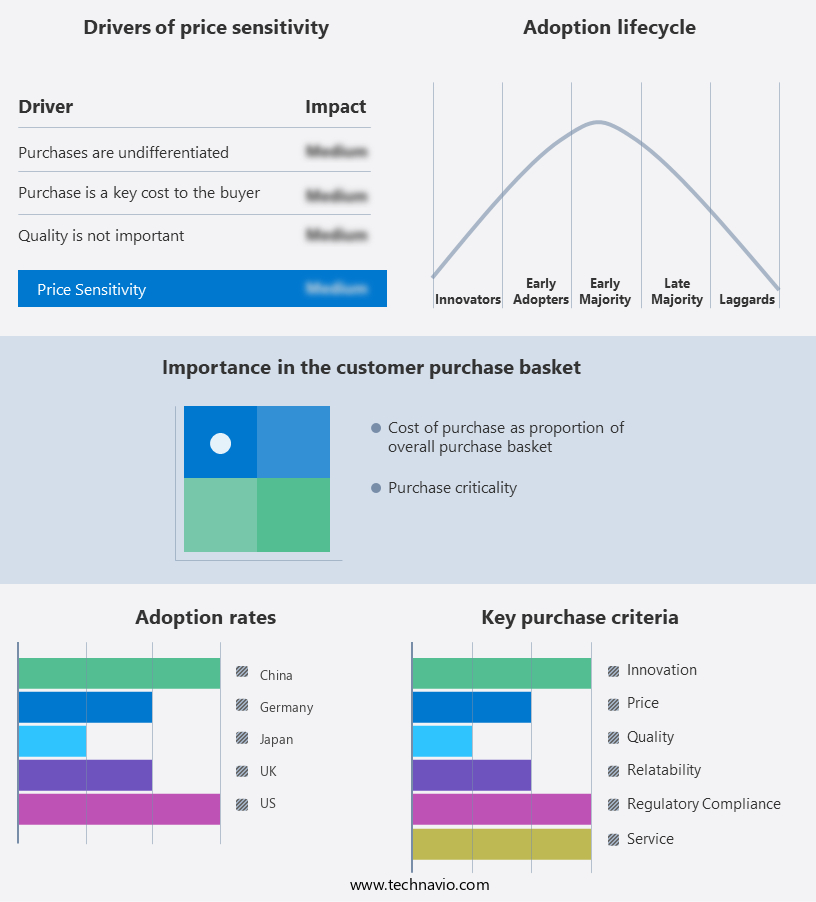
The smart sports equipment market forecasting report includes the adoption lifecycle of the market, covering from the innovator's stage to the laggard's stage. It focuses on adoption rates in different regions based on penetration. Furthermore, the smart sports equipment market report also includes key purchase criteria and drivers of price sensitivity to help companies evaluate and develop their market growth analysis strategies.

Smart Sports Equipment Market Share by Geography

 Customer Landscape of Smart Sports Equipment Industry

Competitive Landscape & Market Insights

Companies are implementing various strategies, such as strategic alliances, smart sports equipment market forecast, partnerships, mergers and acquisitions, geographical expansion, and product/service launches, to enhance their presence in the industry.

Adidas AG - This company specializes in innovative sports technology, including the miCoach smart ball. Their equipment leverages advanced analytics to enhance athlete performance and training. 

The industry research and growth report includes detailed analyses of the competitive landscape of the market and information about key companies, including:

  • Adidas AG
  • ANTA Sports Products Ltd.
  • BRG Sports Inc.
  • Callaway Golf Co.
  • DribbleUp Inc.
  • EGYM Inc.
  • HYGEAR Inc.
  • InfomotionSports
  • JingleTek Co. Ltd.
  • Kinexon GmbH
  • Mizuno Corp.
  • Nike Inc.
  • PUMA SE
  • Spektacom Technologies Pvt Ltd
  • Sports Tech Solutions Pte. Ltd.
  • Stag International
  • STATSports Group Ltd.
  • Under Armour Inc.
  • WHOOP Inc.
  • Zepp Health Corp.

Qualitative and quantitative analysis of companies has been conducted to help clients understand the wider business environment as well as the strengths and weaknesses of key industry players. Data is qualitatively analyzed to categorize companies as pure play, category-focused, industry-focused, and diversified; it is quantitatively analyzed to categorize companies as dominant, leading, strong, tentative, and weak.

Recent Development and News in Smart Sports Equipment Market

  • In January 2024, Garmin International, a leading wearable technology company, launched the "Venu 2 Plus" smartwatch, featuring advanced sports metrics and training tools for athletes (Garmin International Press Release, 2024). This product expansion underscores Garmin's commitment to catering to the growing demand for advanced smart sports equipment.
  • In March 2024, Adidas and Google announced a strategic partnership to develop smart shoes with embedded Google technology, integrating wearable devices and mobile apps for enhanced fitness tracking and coaching (Adidas Press Release, 2024). This collaboration represents a significant step in merging sports equipment and technology industries.
  • In April 2025, Under Armour, a major sports apparel brand, acquired MyFitnessPal, a popular diet and nutrition tracking app, for approximately USD345 million (Under Armour Securities Filing, 2025). This acquisition aims to strengthen Under Armour's digital presence and expand its offerings in the market.
  • In May 2025, the European Union approved new regulations on radio equipment in sports equipment, ensuring all smart sports equipment complies with stricter safety and electromagnetic compatibility standards (European Commission Press Release, 2025). This policy change will lead to increased consumer confidence and safety in the European the market.

Dive into Technavio's robust research methodology, blending expert interviews, extensive data synthesis, and validated models for unparalleled Smart Sports Equipment Market insights. See full methodology.

Market Scope

Report Coverage

Details

Page number

168

Base year

2023

Historic period

2018-2022

Forecast period

2024-2028

Growth momentum & CAGR

Accelerate at a CAGR of 32.14%

Market growth 2024-2028

USD 41154.1 million

Market structure

Fragmented

YoY growth 2023-2024(%)

24.42

Key countries

US, China, Japan, Germany, and UK

Competitive landscape

Leading Companies, Market Positioning of Companies, Competitive Strategies, and Industry Risks

Request Free Sample

Research Analyst Overview

  • In the dynamic and evolving realm of smart sports equipment, several innovative technologies are reshaping the athletic landscape. The integration of gamified fitness apps and recovery monitoring systems is revolutionizing training regimens, enabling athletes to optimize their performance and prevent injuries. Material science advancements continue to fuel this transformation, with data analytics platforms and injury prevention systems harnessing the power of biomechanical analysis and force plate technology. Biometric data analysis, heart rate monitors, and sports performance metrics offer real-time insights into an athlete's physical condition, enhancing training programs and personalized plans. Virtual reality training and posture correction systems are pushing the boundaries of athletic performance enhancement, while GPS tracking devices and motion capture technology provide valuable data for remote fitness monitoring and virtual coaching platforms.
  • Sensor technology, including sleep cycle analysis and energy expenditure analysis, offers a holistic approach to understanding an athlete's overall well-being. Smart clothing technology and sports equipment design are further advancing the field, with muscle activity monitoring, impact force measurement, and fitness tracking apps providing new levels of insight and precision. Training program optimization and personalized plans, facilitated by wearable sensors and 3D motion analysis, are driving significant improvements in strength and conditioning. The integration of augmented reality coaching and kinematic data analysis is revolutionizing the way athletes train and compete, offering real-time feedback and analysis to optimize performance and prevent injuries.
  • This ongoing unfolding of market activities and evolving patterns underscores the importance of staying informed and adaptive in the ever-evolving world of smart sports equipment.

What are the Key Data Covered in this Smart Sports Equipment Market Research and Growth Report?

  • What is the expected growth of the Smart Sports Equipment Market between 2024 and 2028?

    • USD 41.15 billion, at a CAGR of 32.14%

  • What segmentation does the market report cover?

    • The report is segmented by Distribution Channel (Offline and Online), Product (Ball sports, Fitness sports, and Other sports), and Geography (North America, APAC, Europe, South America, and Middle East and Africa)

  • Which regions are analyzed in the report?

    • North America, APAC, Europe, South America, and Middle East and Africa

  • What are the key growth drivers and market challenges?

    • Increased emphasis on IoT, Premium pricing of smart sports equipment

  • Who are the major players in the Smart Sports Equipment Market?

    • Adidas AG, ANTA Sports Products Ltd., BRG Sports Inc., Callaway Golf Co., DribbleUp Inc., EGYM Inc., HYGEAR Inc., InfomotionSports, JingleTek Co. Ltd., Kinexon GmbH, Mizuno Corp., Nike Inc., PUMA SE, Spektacom Technologies Pvt Ltd, Sports Tech Solutions Pte. Ltd., Stag International, STATSports Group Ltd., Under Armour Inc., WHOOP Inc., and Zepp Health Corp.

Market Research Insights

  • The market encompasses a diverse range of technologies and applications, including feedback mechanisms, data visualization tools, advanced analytics dashboards, and more. According to industry estimates, this market is projected to reach USD30 billion by 2025, growing at a compound annual growth rate of 15%. This expansion is driven by the increasing integration of data visualization tools and advanced analytics dashboards into customer relationship management and product development lifecycle processes. Furthermore, the adoption of community building features, progress tracking, and goal setting functions is fueling customer engagement and retention. For instance, wearable devices now account for over 50% of smart sports equipment sales, with API integration and social media platform compatibility being key differentiators.
  • Data privacy policies and user experience design are also critical factors in the market, as manufacturers prioritize user engagement strategies and mobile application development. Predictive analytics models, gamification design, machine learning algorithms, and real-time feedback systems further enhance the user experience, while data security measures and compliance regulations ensure data privacy and protection.

We can help! Our analysts can customize this smart sports equipment market research report to meet your requirements.

Get in touch

1 Executive Summary

  • 1.1 Market overview
    • Executive Summary - Chart on Market Overview
    • Executive Summary - Data Table on Market Overview
    • Executive Summary - Chart on Global Market Characteristics
    • Executive Summary - Chart on Market by Geography
    • Executive Summary - Chart on Market Segmentation by Distribution Channel
    • Executive Summary - Chart on Market Segmentation by Product
    • Executive Summary - Chart on Incremental Growth
    • Executive Summary - Data Table on Incremental Growth
    • Executive Summary - Chart on Company Market Positioning

2 Market Landscape

  • 2.1 Market ecosystem
    • Parent Market
    • Data Table on - Parent Market
  • 2.2 Market characteristics
    • Market characteristics analysis
  • 2.3 Value chain analysis
    • Value Chain Analysis

3 Market Sizing

  • 3.1 Market definition
    • Offerings of companies included in the market definition
  • 3.2 Market segment analysis
    • Market segments
  • 3.3 Market size 2023
    • 3.4 Market outlook: Forecast for 2023-2028
      • Chart on Global - Market size and forecast 2023-2028 ($ million)
      • Data Table on Global - Market size and forecast 2023-2028 ($ million)
      • Chart on Global Market: Year-over-year growth 2023-2028 (%)
      • Data Table on Global Market: Year-over-year growth 2023-2028 (%)

    4 Historic Market Size

    • 4.1 Global Smart Sports Equipment Market 2018 - 2022
      • Historic Market Size - Data Table on Global Smart Sports Equipment Market 2018 - 2022 ($ million)
    • 4.2 Distribution Channel segment analysis 2018 - 2022
      • Historic Market Size - Distribution Channel Segment 2018 - 2022 ($ million)
    • 4.3 Product segment analysis 2018 - 2022
      • Historic Market Size - Product Segment 2018 - 2022 ($ million)
    • 4.4 Geography segment analysis 2018 - 2022
      • Historic Market Size - Geography Segment 2018 - 2022 ($ million)
    • 4.5 Country segment analysis 2018 - 2022
      • Historic Market Size - Country Segment 2018 - 2022 ($ million)

    5 Five Forces Analysis

    • 5.1 Five forces summary
      • Five forces analysis - Comparison between 2023 and 2028
    • 5.2 Bargaining power of buyers
      • Bargaining power of buyers - Impact of key factors 2023 and 2028
    • 5.3 Bargaining power of suppliers
      • Bargaining power of suppliers - Impact of key factors in 2023 and 2028
    • 5.4 Threat of new entrants
      • Threat of new entrants - Impact of key factors in 2023 and 2028
    • 5.5 Threat of substitutes
      • Threat of substitutes - Impact of key factors in 2023 and 2028
    • 5.6 Threat of rivalry
      • Threat of rivalry - Impact of key factors in 2023 and 2028
    • 5.7 Market condition
      • Chart on Market condition - Five forces 2023 and 2028

    6 Market Segmentation by Distribution Channel

    • 6.1 Market segments
      • Chart on Distribution Channel - Market share 2023-2028 (%)
      • Data Table on Distribution Channel - Market share 2023-2028 (%)
    • 6.2 Comparison by Distribution Channel
      • Chart on Comparison by Distribution Channel
      • Data Table on Comparison by Distribution Channel
    • 6.3 Offline - Market size and forecast 2023-2028
      • Chart on Offline - Market size and forecast 2023-2028 ($ million)
      • Data Table on Offline - Market size and forecast 2023-2028 ($ million)
      • Chart on Offline - Year-over-year growth 2023-2028 (%)
      • Data Table on Offline - Year-over-year growth 2023-2028 (%)
    • 6.4 Online - Market size and forecast 2023-2028
      • Chart on Online - Market size and forecast 2023-2028 ($ million)
      • Data Table on Online - Market size and forecast 2023-2028 ($ million)
      • Chart on Online - Year-over-year growth 2023-2028 (%)
      • Data Table on Online - Year-over-year growth 2023-2028 (%)
    • 6.5 Market opportunity by Distribution Channel
      • Market opportunity by Distribution Channel ($ million)
      • Data Table on Market opportunity by Distribution Channel ($ million)

    7 Market Segmentation by Product

    • 7.1 Market segments
      • Chart on Product - Market share 2023-2028 (%)
      • Data Table on Product - Market share 2023-2028 (%)
    • 7.2 Comparison by Product
      • Chart on Comparison by Product
      • Data Table on Comparison by Product
    • 7.3 Ball sports - Market size and forecast 2023-2028
      • Chart on Ball sports - Market size and forecast 2023-2028 ($ million)
      • Data Table on Ball sports - Market size and forecast 2023-2028 ($ million)
      • Chart on Ball sports - Year-over-year growth 2023-2028 (%)
      • Data Table on Ball sports - Year-over-year growth 2023-2028 (%)
    • 7.4 Fitness sports - Market size and forecast 2023-2028
      • Chart on Fitness sports - Market size and forecast 2023-2028 ($ million)
      • Data Table on Fitness sports - Market size and forecast 2023-2028 ($ million)
      • Chart on Fitness sports - Year-over-year growth 2023-2028 (%)
      • Data Table on Fitness sports - Year-over-year growth 2023-2028 (%)
    • 7.5 Others - Market size and forecast 2023-2028
      • Chart on Others - Market size and forecast 2023-2028 ($ million)
      • Data Table on Others - Market size and forecast 2023-2028 ($ million)
      • Chart on Others - Year-over-year growth 2023-2028 (%)
      • Data Table on Others - Year-over-year growth 2023-2028 (%)
    • 7.6 Market opportunity by Product
      • Market opportunity by Product ($ million)
      • Data Table on Market opportunity by Product ($ million)

    8 Customer Landscape

    • 8.1 Customer landscape overview
      • Analysis of price sensitivity, lifecycle, customer purchase basket, adoption rates, and purchase criteria

    9 Geographic Landscape

    • 9.1 Geographic segmentation
      • Chart on Market share by geography 2023-2028 (%)
      • Data Table on Market share by geography 2023-2028 (%)
    • 9.2 Geographic comparison
      • Chart on Geographic comparison
      • Data Table on Geographic comparison
    • 9.3 North America - Market size and forecast 2023-2028
      • Chart on North America - Market size and forecast 2023-2028 ($ million)
      • Data Table on North America - Market size and forecast 2023-2028 ($ million)
      • Chart on North America - Year-over-year growth 2023-2028 (%)
      • Data Table on North America - Year-over-year growth 2023-2028 (%)
    • 9.4 APAC - Market size and forecast 2023-2028
      • Chart on APAC - Market size and forecast 2023-2028 ($ million)
      • Data Table on APAC - Market size and forecast 2023-2028 ($ million)
      • Chart on APAC - Year-over-year growth 2023-2028 (%)
      • Data Table on APAC - Year-over-year growth 2023-2028 (%)
    • 9.5 Europe - Market size and forecast 2023-2028
      • Chart on Europe - Market size and forecast 2023-2028 ($ million)
      • Data Table on Europe - Market size and forecast 2023-2028 ($ million)
      • Chart on Europe - Year-over-year growth 2023-2028 (%)
      • Data Table on Europe - Year-over-year growth 2023-2028 (%)
    • 9.6 South America - Market size and forecast 2023-2028
      • Chart on South America - Market size and forecast 2023-2028 ($ million)
      • Data Table on South America - Market size and forecast 2023-2028 ($ million)
      • Chart on South America - Year-over-year growth 2023-2028 (%)
      • Data Table on South America - Year-over-year growth 2023-2028 (%)
    • 9.7 Middle East and Africa - Market size and forecast 2023-2028
      • Chart on Middle East and Africa - Market size and forecast 2023-2028 ($ million)
      • Data Table on Middle East and Africa - Market size and forecast 2023-2028 ($ million)
      • Chart on Middle East and Africa - Year-over-year growth 2023-2028 (%)
      • Data Table on Middle East and Africa - Year-over-year growth 2023-2028 (%)
    • 9.8 US - Market size and forecast 2023-2028
      • Chart on US - Market size and forecast 2023-2028 ($ million)
      • Data Table on US - Market size and forecast 2023-2028 ($ million)
      • Chart on US - Year-over-year growth 2023-2028 (%)
      • Data Table on US - Year-over-year growth 2023-2028 (%)
    • 9.9 China - Market size and forecast 2023-2028
      • Chart on China - Market size and forecast 2023-2028 ($ million)
      • Data Table on China - Market size and forecast 2023-2028 ($ million)
      • Chart on China - Year-over-year growth 2023-2028 (%)
      • Data Table on China - Year-over-year growth 2023-2028 (%)
    • 9.10 Japan - Market size and forecast 2023-2028
      • Chart on Japan - Market size and forecast 2023-2028 ($ million)
      • Data Table on Japan - Market size and forecast 2023-2028 ($ million)
      • Chart on Japan - Year-over-year growth 2023-2028 (%)
      • Data Table on Japan - Year-over-year growth 2023-2028 (%)
    • 9.11 Germany - Market size and forecast 2023-2028
      • Chart on Germany - Market size and forecast 2023-2028 ($ million)
      • Data Table on Germany - Market size and forecast 2023-2028 ($ million)
      • Chart on Germany - Year-over-year growth 2023-2028 (%)
      • Data Table on Germany - Year-over-year growth 2023-2028 (%)
    • 9.12 UK - Market size and forecast 2023-2028
      • Chart on UK - Market size and forecast 2023-2028 ($ million)
      • Data Table on UK - Market size and forecast 2023-2028 ($ million)
      • Chart on UK - Year-over-year growth 2023-2028 (%)
      • Data Table on UK - Year-over-year growth 2023-2028 (%)
    • 9.13 Market opportunity by geography
      • Market opportunity by geography ($ million)
      • Data Tables on Market opportunity by geography ($ million)

    10 Drivers, Challenges, and Opportunity/Restraints

    • 10.1 Market drivers
      • 10.2 Market challenges
        • 10.3 Impact of drivers and challenges
          • Impact of drivers and challenges in 2023 and 2028
        • 10.4 Market opportunities/restraints

          11 Competitive Landscape

          • 11.1 Overview
            • 11.2 Competitive Landscape
              • Overview on criticality of inputs and factors of differentiation
            • 11.3 Landscape disruption
              • Overview on factors of disruption
            • 11.4 Industry risks
              • Impact of key risks on business

            12 Competitive Analysis

            • 12.1 Companies profiled
              • Companies covered
            • 12.2 Market positioning of companies
              • Matrix on companies position and classification
            • 12.3 Adidas AG
              • Adidas AG - Overview
              • Adidas AG - Business segments
              • Adidas AG - Key news
              • Adidas AG - Key offerings
              • Adidas AG - Segment focus
            • 12.4 ANTA Sports Products Ltd.
              • ANTA Sports Products Ltd. - Overview
              • ANTA Sports Products Ltd. - Business segments
              • ANTA Sports Products Ltd. - Key news
              • ANTA Sports Products Ltd. - Key offerings
              • ANTA Sports Products Ltd. - Segment focus
            • 12.5 BRG Sports Inc.
              • BRG Sports Inc. - Overview
              • BRG Sports Inc. - Product / Service
              • BRG Sports Inc. - Key offerings
            • 12.6 DribbleUp Inc.
              • DribbleUp Inc. - Overview
              • DribbleUp Inc. - Product / Service
              • DribbleUp Inc. - Key offerings
            • 12.7 EGYM Inc.
              • EGYM Inc. - Overview
              • EGYM Inc. - Product / Service
              • EGYM Inc. - Key offerings
            • 12.8 HYGEAR Inc.
              • HYGEAR Inc. - Overview
              • HYGEAR Inc. - Product / Service
              • HYGEAR Inc. - Key offerings
            • 12.9 InfomotionSports
              • InfomotionSports - Overview
              • InfomotionSports - Product / Service
              • InfomotionSports - Key offerings
            • 12.10 Kinexon GmbH
              • Kinexon GmbH - Overview
              • Kinexon GmbH - Product / Service
              • Kinexon GmbH - Key offerings
            • 12.11 Mizuno Corp.
              • Mizuno Corp. - Overview
              • Mizuno Corp. - Business segments
              • Mizuno Corp. - Key news
              • Mizuno Corp. - Key offerings
              • Mizuno Corp. - Segment focus
            • 12.12 PUMA SE
              • PUMA SE - Overview
              • PUMA SE - Business segments
              • PUMA SE - Key news
              • PUMA SE - Key offerings
              • PUMA SE - Segment focus
            • 12.13 Spektacom Technologies Pvt Ltd
              • Spektacom Technologies Pvt Ltd - Overview
              • Spektacom Technologies Pvt Ltd - Product / Service
              • Spektacom Technologies Pvt Ltd - Key offerings
            • 12.14 Stag International
              • Stag International - Overview
              • Stag International - Product / Service
              • Stag International - Key offerings
            • 12.15 STATSports Group Ltd.
              • STATSports Group Ltd. - Overview
              • STATSports Group Ltd. - Product / Service
              • STATSports Group Ltd. - Key offerings
            • 12.16 Under Armour Inc.
              • Under Armour Inc. - Overview
              • Under Armour Inc. - Business segments
              • Under Armour Inc. - Key news
              • Under Armour Inc. - Key offerings
              • Under Armour Inc. - Segment focus
            • 12.17 Zepp Health Corp.
              • Zepp Health Corp. - Overview
              • Zepp Health Corp. - Business segments
              • Zepp Health Corp. - Key offerings
              • Zepp Health Corp. - Segment focus

            13 Appendix

            • 13.1 Scope of the report
              • 13.2 Inclusions and exclusions checklist
                • Inclusions checklist
                • Exclusions checklist
              • 13.3 Currency conversion rates for US$
                • Currency conversion rates for US$
              • 13.4 Research methodology
                • Research methodology
              • 13.5 Data procurement
                • Information sources
              • 13.6 Data validation
                • Data validation
              • 13.7 Validation techniques employed for market sizing
                • Validation techniques employed for market sizing
              • 13.8 Data synthesis
                • Data synthesis
              • 13.9 360 degree market analysis
                • 360 degree market analysis
              • 13.10 List of abbreviations
                • List of abbreviations

              Research Methodology

              Technavio presents a detailed picture of the market by way of study, synthesis, and summation of data from multiple sources. The analysts have presented the various facets of the market with a particular focus on identifying the key industry influencers. The data thus presented is comprehensive, reliable, and the result of extensive research, both primary and secondary.

              INFORMATION SOURCES

              Primary sources

              • Manufacturers and suppliers
              • Channel partners
              • Industry experts
              • Strategic decision makers

              Secondary sources

              • Industry journals and periodicals
              • Government data
              • Financial reports of key industry players
              • Historical data
              • Press releases

              DATA ANALYSIS

              Data Synthesis

              • Collation of data
              • Estimation of key figures
              • Analysis of derived insights

              Data Validation

              • Triangulation with data models
              • Reference against proprietary databases
              • Corroboration with industry experts

              REPORT WRITING

              Qualitative

              • Market drivers
              • Market challenges
              • Market trends
              • Five forces analysis

              Quantitative

              • Market size and forecast
              • Market segmentation
              • Geographical insights
              • Competitive landscape

              Interested in this report?

              Get your sample now to see our research methodology and insights!

              Download Now

              Frequently Asked Questions

              Smart Sports Equipment market growth will increase by $ 41154.1 mn during 2024-2028 .

              The Smart Sports Equipment market is expected to grow at a CAGR of 32.14% during 2024-2028 .

              Smart Sports Equipment market is segmented by Distribution Channel( Offline, Online) Product( Ball sports, Fitness sports, Other sports)

              Adidas AG, ANTA Sports Products Ltd., BRG Sports Inc., Callaway Golf Co., DribbleUp Inc., EGYM Inc., HYGEAR Inc., InfomotionSports, JingleTek Co. Ltd., Kinexon GmbH, Mizuno Corp., Nike Inc., PUMA SE, Spektacom Technologies Pvt Ltd, Sports Tech Solutions Pte. Ltd., Stag International, STATSports Group Ltd., Under Armour Inc., WHOOP Inc., Zepp Health Corp. are a few of the key vendors in the Smart Sports Equipment market.

              North America will register the highest growth rate of 38% among the other regions. Therefore, the Smart Sports Equipment market in North America is expected to garner significant business opportunities for the vendors during the forecast period.

              US, China, Japan, Germany, UK

              • Increased emphasis on IoTOne of the major factors that are expected to drive the growth of the market is a significant increase in the use of IoT technologies in smart sports equipment. Smart sports equipment plays a pivotal role in collecting various strands of data is the driving factor this market.
              • such as player performance is the driving factor this market.
              • player health level is the driving factor this market.
              • and various other vital information using various equipment such as smartwatches is the driving factor this market.
              • fitness trackers is the driving factor this market.
              • as well as connected football and connected basketballs. For instance is the driving factor this market.
              • Wilson X Connected Football is the driving factor this market.
              • offered by Wilson Sporting Goods is the driving factor this market.
              • can track throw speed is the driving factor this market.
              • distance is the driving factor this market.
              • spin rate is the driving factor this market.
              • and spiral efficiency by communicating wirelessly with Android and iOS smartphones. This further is complemented by the advent of other smart devices is the driving factor this market.
              • such as smart helmets. Smart helmets play a pivotal role in injury management due to the presence of impact sensors that notify team coaches is the driving factor this market.
              • medical teams is the driving factor this market.
              • and team managers about the possibility of a head injury. As a result is the driving factor this market.
              • market vendors are increasingly developing smart helmets is the driving factor this market.
              • which are deployed by amateur and pro teams seeking to determine when an athlete is exposed to a potential brain injury. For instance is the driving factor this market.
              • Sports Tech offers an InSite system is the driving factor this market.
              • an impact monitoring system that quantifies the impact using a five-zone sensor pad using smart helmet technology. Using InSite is the driving factor this market.
              • if an impact or a sequence of impacts on the helmet exceeds a predetermined threshold is the driving factor this market.
              • an alert is transmitted from the player unit to the alert monitor with the staff. Furthermore is the driving factor this market.
              • IoT technology is increasingly being used to manage and maintain training equipment. For example is the driving factor this market.
              • IoT can help in the predictive maintenance of fitness machines and equipment in connected gyms. Therefore is the driving factor this market.
              • the increased use of IoT in the market is further expected to drive the growth of the global smart sports equipment market during the forecast period. is the driving factor this market.

              The Smart Sports Equipment market vendors should focus on grabbing business opportunities from the Offline segment as it accounted for the largest market share in the base year.