
Social Media Analytics Market Size 2026-2030
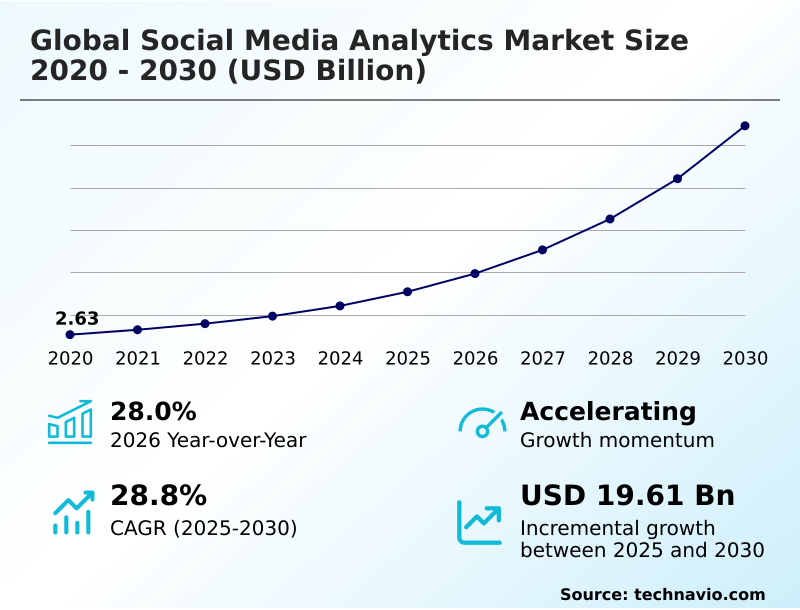
The social media analytics market size is valued to increase by USD 19.61 billion, at a CAGR of 28.8% from 2025 to 2030. Growing availability and complexity of data will drive the social media analytics market.
Major Market Trends & Insights
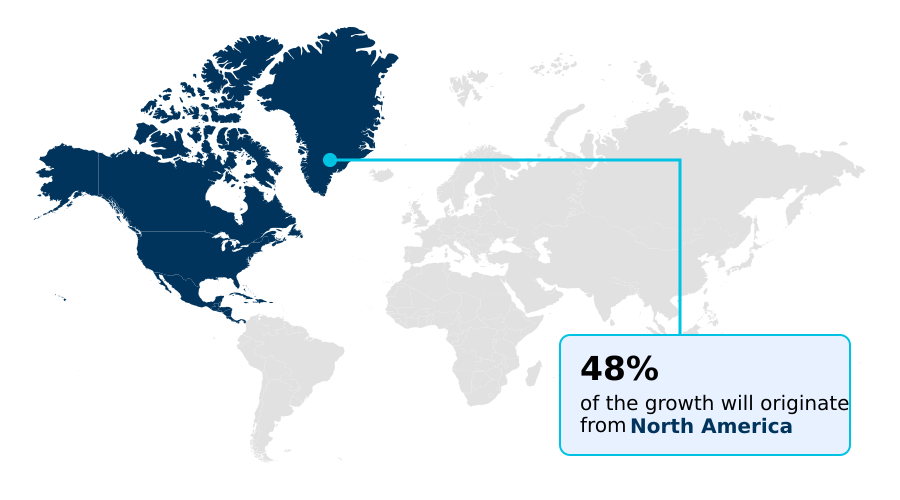
- North America dominated the market and accounted for a 47.9% growth during the forecast period.
- By End-user - Retail segment was valued at USD 2.22 billion in 2024
- By Application - Sales and marketing management segment accounted for the largest market revenue share in 2024
Market Size & Forecast
- Market Opportunities: USD 24.68 billion
- Market Future Opportunities: USD 19.61 billion
- CAGR from 2025 to 2030 : 28.8%
Market Summary
- The social media analytics market is evolving from a simple monitoring tool into a strategic business intelligence function essential for data-driven decision making. Organizations leverage these platforms for comprehensive competitive intelligence, effective risk management, and optimized sales and marketing management.
- By analyzing real-time consumer behavior and user-generated content analysis, businesses can refine their omnichannel retail strategies and improve user engagement monitoring. This involves sophisticated unstructured data interpretation and audience segmentation techniques to personalize customer interactions.
- For instance, a global CPG firm utilizes real-time sentiment tracking to adjust its messaging during a new product launch, seeing a 15% uplift in positive sentiment compared to previous campaigns. Core functions now include influencer marketing analytics, supported by advanced influencer identification algorithms, and robust competitor social media analysis.
- The industry's trajectory is toward deeper integration, with a focus on demonstrating tangible outcomes through social media roi measurement and ensuring data integrity with technologies for bot detection in social media. Ultimately, these tools are critical for enhancing brand performance tracking and navigating the complexities of omnichannel customer journey mapping.
What will be the Size of the Social Media Analytics Market during the forecast period?
Get Key Insights on Market Forecast (PDF) Get Free Sample
How is the Social Media Analytics Market Segmented?
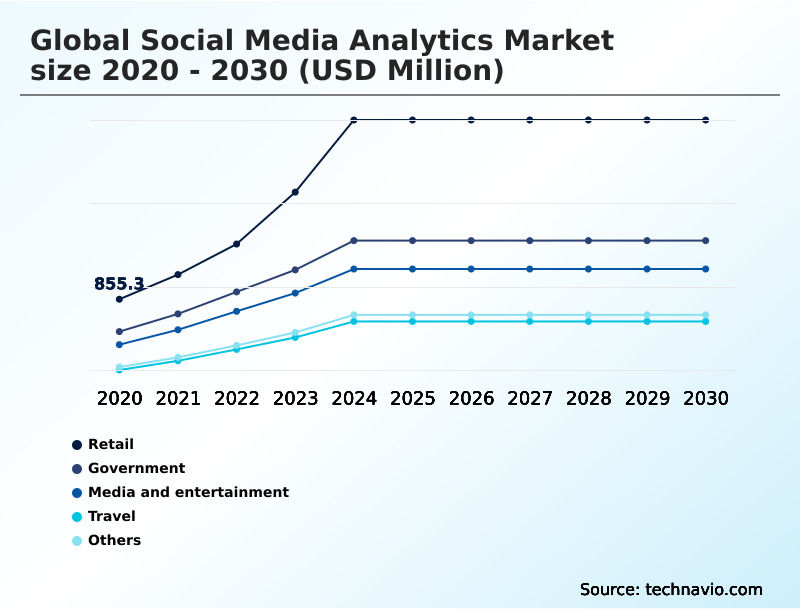
The social media analytics industry research report provides comprehensive data (region-wise segment analysis), with forecasts and estimates in "USD million" for the period 2026-2030, as well as historical data from 2020-2024 for the following segments.
- End-user
- Retail
- Government
- Media and entertainment
- Travel
- Others
- Application
- Sales and marketing management
- Customer experience management
- Competitive intelligence
- Risk management
- Public safety and law enforcement
- Deployment
- On-premises
- Cloud
- Type
- Predictive analytics
- Prescriptive analytics
- Descriptive analytics
- Diagnostics analytics
- Geography
- North America
- US
- Canada
- Mexico
- APAC
- China
- Japan
- India
- Europe
- Germany
- UK
- France
- South America
- Brazil
- Argentina
- Middle East and Africa
- Saudi Arabia
- UAE
- South Africa
- Rest of World (ROW)
- North America
By End-user Insights
The retail segment is estimated to witness significant growth during the forecast period.
The retail segment is a primary adopter of social media analytics, driven by the need for data-centric marketing.
Retailers are implementing sophisticated omnichannel retail strategies, using insights from user-generated content analysis to refine product offerings and enhance in-store and online experiences.
Digital advertising optimization is achieved through deep audience segmentation techniques and continuous competitor social media analysis, allowing brands to secure a competitive advantage. Furthermore, influencer marketing analytics and advanced influencer identification algorithms are central to modern campaigns.
The integration of social commerce integration with analytics platforms enables precise social commerce conversion tracking and social media roi measurement.
This data-driven approach, which includes real-time sentiment tracking, allows for effective brand reputation management and improves customer lifetime value by over 15% through optimized customer journey mapping.
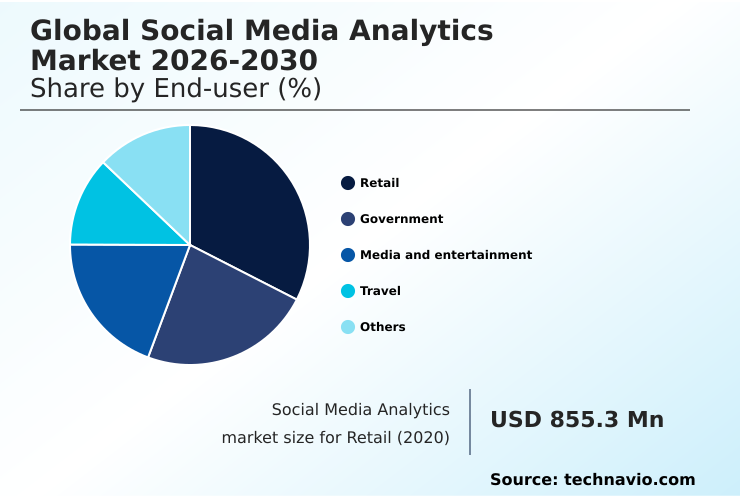
The Retail segment was valued at USD 2.22 billion in 2024 and showed a gradual increase during the forecast period.
Regional Analysis
North America is estimated to contribute 47.9% to the growth of the global market during the forecast period.Technavio’s analysts have elaborately explained the regional trends and drivers that shape the market during the forecast period.
See How Social Media Analytics Market Demand is Rising in North America Get Free Sample
The market's geographic landscape is characterized by varying levels of adoption and sophistication. North America leads due to its mature digital infrastructure and early integration of AI-powered analytics platforms.
In this region, enterprises leverage advanced analytics software for unified customer experience management, achieving a 47.9% share of incremental growth. In contrast, APAC is the fastest-growing region, driven by mobile-first economies and the rapid digitization of SMEs.
European adoption is shaped by stringent social media compliance tracking, prioritizing privacy in customer experience management. Across all regions, the focus is on achieving tangible results through predictive customer behavior modeling and precise social media roi measurement.
The use of natural language processing for public opinion tracking is becoming a standard globally, allowing for nuanced insights that inform strategic decisions and support complex campaign attribution modeling.
Market Dynamics
Our researchers analyzed the data with 2025 as the base year, along with the key drivers, trends, and challenges. A holistic analysis of drivers will help companies refine their marketing strategies to gain a competitive advantage.
- The strategic application of social media analytics is becoming highly specialized, with distinct use cases emerging across industries. For example, social media analytics for retail is crucial for understanding shopper behavior, while government agencies utilize social media analytics for government for public sentiment analysis and social media analytics for public safety.
- The deployment of customer sentiment analysis tools and systems for real-time brand reputation monitoring has become standard practice for brand management. For strategic positioning, social media competitive intelligence provides an essential edge. Marketing departments now depend on solutions for influencer marketing campaign tracking and measuring social media campaign roi to justify budgets.
- The integration of AI in social media analytics is unlocking new capabilities, such as using social data for predictive modeling. A significant focus area is social media risk management strategies, which are critical for mitigating reputational damage.
- Companies also use social listening for product feedback to drive innovation, with firms using this approach seeing a two-fold increase in relevant product suggestions compared to traditional surveys. Addressing technical hurdles like unstructured social media data analysis and identifying fake accounts with analytics remains a priority.
- In parallel, sectors are finding unique value, such as optimizing customer experience with social data in hospitality and leveraging social media analytics for the travel industry.
- The rise of private-label brand social media strategy and targeted social media analytics for vegan brands showcases market segmentation, while core goals like improving sales with social media insights and tailoring analytics for media and entertainment drive widespread adoption.
What are the key market drivers leading to the rise in the adoption of Social Media Analytics Industry?
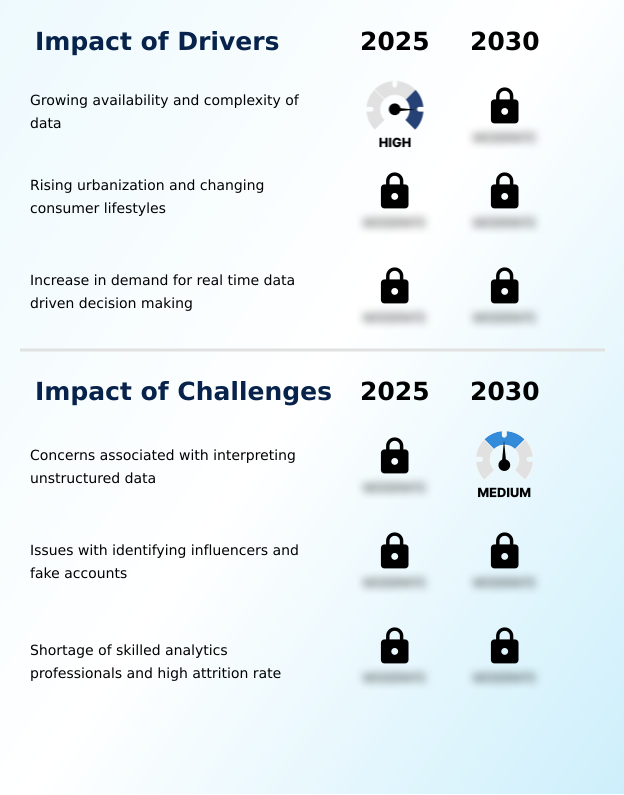
- The growing availability and complexity of structured and unstructured data from social media platforms is a major driver for the market, creating a rich environment for advanced analytics solutions.
- The increasing demand for real-time, data-driven insights is a significant driver. Organizations are moving beyond basic descriptive analytics to adopt predictive analytics for forecasting trends and prescriptive analytics for recommending optimal actions, improving strategic planning accuracy by over 25%.
- Advanced consumer intelligence platforms and media intelligence solutions facilitate this shift. These tools enable AI-driven real-time event detection, which is crucial for dynamic industries.
- Furthermore, diagnostics analytics helps uncover the root causes of performance shifts through sophisticated campaign attribution modeling and emotional analysis of text. Businesses utilize these capabilities for market gap identification and to refine their approach through social selling analytics.
- The use of multilingual sentiment analysis and effective customer feedback aggregation provides a comprehensive view, directly enhancing product development cycles.
What are the market trends shaping the Social Media Analytics Industry?
- The expansion of organized retail and e-commerce platforms is augmenting market growth. This trend increases the need for data-driven decision-making to understand customer preferences and sentiment.
- Evolving consumer behaviors, such as the growing interest in niche lifestyle products and private-label brands, are creating new opportunities for data-driven decision making. Companies are leveraging real-time trend spotting and analysis of real-time consumer behavior for effective sales and marketing management. This involves continuous user engagement monitoring and utilizing a brand health monitoring dashboard to maintain market relevance.
- Content strategy optimization now incorporates multilingual content analysis to reach diverse global audiences, with firms seeing a 20% improvement in engagement from localized campaigns. Moreover, brand performance tracking and share of voice analysis have become standard practices.
- The ability to perform social media crisis detection and proactive crisis management monitoring helps organizations mitigate reputational risks, reducing negative impact escalations by up to 30%.
What challenges does the Social Media Analytics Industry face during its growth?
- Concerns associated with accurately interpreting large volumes of unstructured data, including text, images, and videos, present a key challenge affecting industry growth.
- A primary challenge involves the accurate unstructured data interpretation, as the volume of complex data from text, images, and video grows. Misinterpreting nuances in sentiment analysis can lead to flawed strategies. Effective social listening is complicated by the need for advanced bot detection in social media and the ability to perform detailed topic modeling from conversations.
- For applications in risk management and cybersecurity monitoring, identifying malicious actors is critical but increasingly difficult. Organizations also face hurdles in implementing comprehensive visual analysis and leveraging geolocational data analysis without violating privacy regulations.
- The shortage of professionals skilled in these areas, including fraud detection and network analysis of communities, slows adoption, with some firms reporting project delays of up to six months. These challenges also impact public safety and law enforcement applications that rely on precise user demographic analysis.
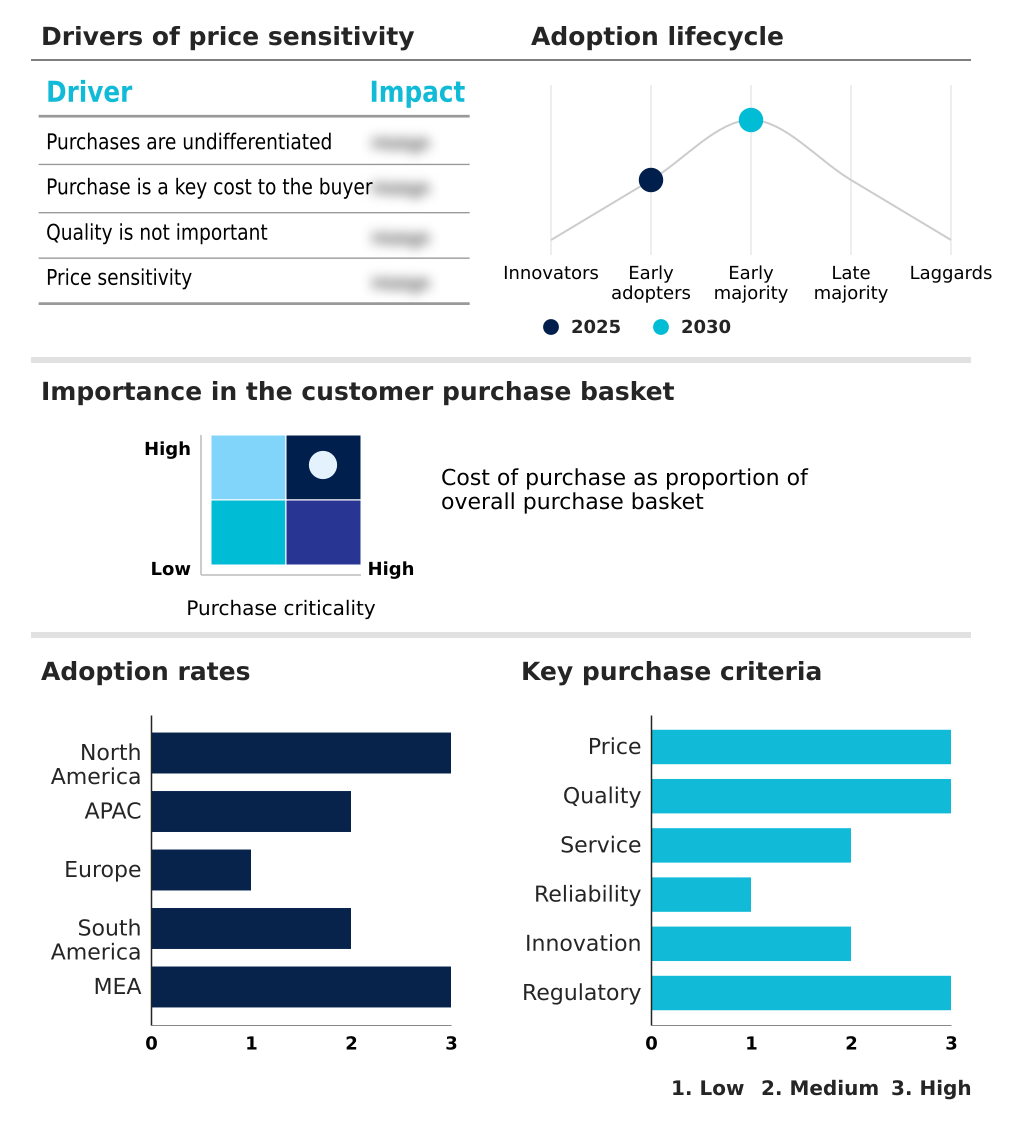
Exclusive Technavio Analysis on Customer Landscape
The social media analytics market forecasting report includes the adoption lifecycle of the market, covering from the innovator’s stage to the laggard’s stage. It focuses on adoption rates in different regions based on penetration. Furthermore, the social media analytics market report also includes key purchase criteria and drivers of price sensitivity to help companies evaluate and develop their market growth analysis strategies.
Customer Landscape of Social Media Analytics Industry
Competitive Landscape
Companies are implementing various strategies, such as strategic alliances, social media analytics market forecast, partnerships, mergers and acquisitions, geographical expansion, and product/service launches, to enhance their presence in the industry.
Cision US Inc. - Offerings include platforms for monitoring brand mentions, tracking influencer activity, and analyzing conversations across multiple social channels to generate actionable insights.
The industry research and growth report includes detailed analyses of the competitive landscape of the market and information about key companies, including:
- Cision US Inc.
- Dataminr Inc.
- Emplifi Inc.
- GoodData Corp.
- HubSpot Inc.
- IBM Corp.
- Ipsos Synthesio Inc
- Khoros LLC
- Meltwater NV
- Mention
- NetBase Solutions Inc.
- Qualtrics LLC
- Salesforce Inc.
- SAS Institute Inc.
- Semrush Holdings Inc.
- Sprinklr Inc.
- Sprout Social Inc.
- Talkwalker Sarl
- YouScan Ltd.
- Zoho Corp. Pvt. Ltd.
Qualitative and quantitative analysis of companies has been conducted to help clients understand the wider business environment as well as the strengths and weaknesses of key industry players. Data is qualitatively analyzed to categorize companies as pure play, category-focused, industry-focused, and diversified; it is quantitatively analyzed to categorize companies as dominant, leading, strong, tentative, and weak.
Recent Development and News in Social media analytics market
- In February 2025, Walmart expanded its AI-driven retail analytics capabilities to integrate social media insights with its customer experience platforms, highlighting the increasing importance of digital intelligence in modern retail operations.
- In March 2025, Deloitte emphasized the growing global shortage of data and analytics professionals, noting that demand for skilled talent is significantly outpacing supply across digital transformation sectors.
- In April 2025, Meta Platforms reported ongoing efforts to remove fake accounts and improve authenticity measures, addressing the widespread issue of bot activity and misleading engagement data.
- In May 2025, Carrefour expanded its digital marketing efforts for its private-label product range across multiple social media platforms, underscoring the role of data-driven campaigns in strengthening retail brand visibility.
Dive into Technavio’s robust research methodology, blending expert interviews, extensive data synthesis, and validated models for unparalleled Social Media Analytics Market insights. See full methodology.
| Market Scope | |
|---|---|
| Page number | 333 |
| Base year | 2025 |
| Historic period | 2020-2024 |
| Forecast period | 2026-2030 |
| Growth momentum & CAGR | Accelerate at a CAGR of 28.8% |
| Market growth 2026-2030 | USD 19614.4 million |
| Market structure | Fragmented |
| YoY growth 2025-2026(%) | 28.0% |
| Key countries | US, Canada, Mexico, China, Japan, India, South Korea, Australia, Indonesia, Germany, UK, France, Italy, Spain, The Netherlands, Brazil, Argentina, Chile, Saudi Arabia, UAE, South Africa, Israel and Turkey |
| Competitive landscape | Leading Companies, Market Positioning of Companies, Competitive Strategies, and Industry Risks |
Research Analyst Overview
- The social media analytics market has matured into an indispensable component of modern enterprise strategy, pivotal for data-driven decision making. It encompasses a wide array of functions, from sales and marketing management to intricate risk management. Organizations now employ advanced analytics software for continuous brand performance tracking and user engagement monitoring, analyzing real-time consumer behavior to inform omnichannel retail strategies.
- The core technology relies on natural language processing for sentiment analysis and multilingual content analysis, with advanced visual analysis for interpreting image and video data. Through comprehensive social listening, firms conduct user-generated content analysis to enhance customer experience management.
- Boardroom decisions on product roadmaps are now directly influenced by insights from consumer intelligence platforms, which can reduce market research timelines by 30%. The ecosystem includes media intelligence solutions for competitive intelligence and AI-powered analytics platforms for sophisticated predictive analytics and prescriptive analytics. These systems support everything from descriptive analytics for reporting to diagnostics analytics for root cause analysis.
- Key applications include influencer marketing analytics, digital advertising optimization, and mapping the customer journey mapping. For security, fraud detection and cybersecurity monitoring are critical, as is AI-driven real-time event detection for crisis management monitoring and maintaining brand reputation management.
- The technology also supports specialized use cases such as public safety and law enforcement and is fundamental to creating a unified customer experience management framework that includes social commerce integration.
What are the Key Data Covered in this Social Media Analytics Market Research and Growth Report?
-
What is the expected growth of the Social Media Analytics Market between 2026 and 2030?
-
USD 19.61 billion, at a CAGR of 28.8%
-
-
What segmentation does the market report cover?
-
The report is segmented by End-user (Retail, Government, Media and entertainment, Travel, and Others), Application (Sales and marketing management, Customer experience management, Competitive intelligence, Risk management, and Public safety and law enforcement), Deployment (On-premises, and Cloud), Type (Predictive analytics, Prescriptive analytics, Descriptive analytics, and Diagnostics analytics) and Geography (North America, APAC, Europe, South America, Middle East and Africa)
-
-
Which regions are analyzed in the report?
-
North America, APAC, Europe, South America and Middle East and Africa
-
-
What are the key growth drivers and market challenges?
-
Growing availability and complexity of data, Concerns associated with interpreting unstructured data
-
-
Who are the major players in the Social Media Analytics Market?
-
Cision US Inc., Dataminr Inc., Emplifi Inc., GoodData Corp., HubSpot Inc., IBM Corp., Ipsos Synthesio Inc, Khoros LLC, Meltwater NV, Mention, NetBase Solutions Inc., Qualtrics LLC, Salesforce Inc., SAS Institute Inc., Semrush Holdings Inc., Sprinklr Inc., Sprout Social Inc., Talkwalker Sarl, YouScan Ltd. and Zoho Corp. Pvt. Ltd.
-
Market Research Insights
- Market dynamics are shaped by the drive for actionable intelligence. Organizations now demand real-time sentiment tracking and robust influencer identification algorithms to prove social media roi measurement. Strategic decisions are informed by continuous competitor social media analysis and refined audience segmentation techniques.
- The challenge of unstructured data interpretation is being addressed with AI, while bot detection in social media ensures data integrity. Omnichannel customer journey mapping is enhanced by visual content analysis tools and predictive customer behavior modeling, which improves forecasting accuracy by over 20%.
- Key performance indicators include social campaign performance metrics displayed on a brand health monitoring dashboard, enabling swift social media crisis detection. Firms leverage real-time trend spotting for content strategy optimization and to conduct share of voice analysis. Effective customer feedback aggregation supports social selling analytics and aids in market gap identification.
- The demand for multilingual sentiment analysis and emotional analysis of text is rising, strengthening campaign attribution modeling and user demographic analysis. Furthermore, geolocational data analysis, network analysis of communities, and topic modeling from conversations support product launch monitoring, ensure social media compliance tracking, and facilitate public opinion tracking.
We can help! Our analysts can customize this social media analytics market research report to meet your requirements.
 RIA -
RIA - 
