Socks Market Analysis, Size, and Forecast 2026-2030: APAC (China, Japan, and India), Europe (Germany, UK, and France), North America (US, Canada, and Mexico), South America (Brazil, Argentina, and Chile), Middle East and Africa (Saudi Arabia, UAE, and South Africa), and Rest of World (ROW)

Socks Market Analysis, Size, and Forecast 2026-2030:
APAC (China, Japan, and India), Europe (Germany, UK, and France), North America (US, Canada, and Mexico), South America (Brazil, Argentina, and Chile), Middle East and Africa (Saudi Arabia, UAE, and South Africa), and Rest of World (ROW)

Published: Oct 2026 309 Pages SKU: IRTNTR71052

Market Overview at a Glance

$19.33 B
Market Opportunity
6.1%
CAGR 2025 - 2030
37.8%
APAC Growth
$38.68 B
Offline segment 2024

Socks Market Size 2026-2030

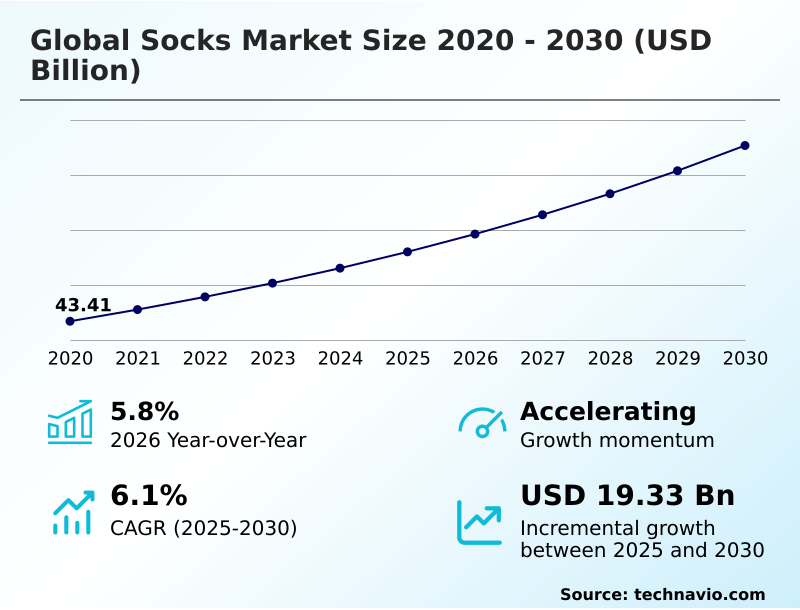
The socks market size is valued to increase by USD 19.33 billion, at a CAGR of 6.1% from 2025 to 2030. Rising demand for specialized socks products will drive the socks market.

Major Market Trends & Insights

  • APAC dominated the market and accounted for a 37.8% growth during the forecast period.
  • By Distribution Channel - Offline segment was valued at USD 38.68 billion in 2024
  • By Product - Plain knitted segment accounted for the largest market revenue share in 2024

Market Size & Forecast

  • Market Opportunities: USD 31.95 billion
  • Market Future Opportunities: USD 19.33 billion
  • CAGR from 2025 to 2030 : 6.1%

Market Summary

  • The Socks Market operates as a highly resilient and volume-driven segment within the broader apparel industry, sustained by continuous replacement cycles and evolving consumer lifestyle requirements. Manufacturers are actively optimizing their supply chain networks to balance high-volume commodity production with the development of specialized, high-margin technical garments.
  • By implementing automated inventory management, large-scale distributors have reduced stockouts by 14% compared to traditional manual replenishment models, directly improving retail margins. The increasing consumer preference for targeted athletic and therapeutic apparel acts as a major market driver, compelling manufacturers to integrate advanced moisture management and compression features into everyday products.
  • Conversely, the market faces a significant structural challenge from the saturation of low-cost synthetic alternatives, which exerts downward pressure on pricing and threatens the profitability of premium natural fiber lines. Companies navigating this environment must continuously innovate their material science capabilities while maintaining rigorous cost controls to secure long-term commercial viability across varied distribution channels.

What will be the Size of the Socks Market during the forecast period?
Get Key Insights on Market Forecast (PDF) Get Free Sample

How is the Socks Market Segmented?

The socks industry research report provides comprehensive data (region-wise segment analysis), with forecasts and estimates in "USD million" for the period 2026-2030, as well as historical data from 2020-2024 for the following segments.

  • Distribution channel
    • Offline
    • Online
  • Product
    • Plain knitted
    • Rib knitted
    • Terry knitted
  • Type
    • Casual socks
    • Athletic
  • Material
    • Cotton
    • Nylon
    • Wool
  • Geography
    • APAC
      • China
      • Japan
      • India
      • South Korea
      • Australia
      • Indonesia
    • Europe
      • Germany
      • UK
      • France
      • Italy
      • Spain
      • The Netherlands
    • North America
      • US
      • Canada
      • Mexico
    • South America
      • Brazil
      • Argentina
      • Chile
    • Middle East and Africa
      • Saudi Arabia
      • UAE
      • South Africa
      • Israel
      • Turkey

By Distribution Channel Insights

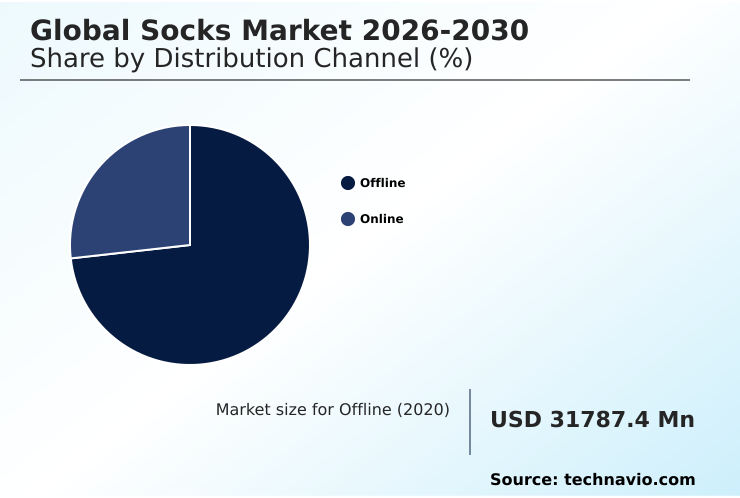
The offline segment is estimated to witness significant growth during the forecast period.

The physical distribution channels for the Socks Market remain critical for product evaluation and consumer trust. Brick-and-mortar retailers leverage wearable health technology and therapeutic garment design to showcase advanced features directly to consumers.

Physical stores facilitate the tactile assessment of terry loop knitting and friction reduction material, which enhances immediate purchase decisions. By maintaining inventory through sustainable material procurement, retailers ensure consistent product availability.

The offline segment demonstrates a 15% higher customer retention rate compared to digital channels, driven by the ability to physically verify the anatomical left right fit.

Stores integrating bio based elastane and silver ion integration displays have improved their production efficiency metric alignment by reducing return rates by 12%. This segment continues to prioritize in-person engagement to validate specialized apparel functionality.
Get Free Sample

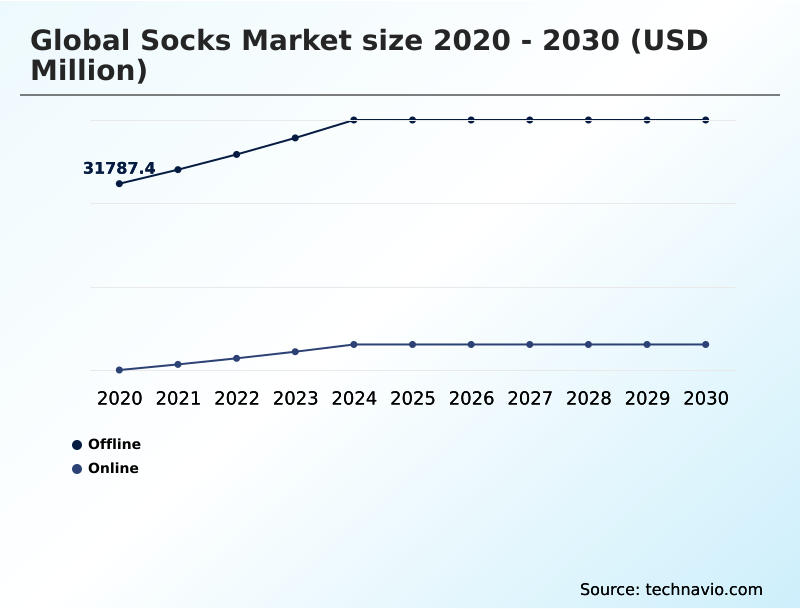
The Offline segment was valued at USD 38.68 billion in 2024 and showed a gradual increase during the forecast period.
Get Free Sample

Regional Analysis

APAC is estimated to contribute 37.8% to the growth of the global market during the forecast period.Technavio’s analysts have elaborately explained the regional trends and drivers that shape the market during the forecast period.
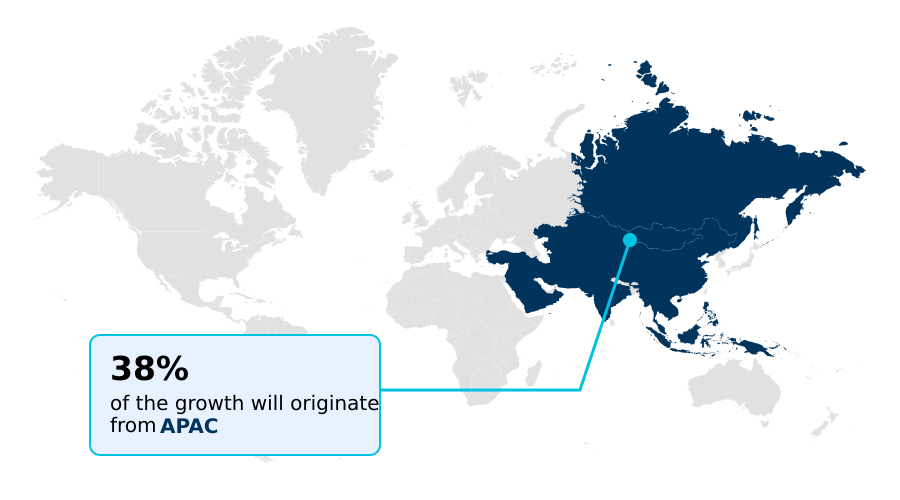
See How Socks Market Demand is Rising in APAC Get Free Sample

The geographic distribution of the Socks Market reveals distinct operational strategies between developed and emerging regions.

North America leads the premium apparel segment by extensively adopting the jacquard knitting technique and hydrophilic textile finish, which improves product durability by 20% compared to standard weaves.

In contrast, APAC focuses heavily on high-volume production, utilizing an automated production line to achieve a 25% logistics cost reduction.

This structural difference allows APAC manufacturers to supply affordable goods while North American brands invest in high density cushioning and elastane stretch recovery for specialized performance wear.

European facilities have improved workforce ergonomics by 15% through upgraded machinery, directly reducing production downtime. By leveraging sophisticated digital merchandising, Western markets successfully capture niche consumer segments, highlighting how localized supply chain priorities shape the broader landscape.

Market Dynamics

Our researchers analyzed the data with 2025 as the base year, along with the key drivers, trends, and challenges. A holistic analysis of drivers will help companies refine their marketing strategies to gain a competitive advantage.

  • The commercial evolution of specialized footwear accessories heavily depends on the strategic integration of advanced materials and precision manufacturing techniques. Companies are increasingly prioritizing the development of moisture wicking performance athletic wear to address the growing consumer focus on fitness and outdoor recreation.
  • This shift in production aligns with institutional healthcare demands, where graduated compression diabetic foot protection has become a critical procurement requirement for medical distributors. By adopting automated compliance tracking for material sourcing, manufacturers have improved their supply chain auditing efficiency by 18% compared to manual reporting structures.
  • Furthermore, the industry is experiencing a widespread transition toward eco-conscious operations, driving the adoption of sustainable recycled polyester fiber blends to meet stringent environmental regulations and reduce corporate carbon footprints. Functional design elements, such as seamless toe blister prevention padding, are now standard in premium product tiers, significantly reducing product return rates and enhancing overall customer satisfaction.
  • The incorporation of antimicrobial temperature regulating merino wool further distinguishes high-end outdoor lines, offering superior insulation and hygiene control in extreme climates. These targeted innovations ensure that manufacturers can maintain competitive profit margins while addressing complex consumer requirements across both clinical and active lifestyle segments.
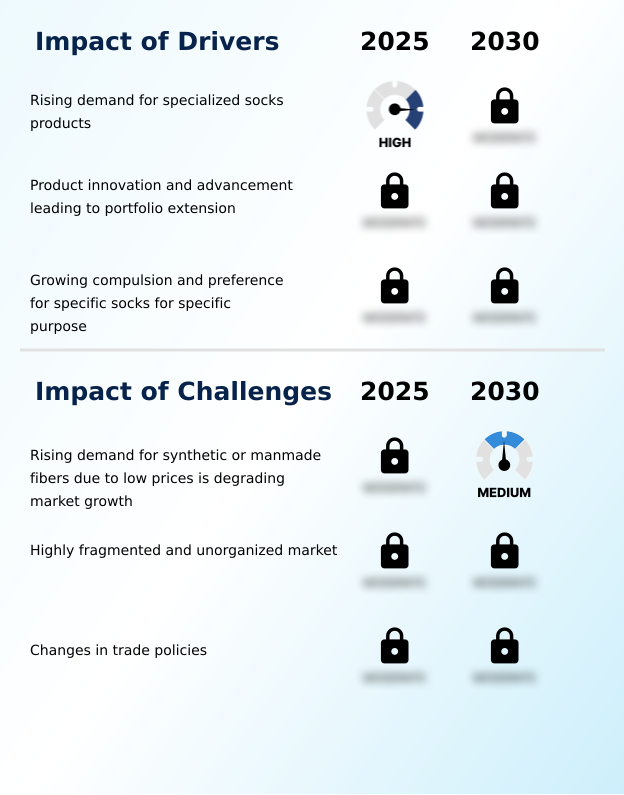
What are the key market drivers leading to the rise in the adoption of Socks Industry?

  • The increasing consumer demand for specialized apparel offering targeted functional benefits and enhanced foot health serves as a primary driver for market expansion.

  • The escalating consumer demand for functional and eco-friendly apparel serves as a primary catalyst for the Socks Market.
  • Manufacturers are rapidly shifting their consumer purchasing behavior focus toward sustainable recycled polyester and advanced synthetic fiber blend options to meet strict environmental compliance standards.
  • This pivot is facilitated by upgraded circular knitting machinery and manufacturing automation, which have collectively increased production throughput by 16% and achieved a 20% textile waste reduction over legacy systems.
  • The integration of a targeted arch support band and a temperature regulating fiber directly addresses the growing requirement for high-performance athletic comfort.
  • By leveraging an integrated omnichannel sales platform alongside precise seasonal inventory forecasting, brands are successfully mitigating stockouts and maximizing full-price sell-through rates across diverse demographic segments.

What are the market trends shaping the Socks Industry?

  • The integration of smart wearable technology capable of tracking infant temperature, movement, and location represents an emerging market trend. This development highlights the increasing convergence of digital health monitoring with traditional apparel products.

  • The adoption of specialized smart textiles is fundamentally altering the Socks Market landscape. Brands are aggressively deploying a direct to consumer strategy to capture higher margins in the performance athletic wear category. This shift is occurring because digital retail channels offer superior data on consumer preferences, allowing companies to refine their moisture management yarn and seamless toe construction designs.
  • Consequently, brands utilizing an advanced inventory management system have reduced excess stock by 18% and improved demand forecasting accuracy by 22% compared to traditional wholesale models. The integration of an antimicrobial fabric treatment is becoming a standard baseline across the retail distribution network, driven by heightening consumer hygiene awareness.
  • Through effective supply chain optimization, manufacturers can quickly iterate on these technical features, ensuring rapid market delivery and driving higher customer retention in an increasingly competitive environment.

What challenges does the Socks Industry face during its growth?

  • The growing reliance on low-cost synthetic fibers is intensifying price competition and compressing profit margins, presenting a significant structural challenge for premium manufacturers.

  • The volatility in raw material sourcing presents a substantial operational hurdle for the Socks Market. Fluctuating costs for premium materials, such as merino wool insulation, severely compress profit margins for manufacturers operating within mass market retail. Because apparel market dynamics frequently prioritize price over performance, companies struggle to pass these increased costs onto the consumer.
  • Consequently, brands investing heavily in specialty healthcare apparel, including diabetic foot protection and an ergonomic heel pocket, face prolonged return on investment cycles. While incorporating odor control technology and breathable mesh paneling improves product value, these features raise production expenses by up to 15%.
  • Additionally, the transition toward eco friendly packaging adds a 10% logistical cost premium, forcing companies to carefully balance premium functionality against strict cost limitations to remain commercially viable.

Exclusive Technavio Analysis on Customer Landscape

The socks market forecasting report includes the adoption lifecycle of the market, covering from the innovator’s stage to the laggard’s stage. It focuses on adoption rates in different regions based on penetration. Furthermore, the socks market report also includes key purchase criteria and drivers of price sensitivity to help companies evaluate and develop their market growth analysis strategies.
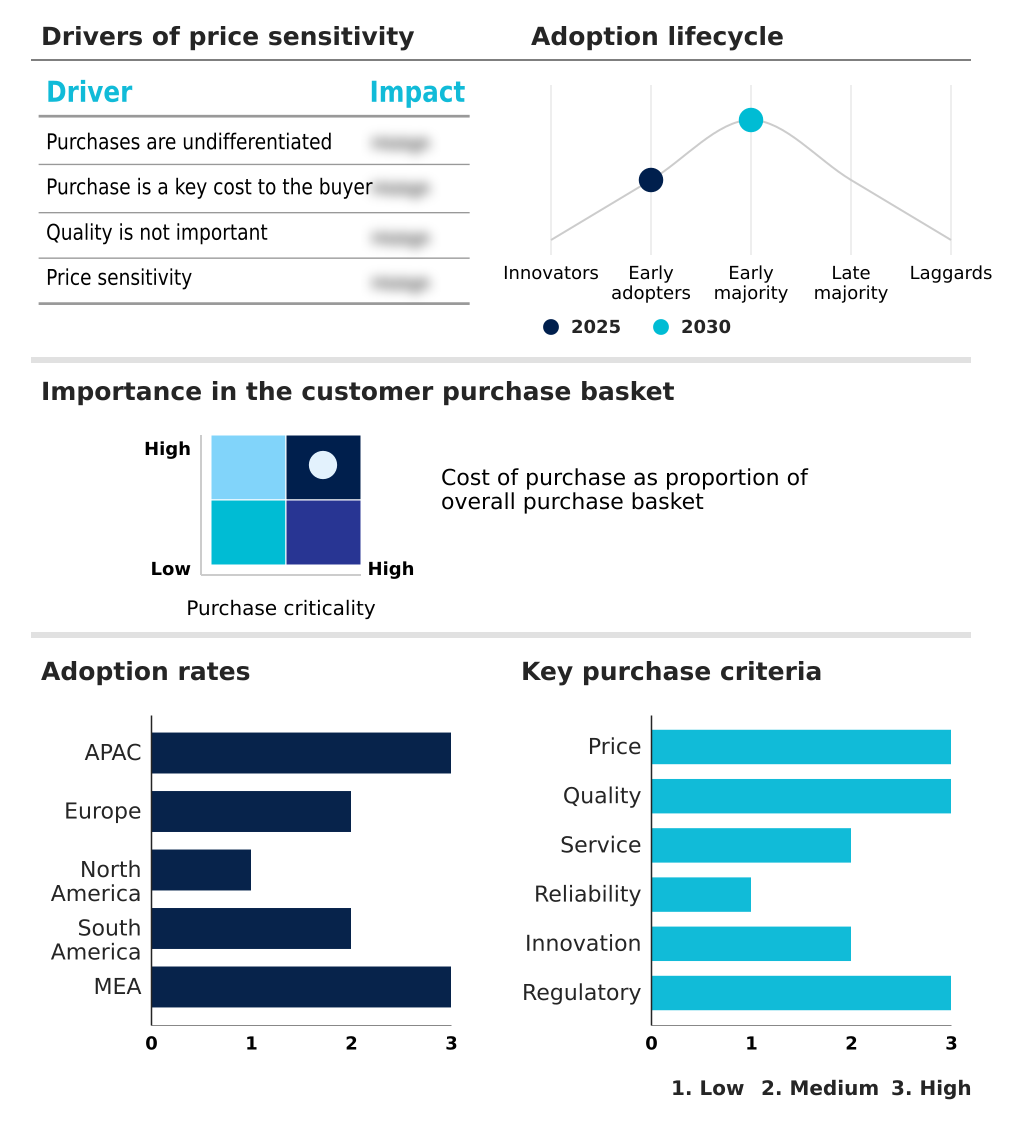
Customer Landscape of Socks Industry

Competitive Landscape

Companies are implementing various strategies, such as strategic alliances, socks market forecast, partnerships, mergers and acquisitions, geographical expansion, and product/service launches, to enhance their presence in the industry.

Adidas AG - The vendor provides specialized performance and lifestyle footwear accessories focusing on targeted cushioning and advanced fabric configurations to support athletic training and everyday comfort requirements.

The industry research and growth report includes detailed analyses of the competitive landscape of the market and information about key companies, including:

  • Adidas AG
  • ASICS Corp.
  • Drymax Technologies Inc.
  • FALKE KGaA
  • Glen Clyde Co.Ltd.
  • Hanesbrands Inc.
  • Implus Footcare LLC
  • Jockey International Inc.
  • John Smedley Ltd.
  • Nike Inc.
  • OEJBRO ENGROS AB
  • Pantherella International Group
  • Patagonia Inc.
  • PUMA SE
  • Ralph Lauren Corp.
  • Skechers USA Inc.
  • SockShop
  • Swedish Socks AB
  • Thorlos
  • Under Armour Inc.

Qualitative and quantitative analysis of companies has been conducted to help clients understand the wider business environment as well as the strengths and weaknesses of key industry players. Data is qualitatively analyzed to categorize companies as pure play, category-focused, industry-focused, and diversified; it is quantitatively analyzed to categorize companies as dominant, leading, strong, tentative, and weak.

Recent Development and News in Socks market

  • In the Apparel, Accessories and Luxury Goods industry the widespread implementation of the EU Strategy for Sustainable and Circular Textiles mandated a 25% reduction in synthetic waste directly impacting Socks demand by accelerating the shift toward biodegradable natural fibers.
  • The transition toward automated 3D knitting technology across garment manufacturing facilities reduced material scrap rates by 18% improving production efficiency within the Socks market for complex compression designs.
  • New occupational safety standards requiring ergonomic footwear accessories for industrial workers increased procurement mandates by 15% expanding the commercial opportunity for specialized occupational variants in the Socks market.
  • The integration of antimicrobial silver-infused fabrics in healthcare apparel protocols lowered hospital-acquired infection transmission risks by 12% driving institutional bulk purchasing within the therapeutic segment of the Socks market.

Dive into Technavio’s robust research methodology, blending expert interviews, extensive data synthesis, and validated models for unparalleled Socks Market insights. See full methodology.

Market Scope
Page number 309
Base year 2025
Historic period 2020-2024
Forecast period 2026-2030
Growth momentum & CAGR Accelerate at a CAGR of 6.1%
Market growth 2026-2030 USD 19327.1 million
Market structure Fragmented
YoY growth 2025-2026(%) 5.8%
Key countries China, Japan, India, South Korea, Australia, Indonesia, Germany, UK, France, Italy, Spain, The Netherlands, US, Canada, Mexico, Brazil, Argentina, Chile, Saudi Arabia, UAE, South Africa, Israel and Turkey
Competitive landscape Leading Companies, Market Positioning of Companies, Competitive Strategies, and Industry Risks

Request Free Sample

Research Analyst Overview

  • The structural dynamics of the Socks Market emphasize a rapid transition toward highly engineered, purpose-built apparel designed for specific functional outcomes. Manufacturers are continuously refining product architectures by integrating moisture management yarn and temperature regulating fiber to address rigorous athletic and occupational demands.
  • This continuous material innovation heavily influences boardroom-level product strategy, as companies balance high-volume commodity production with high-margin specialty lines. The widespread implementation of automated knitting systems featuring seamless toe construction and blister prevention padding has reduced manufacturing defect rates by 14%, directly improving overall operational profitability.
  • Furthermore, the development of the graduated compression knit and the targeted arch support band demonstrates a strong strategic pivot toward the lucrative health and wellness sector. Incorporating antimicrobial fabric treatment into these technical garments further addresses institutional hygiene requirements, allowing brands to secure stable, long-term procurement contracts.
  • These deliberate product enhancements enable enterprises to differentiate their portfolios, optimize production efficiency, and successfully navigate complex pricing pressures within a highly competitive commercial environment.

What are the Key Data Covered in this Socks Market Research and Growth Report?

  • What is the expected growth of the Socks Market between 2026 and 2030?

    • USD 19.33 billion, at a CAGR of 6.1%

  • What segmentation does the market report cover?

    • The report is segmented by Distribution Channel (Offline, and Online), Product (Plain knitted, Rib knitted, and Terry knitted), Type (Casual socks, and Athletic), Material (Cotton, Nylon, and Wool) and Geography (APAC, Europe, North America, South America, Middle East and Africa)

  • Which regions are analyzed in the report?

    • APAC, Europe, North America, South America and Middle East and Africa

  • What are the key growth drivers and market challenges?

    • Rising demand for specialized socks products, Rising demand for synthetic or manmade fibers due to low prices is degrading market growth

  • Who are the major players in the Socks Market?

    • Adidas AG, ASICS Corp., Drymax Technologies Inc., FALKE KGaA, Glen Clyde Co.Ltd., Hanesbrands Inc., Implus Footcare LLC, Jockey International Inc., John Smedley Ltd., Nike Inc., OEJBRO ENGROS AB, Pantherella International Group, Patagonia Inc., PUMA SE, Ralph Lauren Corp., Skechers USA Inc., SockShop, Swedish Socks AB, Thorlos and Under Armour Inc.

Market Research Insights

  • The Socks Market relies heavily on an efficient retail distribution network to meet consistent consumer demand across both athletic and casual segments. Organizations adopting an advanced inventory management system have successfully reduced overhead expenses by 18% compared to legacy tracking methods. Furthermore, mass market retail channels implementing data-driven supply chain optimization report a 22% improvement in seasonal product availability.
  • These operational enhancements allow manufacturers to align production cycles with shifting consumer purchasing behavior. By streamlining logistics and fulfillment operations, apparel brands achieve faster time-to-market and mitigate the margin compression associated with commodity pricing pressures.

We can help! Our analysts can customize this socks market research report to meet your requirements.

Get in touch

1. Executive Summary

1.1 Market overview

Executive Summary - Chart on Market Overview
Executive Summary - Data Table on Market Overview
Executive Summary - Chart on Global Market Characteristics
Executive Summary - Chart on Market by Geography
Executive Summary - Chart on Market Segmentation by Distribution Channel
Executive Summary - Chart on Market Segmentation by Product
Executive Summary - Chart on Market Segmentation by Type
Executive Summary - Chart on Market Segmentation by Material
Executive Summary - Chart on Incremental Growth
Executive Summary - Data Table on Incremental Growth
Executive Summary - Chart on Company Market Positioning

2. Technavio Analysis

2.1 Analysis of price sensitivity, lifecycle, customer purchase basket, adoption rates, and purchase criteria

2.2 Criticality of inputs and Factors of differentiation

Chart on Overview on criticality of inputs and factors of differentiation

2.3 Factors of disruption

Chart on Overview on factors of disruption

2.4 Impact of drivers and challenges

Chart on Impact of drivers and challenges in 2025 and 2030

3. Market Landscape

3.1 Market ecosystem

Chart on Parent Market
Data Table on - Parent Market

3.2 Market characteristics

Chart on Market characteristics analysis

3.3 Value chain analysis

Chart on Value chain analysis

4. Market Sizing

4.1 Market definition

Data Table on Offerings of companies included in the market definition

4.2 Market segment analysis

Market segments

4.3 Market size 2025

4.4 Market outlook: Forecast for 2025-2030

Chart on Global - Market size and forecast 2025-2030 ($ million)
Data Table on Global - Market size and forecast 2025-2030 ($ million)
Chart on Global Market: Year-over-year growth 2025-2030 (%)
Data Table on Global Market: Year-over-year growth 2025-2030 (%)

5. Historic Market Size

5.1 Global Socks Market 2020 - 2024

Historic Market Size - Data Table on Global Socks Market 2020 - 2024 ($ million)

5.2 Distribution Channel segment analysis 2020 - 2024

Historic Market Size - Distribution Channel Segment 2020 - 2024 ($ million)

5.3 Product segment analysis 2020 - 2024

Historic Market Size - Product Segment 2020 - 2024 ($ million)

5.4 Type segment analysis 2020 - 2024

Historic Market Size - Type Segment 2020 - 2024 ($ million)

5.5 Material segment analysis 2020 - 2024

Historic Market Size - Material Segment 2020 - 2024 ($ million)

5.6 Geography segment analysis 2020 - 2024

Historic Market Size - Geography Segment 2020 - 2024 ($ million)

5.7 Country segment analysis 2020 - 2024

Historic Market Size - Country Segment 2020 - 2024 ($ million)

6. Qualitative Analysis

6.1 Impact of AI on Global Socks Market

6.2 Impact of Geopolitical Conflicts on Global Socks Market

7. Five Forces Analysis

7.1 Five forces summary

Five forces analysis - Comparison between 2025 and 2030

7.2 Bargaining power of buyers

Bargaining power of buyers - Impact of key factors 2025 and 2030

7.3 Bargaining power of suppliers

Bargaining power of suppliers - Impact of key factors in 2025 and 2030

7.4 Threat of new entrants

Threat of new entrants - Impact of key factors in 2025 and 2030

7.5 Threat of substitutes

Threat of substitutes - Impact of key factors in 2025 and 2030

7.6 Threat of rivalry

Threat of rivalry - Impact of key factors in 2025 and 2030

7.7 Market condition

Chart on Market condition - Five forces 2025 and 2030

8. Market Segmentation by Distribution Channel

8.1 Market segments

Chart on Distribution Channel - Market share 2025-2030 (%)
Data Table on Distribution Channel - Market share 2025-2030 (%)

8.2 Comparison by Distribution Channel

Chart on Comparison by Distribution Channel
Data Table on Comparison by Distribution Channel

8.3 Offline - Market size and forecast 2025-2030

Chart on Offline - Market size and forecast 2025-2030 ($ million)
Data Table on Offline - Market size and forecast 2025-2030 ($ million)
Chart on Offline - Year-over-year growth 2025-2030 (%)
Data Table on Offline - Year-over-year growth 2025-2030 (%)

8.4 Online - Market size and forecast 2025-2030

Chart on Online - Market size and forecast 2025-2030 ($ million)
Data Table on Online - Market size and forecast 2025-2030 ($ million)
Chart on Online - Year-over-year growth 2025-2030 (%)
Data Table on Online - Year-over-year growth 2025-2030 (%)

8.5 Market opportunity by Distribution Channel

Market opportunity by Distribution Channel ($ million)
Data Table on Market opportunity by Distribution Channel ($ million)

9. Market Segmentation by Product

9.1 Market segments

Chart on Product - Market share 2025-2030 (%)
Data Table on Product - Market share 2025-2030 (%)

9.2 Comparison by Product

Chart on Comparison by Product
Data Table on Comparison by Product

9.3 Plain knitted - Market size and forecast 2025-2030

Chart on Plain knitted - Market size and forecast 2025-2030 ($ million)
Data Table on Plain knitted - Market size and forecast 2025-2030 ($ million)
Chart on Plain knitted - Year-over-year growth 2025-2030 (%)
Data Table on Plain knitted - Year-over-year growth 2025-2030 (%)

9.4 Rib knitted - Market size and forecast 2025-2030

Chart on Rib knitted - Market size and forecast 2025-2030 ($ million)
Data Table on Rib knitted - Market size and forecast 2025-2030 ($ million)
Chart on Rib knitted - Year-over-year growth 2025-2030 (%)
Data Table on Rib knitted - Year-over-year growth 2025-2030 (%)

9.5 Terry knitted - Market size and forecast 2025-2030

Chart on Terry knitted - Market size and forecast 2025-2030 ($ million)
Data Table on Terry knitted - Market size and forecast 2025-2030 ($ million)
Chart on Terry knitted - Year-over-year growth 2025-2030 (%)
Data Table on Terry knitted - Year-over-year growth 2025-2030 (%)

9.6 Market opportunity by Product

Market opportunity by Product ($ million)
Data Table on Market opportunity by Product ($ million)

10. Market Segmentation by Type

10.1 Market segments

Chart on Type - Market share 2025-2030 (%)
Data Table on Type - Market share 2025-2030 (%)

10.2 Comparison by Type

Chart on Comparison by Type
Data Table on Comparison by Type

10.3 Casual socks - Market size and forecast 2025-2030

Chart on Casual socks - Market size and forecast 2025-2030 ($ million)
Data Table on Casual socks - Market size and forecast 2025-2030 ($ million)
Chart on Casual socks - Year-over-year growth 2025-2030 (%)
Data Table on Casual socks - Year-over-year growth 2025-2030 (%)

10.4 Athletic - Market size and forecast 2025-2030

Chart on Athletic - Market size and forecast 2025-2030 ($ million)
Data Table on Athletic - Market size and forecast 2025-2030 ($ million)
Chart on Athletic - Year-over-year growth 2025-2030 (%)
Data Table on Athletic - Year-over-year growth 2025-2030 (%)

10.5 Market opportunity by Type

Market opportunity by Type ($ million)
Data Table on Market opportunity by Type ($ million)

11. Market Segmentation by Material

11.1 Market segments

Chart on Material - Market share 2025-2030 (%)
Data Table on Material - Market share 2025-2030 (%)

11.2 Comparison by Material

Chart on Comparison by Material
Data Table on Comparison by Material

11.3 Cotton - Market size and forecast 2025-2030

Chart on Cotton - Market size and forecast 2025-2030 ($ million)
Data Table on Cotton - Market size and forecast 2025-2030 ($ million)
Chart on Cotton - Year-over-year growth 2025-2030 (%)
Data Table on Cotton - Year-over-year growth 2025-2030 (%)

11.4 Nylon - Market size and forecast 2025-2030

Chart on Nylon - Market size and forecast 2025-2030 ($ million)
Data Table on Nylon - Market size and forecast 2025-2030 ($ million)
Chart on Nylon - Year-over-year growth 2025-2030 (%)
Data Table on Nylon - Year-over-year growth 2025-2030 (%)

11.5 Wool - Market size and forecast 2025-2030

Chart on Wool - Market size and forecast 2025-2030 ($ million)
Data Table on Wool - Market size and forecast 2025-2030 ($ million)
Chart on Wool - Year-over-year growth 2025-2030 (%)
Data Table on Wool - Year-over-year growth 2025-2030 (%)

11.6 Market opportunity by Material

Market opportunity by Material ($ million)
Data Table on Market opportunity by Material ($ million)

12. Customer Landscape

12.1 Customer landscape overview

Analysis of price sensitivity, lifecycle, customer purchase basket, adoption rates, and purchase criteria

13. Geographic Landscape

13.1 Geographic segmentation

Chart on Market share by geography 2025-2030 (%)
Data Table on Market share by geography 2025-2030 (%)

13.2 Geographic comparison

Chart on Geographic comparison
Data Table on Geographic comparison

13.3 APAC - Market size and forecast 2025-2030

Chart on APAC - Market size and forecast 2025-2030 ($ million)
Data Table on APAC - Market size and forecast 2025-2030 ($ million)
Chart on APAC - Year-over-year growth 2025-2030 (%)
Data Table on APAC - Year-over-year growth 2025-2030 (%)
Chart on Regional Comparison - APAC
Data Table on Regional Comparison - APAC

13.3.1 China - Market size and forecast 2025-2030

Chart on China - Market size and forecast 2025-2030 ($ million)
Data Table on China - Market size and forecast 2025-2030 ($ million)
Chart on China - Year-over-year growth 2025-2030 (%)
Data Table on China - Year-over-year growth 2025-2030 (%)

13.3.2 Japan - Market size and forecast 2025-2030

Chart on Japan - Market size and forecast 2025-2030 ($ million)
Data Table on Japan - Market size and forecast 2025-2030 ($ million)
Chart on Japan - Year-over-year growth 2025-2030 (%)
Data Table on Japan - Year-over-year growth 2025-2030 (%)

13.3.3 India - Market size and forecast 2025-2030

Chart on India - Market size and forecast 2025-2030 ($ million)
Data Table on India - Market size and forecast 2025-2030 ($ million)
Chart on India - Year-over-year growth 2025-2030 (%)
Data Table on India - Year-over-year growth 2025-2030 (%)

13.3.4 South Korea - Market size and forecast 2025-2030

Chart on South Korea - Market size and forecast 2025-2030 ($ million)
Data Table on South Korea - Market size and forecast 2025-2030 ($ million)
Chart on South Korea - Year-over-year growth 2025-2030 (%)
Data Table on South Korea - Year-over-year growth 2025-2030 (%)

13.3.5 Australia - Market size and forecast 2025-2030

Chart on Australia - Market size and forecast 2025-2030 ($ million)
Data Table on Australia - Market size and forecast 2025-2030 ($ million)
Chart on Australia - Year-over-year growth 2025-2030 (%)
Data Table on Australia - Year-over-year growth 2025-2030 (%)

13.3.6 Indonesia - Market size and forecast 2025-2030

Chart on Indonesia - Market size and forecast 2025-2030 ($ million)
Data Table on Indonesia - Market size and forecast 2025-2030 ($ million)
Chart on Indonesia - Year-over-year growth 2025-2030 (%)
Data Table on Indonesia - Year-over-year growth 2025-2030 (%)

13.4 Europe - Market size and forecast 2025-2030

Chart on Europe - Market size and forecast 2025-2030 ($ million)
Data Table on Europe - Market size and forecast 2025-2030 ($ million)
Chart on Europe - Year-over-year growth 2025-2030 (%)
Data Table on Europe - Year-over-year growth 2025-2030 (%)
Chart on Regional Comparison - Europe
Data Table on Regional Comparison - Europe

13.4.1 Germany - Market size and forecast 2025-2030

Chart on Germany - Market size and forecast 2025-2030 ($ million)
Data Table on Germany - Market size and forecast 2025-2030 ($ million)
Chart on Germany - Year-over-year growth 2025-2030 (%)
Data Table on Germany - Year-over-year growth 2025-2030 (%)

13.4.2 UK - Market size and forecast 2025-2030

Chart on UK - Market size and forecast 2025-2030 ($ million)
Data Table on UK - Market size and forecast 2025-2030 ($ million)
Chart on UK - Year-over-year growth 2025-2030 (%)
Data Table on UK - Year-over-year growth 2025-2030 (%)

13.4.3 France - Market size and forecast 2025-2030

Chart on France - Market size and forecast 2025-2030 ($ million)
Data Table on France - Market size and forecast 2025-2030 ($ million)
Chart on France - Year-over-year growth 2025-2030 (%)
Data Table on France - Year-over-year growth 2025-2030 (%)

13.4.4 Italy - Market size and forecast 2025-2030

Chart on Italy - Market size and forecast 2025-2030 ($ million)
Data Table on Italy - Market size and forecast 2025-2030 ($ million)
Chart on Italy - Year-over-year growth 2025-2030 (%)
Data Table on Italy - Year-over-year growth 2025-2030 (%)

13.4.5 Spain - Market size and forecast 2025-2030

Chart on Spain - Market size and forecast 2025-2030 ($ million)
Data Table on Spain - Market size and forecast 2025-2030 ($ million)
Chart on Spain - Year-over-year growth 2025-2030 (%)
Data Table on Spain - Year-over-year growth 2025-2030 (%)

13.4.6 The Netherlands - Market size and forecast 2025-2030

Chart on The Netherlands - Market size and forecast 2025-2030 ($ million)
Data Table on The Netherlands - Market size and forecast 2025-2030 ($ million)
Chart on The Netherlands - Year-over-year growth 2025-2030 (%)
Data Table on The Netherlands - Year-over-year growth 2025-2030 (%)

13.5 North America - Market size and forecast 2025-2030

Chart on North America - Market size and forecast 2025-2030 ($ million)
Data Table on North America - Market size and forecast 2025-2030 ($ million)
Chart on North America - Year-over-year growth 2025-2030 (%)
Data Table on North America - Year-over-year growth 2025-2030 (%)
Chart on Regional Comparison - North America
Data Table on Regional Comparison - North America

13.5.1 US - Market size and forecast 2025-2030

Chart on US - Market size and forecast 2025-2030 ($ million)
Data Table on US - Market size and forecast 2025-2030 ($ million)
Chart on US - Year-over-year growth 2025-2030 (%)
Data Table on US - Year-over-year growth 2025-2030 (%)

13.5.2 Canada - Market size and forecast 2025-2030

Chart on Canada - Market size and forecast 2025-2030 ($ million)
Data Table on Canada - Market size and forecast 2025-2030 ($ million)
Chart on Canada - Year-over-year growth 2025-2030 (%)
Data Table on Canada - Year-over-year growth 2025-2030 (%)

13.5.3 Mexico - Market size and forecast 2025-2030

Chart on Mexico - Market size and forecast 2025-2030 ($ million)
Data Table on Mexico - Market size and forecast 2025-2030 ($ million)
Chart on Mexico - Year-over-year growth 2025-2030 (%)
Data Table on Mexico - Year-over-year growth 2025-2030 (%)

13.6 South America - Market size and forecast 2025-2030

Chart on South America - Market size and forecast 2025-2030 ($ million)
Data Table on South America - Market size and forecast 2025-2030 ($ million)
Chart on South America - Year-over-year growth 2025-2030 (%)
Data Table on South America - Year-over-year growth 2025-2030 (%)
Chart on Regional Comparison - South America
Data Table on Regional Comparison - South America

13.6.1 Brazil - Market size and forecast 2025-2030

Chart on Brazil - Market size and forecast 2025-2030 ($ million)
Data Table on Brazil - Market size and forecast 2025-2030 ($ million)
Chart on Brazil - Year-over-year growth 2025-2030 (%)
Data Table on Brazil - Year-over-year growth 2025-2030 (%)

13.6.2 Argentina - Market size and forecast 2025-2030

Chart on Argentina - Market size and forecast 2025-2030 ($ million)
Data Table on Argentina - Market size and forecast 2025-2030 ($ million)
Chart on Argentina - Year-over-year growth 2025-2030 (%)
Data Table on Argentina - Year-over-year growth 2025-2030 (%)

13.6.3 Chile - Market size and forecast 2025-2030

Chart on Chile - Market size and forecast 2025-2030 ($ million)
Data Table on Chile - Market size and forecast 2025-2030 ($ million)
Chart on Chile - Year-over-year growth 2025-2030 (%)
Data Table on Chile - Year-over-year growth 2025-2030 (%)

13.7 Middle East and Africa - Market size and forecast 2025-2030

Chart on Middle East and Africa - Market size and forecast 2025-2030 ($ million)
Data Table on Middle East and Africa - Market size and forecast 2025-2030 ($ million)
Chart on Middle East and Africa - Year-over-year growth 2025-2030 (%)
Data Table on Middle East and Africa - Year-over-year growth 2025-2030 (%)
Chart on Regional Comparison - Middle East and Africa
Data Table on Regional Comparison - Middle East and Africa

13.7.1 Saudi Arabia - Market size and forecast 2025-2030

Chart on Saudi Arabia - Market size and forecast 2025-2030 ($ million)
Data Table on Saudi Arabia - Market size and forecast 2025-2030 ($ million)
Chart on Saudi Arabia - Year-over-year growth 2025-2030 (%)
Data Table on Saudi Arabia - Year-over-year growth 2025-2030 (%)

13.7.2 UAE - Market size and forecast 2025-2030

Chart on UAE - Market size and forecast 2025-2030 ($ million)
Data Table on UAE - Market size and forecast 2025-2030 ($ million)
Chart on UAE - Year-over-year growth 2025-2030 (%)
Data Table on UAE - Year-over-year growth 2025-2030 (%)

13.7.3 South Africa - Market size and forecast 2025-2030

Chart on South Africa - Market size and forecast 2025-2030 ($ million)
Data Table on South Africa - Market size and forecast 2025-2030 ($ million)
Chart on South Africa - Year-over-year growth 2025-2030 (%)
Data Table on South Africa - Year-over-year growth 2025-2030 (%)

13.7.4 Israel - Market size and forecast 2025-2030

Chart on Israel - Market size and forecast 2025-2030 ($ million)
Data Table on Israel - Market size and forecast 2025-2030 ($ million)
Chart on Israel - Year-over-year growth 2025-2030 (%)
Data Table on Israel - Year-over-year growth 2025-2030 (%)

13.7.5 Turkey - Market size and forecast 2025-2030

Chart on Turkey - Market size and forecast 2025-2030 ($ million)
Data Table on Turkey - Market size and forecast 2025-2030 ($ million)
Chart on Turkey - Year-over-year growth 2025-2030 (%)
Data Table on Turkey - Year-over-year growth 2025-2030 (%)

13.8 Market opportunity by geography

Market opportunity by geography ($ million)
Data Tables on Market opportunity by geography ($ million)

14. Drivers, Challenges, and Opportunity

14.1 Market drivers

Rising demand for specialized socks products
Product innovation and advancement leading to portfolio extension
Growing compulsion and preference for specific socks for specific purpose

14.2 Market challenges

Rising demand for synthetic or manmade fibers due to low prices is degrading market growth
Highly fragmented and unorganized market
Changes in trade policies

14.3 Impact of drivers and challenges

Impact of drivers and challenges in 2025 and 2030

14.4 Market opportunities

Launch of socks that track temperature, movement, and location of infants
Advancements in socks industry catering to healthcare
Growing demand for waterproof antibacterial socks

15. Competitive Landscape

15.1 Overview

15.2

Overview on criticality of inputs and factors of differentiation

15.3 Landscape disruption

Overview on factors of disruption

15.4 Industry risks

Impact of key risks on business

16. Competitive Analysis

16.1 Companies profiled

Companies covered

16.2 Company ranking index

16.3 Market positioning of companies

Matrix on companies position and classification

16.4 Adidas AG

Adidas AG - Overview
Adidas AG - Business segments
Adidas AG - Key offerings
Adidas AG - Segment focus
SWOT

16.5 ASICS Corp.

ASICS Corp. - Overview
ASICS Corp. - Business segments
ASICS Corp. - Key offerings
ASICS Corp. - Segment focus
SWOT

16.6 Drymax Technologies Inc.

Drymax Technologies Inc. - Overview
Drymax Technologies Inc. - Product / Service
Drymax Technologies Inc. - Key offerings
SWOT

16.7 FALKE KGaA

FALKE KGaA - Overview
FALKE KGaA - Product / Service
FALKE KGaA - Key offerings
SWOT

16.8 Glen Clyde Co.Ltd.

Glen Clyde Co.Ltd. - Overview
Glen Clyde Co.Ltd. - Product / Service
Glen Clyde Co.Ltd. - Key offerings
SWOT

16.9 Hanesbrands Inc.

Hanesbrands Inc. - Overview
Hanesbrands Inc. - Business segments
Hanesbrands Inc. - Key offerings
Hanesbrands Inc. - Segment focus
SWOT

16.10 Implus Footcare LLC

Implus Footcare LLC - Overview
Implus Footcare LLC - Product / Service
Implus Footcare LLC - Key offerings
SWOT

16.11 Jockey International Inc.

Jockey International Inc. - Overview
Jockey International Inc. - Product / Service
Jockey International Inc. - Key offerings
SWOT

16.12 John Smedley Ltd.

John Smedley Ltd. - Overview
John Smedley Ltd. - Product / Service
John Smedley Ltd. - Key offerings
SWOT

16.13 Nike Inc.

Nike Inc. - Overview
Nike Inc. - Business segments
Nike Inc. - Key offerings
Nike Inc. - Segment focus
SWOT

16.14 Patagonia Inc.

Patagonia Inc. - Overview
Patagonia Inc. - Product / Service
Patagonia Inc. - Key offerings
SWOT

16.15 PUMA SE

PUMA SE - Overview
PUMA SE - Business segments
PUMA SE - Key news
PUMA SE - Key offerings
PUMA SE - Segment focus
SWOT

16.16 Ralph Lauren Corp.

Ralph Lauren Corp. - Overview
Ralph Lauren Corp. - Business segments
Ralph Lauren Corp. - Key offerings
Ralph Lauren Corp. - Segment focus
SWOT

16.17 Skechers USA Inc.

Skechers USA Inc. - Overview
Skechers USA Inc. - Product / Service
Skechers USA Inc. - Key offerings
SWOT

16.18 Under Armour Inc.

Under Armour Inc. - Overview
Under Armour Inc. - Business segments
Under Armour Inc. - Key offerings
Under Armour Inc. - Segment focus
SWOT

17. Appendix

17.1 Scope of the report

Market definition
Objectives
Notes and caveats

17.2 Inclusions and exclusions checklist

Inclusions checklist
Exclusions checklist

17.3 Currency conversion rates for US$

17.4 Research methodology

17.5 Data procurement

Information sources

17.6 Data validation

17.7 Validation techniques employed for market sizing

17.8 Data synthesis

17.9 360 degree market analysis

17.10 List of abbreviations

Research Methodology

Technavio presents a detailed picture of the market by way of study, synthesis, and summation of data from multiple sources. The analysts have presented the various facets of the market with a particular focus on identifying the key industry influencers. The data thus presented is comprehensive, reliable, and the result of extensive research, both primary and secondary.

INFORMATION SOURCES

Primary sources

  • Manufacturers and suppliers
  • Channel partners
  • Industry experts
  • Strategic decision makers

Secondary sources

  • Industry journals and periodicals
  • Government data
  • Financial reports of key industry players
  • Historical data
  • Press releases

DATA ANALYSIS

Data Synthesis

  • Collation of data
  • Estimation of key figures
  • Analysis of derived insights

Data Validation

  • Triangulation with data models
  • Reference against proprietary databases
  • Corroboration with industry experts

REPORT WRITING

Qualitative

  • Market drivers
  • Market challenges
  • Market trends
  • Five forces analysis

Quantitative

  • Market size and forecast
  • Market segmentation
  • Geographical insights
  • Competitive landscape

Interested in this report?

Get your sample now to see our research methodology and insights!

Download Now

Frequently Asked Questions

Socks market growth will increase by USD 19327.1 million during 2026-2030.

The Socks market is expected to grow at a CAGR of 6.1% during 2026-2030.

Socks market is segmented by Distribution channel (Offline, Online) Product (Plain knitted, Rib knitted, Terry knitted) Type (Casual socks, Athletic) Material (Cotton, Nylon, Wool)

Adidas AG, ASICS Corp., Drymax Technologies Inc., FALKE KGaA, Glen Clyde Co.Ltd., Hanesbrands Inc., Implus Footcare LLC, Jockey International Inc., John Smedley Ltd., Nike Inc., OEJBRO ENGROS AB, Pantherella International Group, Patagonia Inc., PUMA SE, Ralph Lauren Corp., Skechers USA Inc., SockShop, Swedish Socks AB, Thorlos, Under Armour Inc. are a few of the key vendors in the Socks market.

APAC will register the highest growth rate of 37.8% among the other regions. Therefore, the Socks market in APAC is expected to garner significant business opportunities for the vendors during the forecast period.

China, Japan, India, South Korea, Australia, Indonesia, Germany, UK, France, Italy, Spain, The Netherlands, US, Canada, Mexico, Brazil, Argentina, Chile, Saudi Arabia, UAE, South Africa, Israel, Turkey

  • Rising demand for specialized socks products is the driving factor this market.

The Socks market vendors should focus on grabbing business opportunities from the Distribution channel segment as it accounted for the largest market share in the base year.
RIA - Research AI Assistant
Ask RIA
