Sodium Butyrate Market Analysis, Size, and Forecast 2026-2030: APAC (China, Japan, and India), Europe (Germany, UK, and France), North America (US, Canada, and Mexico), South America (Brazil, Argentina, and Colombia), Middle East and Africa (Saudi Arabia, UAE, and South Africa), and Rest of World (ROW)

Sodium Butyrate Market Analysis, Size, and Forecast 2026-2030:
APAC (China, Japan, and India), Europe (Germany, UK, and France), North America (US, Canada, and Mexico), South America (Brazil, Argentina, and Colombia), Middle East and Africa (Saudi Arabia, UAE, and South Africa), and Rest of World (ROW)

Published: Dec 2025 292 Pages SKU: IRTNTR80173

Market Overview at a Glance

$86.9 Mn
Market Opportunity
5.5%
CAGR 2025 - 2030
51.7%
APAC Growth
$160.1 Mn
Powder segment 2024

Sodium Butyrate Market Size 2026-2030

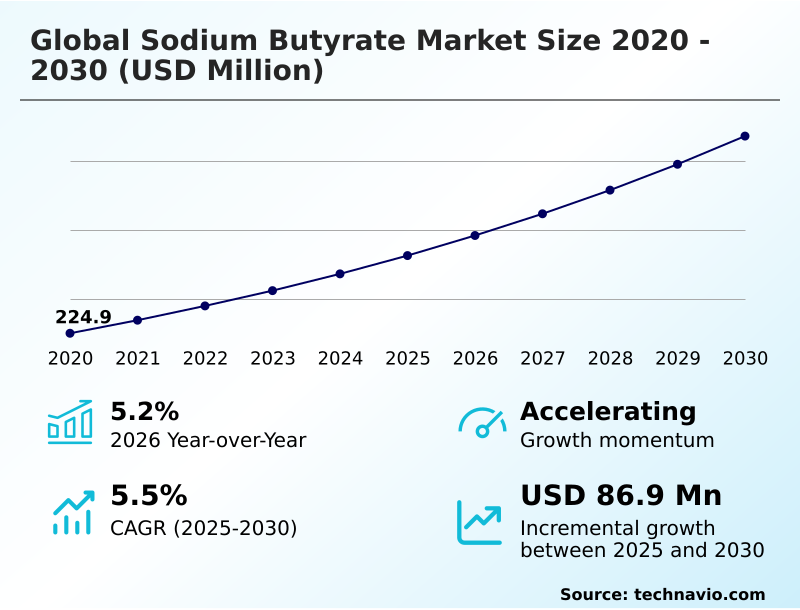
The sodium butyrate market size is valued to increase by USD 86.9 million, at a CAGR of 5.5% from 2025 to 2030. Rise of e-commerce and online health platforms will drive the sodium butyrate market.

Major Market Trends & Insights

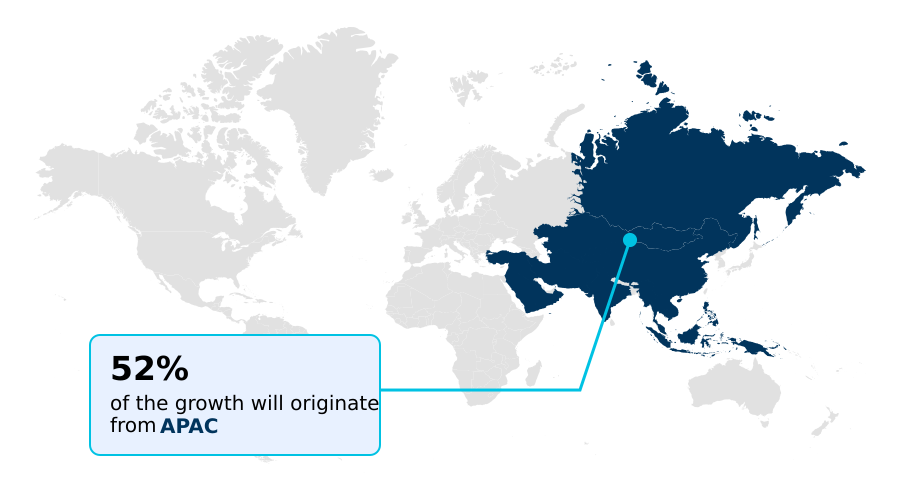
  • APAC dominated the market and accounted for a 51.7% growth during the forecast period.
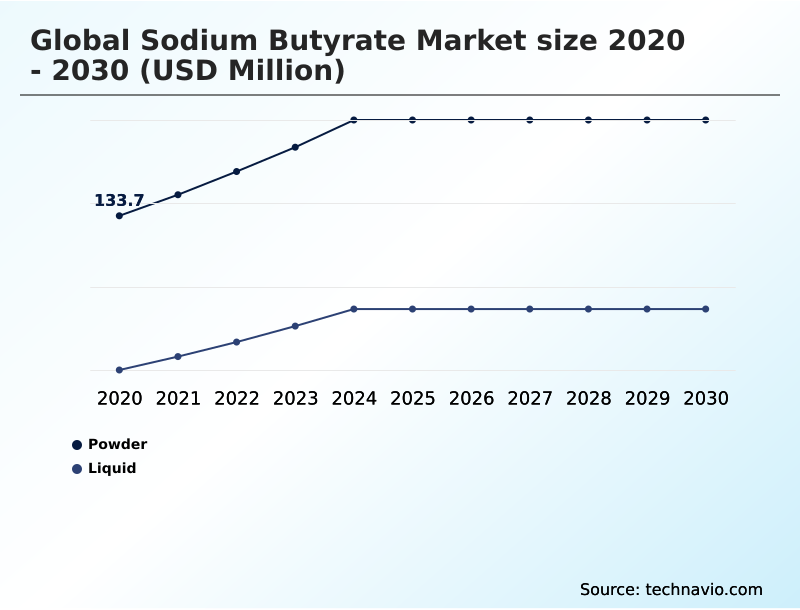
  • By Type - Powder segment was valued at USD 160.1 million in 2024
  • By Application - Animal feed segment accounted for the largest market revenue share in 2024

Market Size & Forecast

  • Market Opportunities: USD 143.4 million
  • Market Future Opportunities: USD 86.9 million
  • CAGR from 2025 to 2030 : 5.5%

Market Summary

What will be the Size of the Sodium Butyrate Market during the forecast period?

Get Key Insights on Market Forecast (PDF) Request Free Sample

How is the Sodium Butyrate Market Segmented?

The sodium butyrate industry research report provides comprehensive data (region-wise segment analysis), with forecasts and estimates in "USD million" for the period 2026-2030, as well as historical data from 2020-2024 for the following segments.

  • Type
    • Powder
    • Liquid
  • Application
    • Animal feed
    • Food and beverages
    • Pharmaceuticals
    • Cosmetics
    • Others
  • Channel
    • Direct sales
    • Indirect sales
  • Geography
    • APAC
      • China
      • Japan
      • India
    • Europe
      • Germany
      • UK
      • France
    • North America
      • US
      • Canada
      • Mexico
    • South America
      • Brazil
      • Argentina
      • Colombia
    • Middle East and Africa
      • Saudi Arabia
      • UAE
      • South Africa
    • Rest of World (ROW)

By Type Insights

The powder segment is estimated to witness significant growth during the forecast period.

Request Free Sample

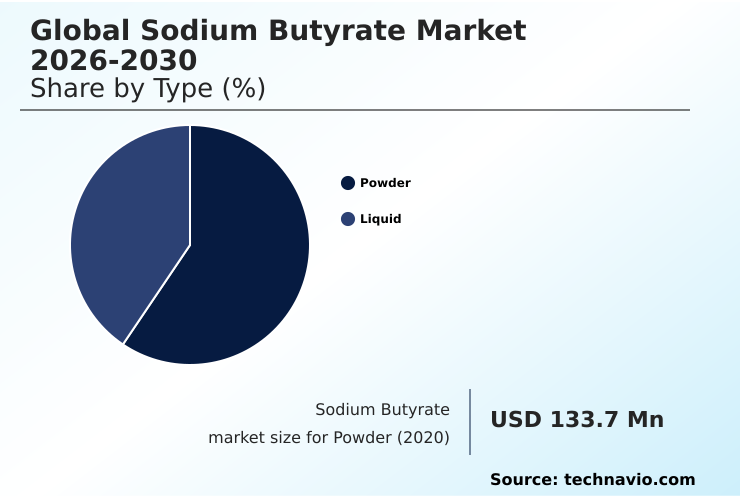
The Powder segment was valued at USD 160.1 million in 2024 and showed a gradual increase during the forecast period.

Request Free Sample

Regional Analysis

APAC is estimated to contribute 51.7% to the growth of the global market during the forecast period.Technavio’s analysts have elaborately explained the regional trends and drivers that shape the market during the forecast period.

See How Sodium Butyrate Market Demand is Rising in APAC Request Free Sample

Market Dynamics

Our researchers analyzed the data with 2025 as the base year, along with the key drivers, trends, and challenges. A holistic analysis of drivers will help companies refine their marketing strategies to gain a competitive advantage.

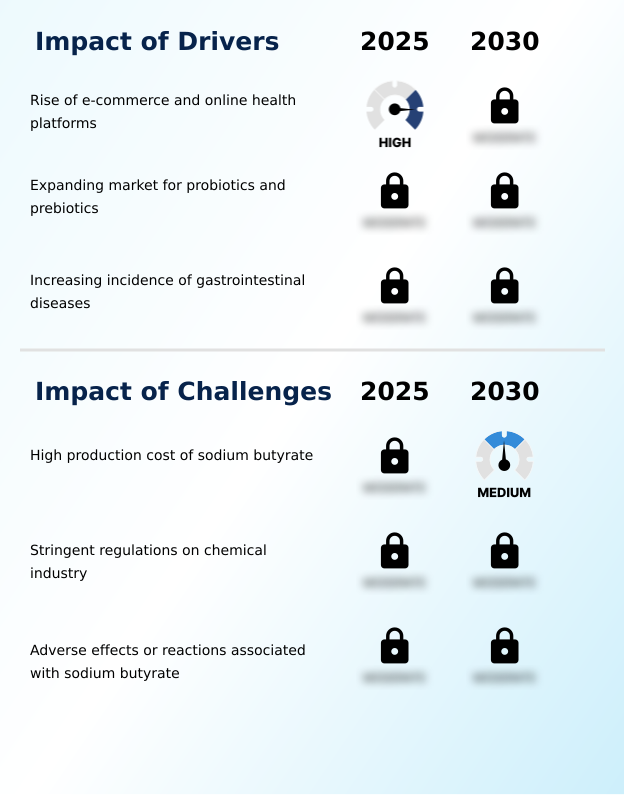
What are the key market drivers leading to the rise in the adoption of Sodium Butyrate Industry?

What are the market trends shaping the Sodium Butyrate Industry?

What challenges does the Sodium Butyrate Industry face during its growth?

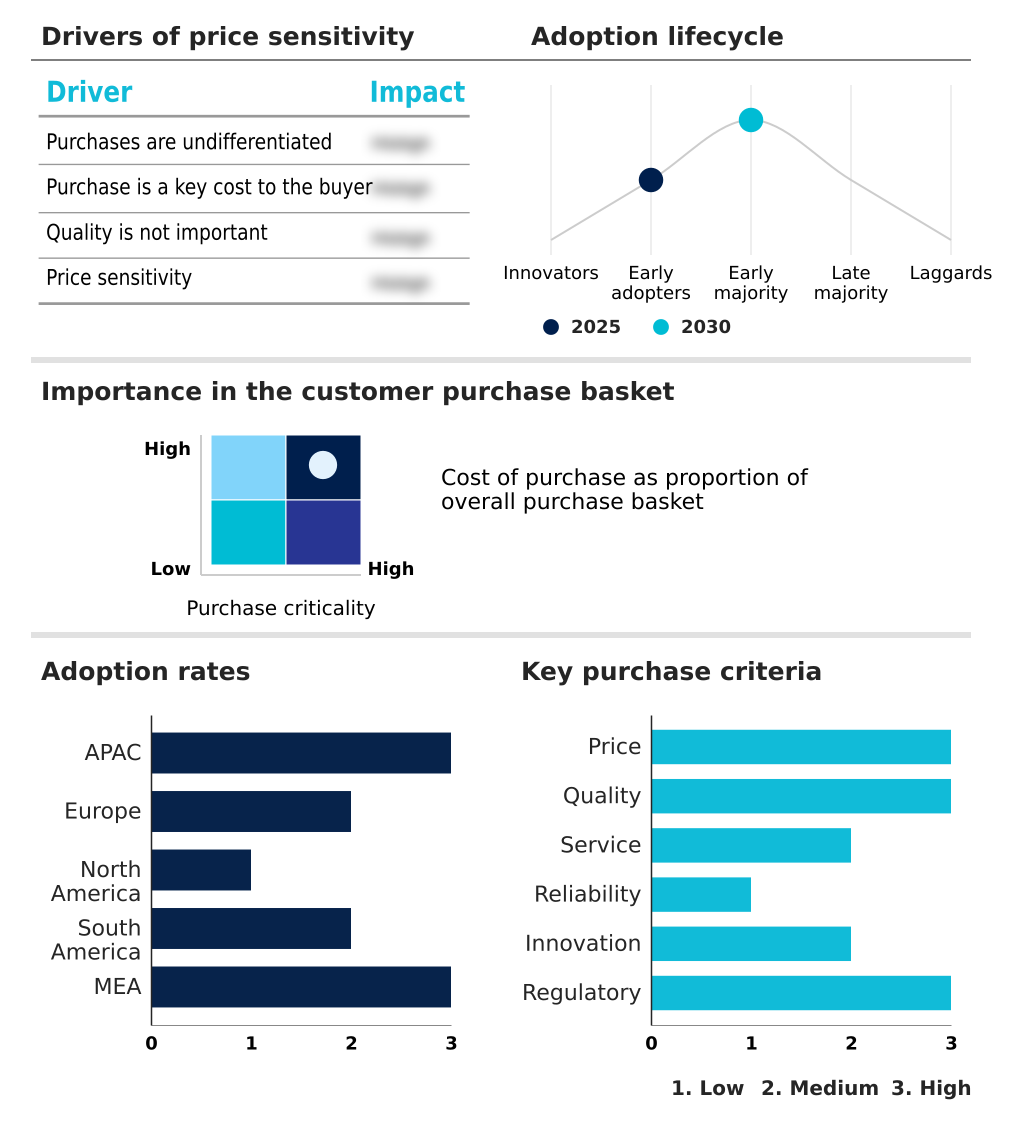
Exclusive Technavio Analysis on Customer Landscape

The sodium butyrate market forecasting report includes the adoption lifecycle of the market, covering from the innovator’s stage to the laggard’s stage. It focuses on adoption rates in different regions based on penetration. Furthermore, the sodium butyrate market report also includes key purchase criteria and drivers of price sensitivity to help companies evaluate and develop their market growth analysis strategies.

Customer Landscape of Sodium Butyrate Industry

Competitive Landscape

Companies are implementing various strategies, such as strategic alliances, sodium butyrate market forecast, partnerships, mergers and acquisitions, geographical expansion, and product/service launches, to enhance their presence in the industry.

Adisseo France SAS -

The industry research and growth report includes detailed analyses of the competitive landscape of the market and information about key companies, including:

  • Adisseo France SAS
  • American Elements Inc.
  • Bio Techne Corp.
  • Coats And Layers Chemicals
  • Conflate Chemtech
  • DSM Firmenich AG
  • Glentham Life Sciences Ltd.
  • HiMedia Laboratories Pvt. Ltd.
  • Jainex Speciality Chemical
  • KAVYA PHARMA
  • Merck KGaA
  • Muby Chem Ltd.
  • Otto Chemie Pvt. Ltd.
  • Palital BV
  • Santa Cruz Biotechnology Inc.
  • Thermo Fisher Scientific Inc.
  • Tokyo Chemical Co. Ltd.
  • West Bengal Chemical Ltd.
  • Zhejiang Yaofi Bio Co Ltd.

Qualitative and quantitative analysis of companies has been conducted to help clients understand the wider business environment as well as the strengths and weaknesses of key industry players. Data is qualitatively analyzed to categorize companies as pure play, category-focused, industry-focused, and diversified; it is quantitatively analyzed to categorize companies as dominant, leading, strong, tentative, and weak.

Recent Development and News in Sodium butyrate market

Dive into Technavio’s robust research methodology, blending expert interviews, extensive data synthesis, and validated models for unparalleled Sodium Butyrate Market insights. See full methodology.

Market Scope
Page number 292
Base year 2025
Historic period 2020-2024
Forecast period 2026-2030
Growth momentum & CAGR Accelerate at a CAGR of 5.5%
Market growth 2026-2030 USD 86.9 million
Market structure Fragmented
YoY growth 2025-2026(%) 5.2%
Key countries China, Japan, India, South Korea, Australia, Indonesia, Germany, UK, France, Italy, Spain, The Netherlands, US, Canada, Mexico, Brazil, Argentina, Colombia, Saudi Arabia, UAE, South Africa, Israel and Turkey
Competitive landscape Leading Companies, Market Positioning of Companies, Competitive Strategies, and Industry Risks

Request Free Sample

Research Analyst Overview

What are the Key Data Covered in this Sodium Butyrate Market Research and Growth Report?

  • What is the expected growth of the Sodium Butyrate Market between 2026 and 2030?

    • USD 86.9 million, at a CAGR of 5.5%

  • What segmentation does the market report cover?

    • The report is segmented by Type (Powder, and Liquid), Application (Animal feed, Food and beverages, Pharmaceuticals, Cosmetics, and Others), Channel (Direct sales, and Indirect sales) and Geography (APAC, Europe, North America, South America, Middle East and Africa)

  • Which regions are analyzed in the report?

    • APAC, Europe, North America, South America and Middle East and Africa

  • What are the key growth drivers and market challenges?

    • Rise of e-commerce and online health platforms, High production cost of sodium butyrate

  • Who are the major players in the Sodium Butyrate Market?

    • Adisseo France SAS, American Elements Inc., Bio Techne Corp., Coats And Layers Chemicals, Conflate Chemtech, DSM Firmenich AG, Glentham Life Sciences Ltd., HiMedia Laboratories Pvt. Ltd., Jainex Speciality Chemical, KAVYA PHARMA, Merck KGaA, Muby Chem Ltd., Otto Chemie Pvt. Ltd., Palital BV, Santa Cruz Biotechnology Inc., Thermo Fisher Scientific Inc., Tokyo Chemical Co. Ltd., West Bengal Chemical Ltd. and Zhejiang Yaofi Bio Co Ltd.

Market Research Insights

We can help! Our analysts can customize this sodium butyrate market research report to meet your requirements.

Get in touch

1. Executive Summary

1.1 Market overview

Executive Summary - Chart on Market Overview
Executive Summary - Data Table on Market Overview
Executive Summary - Chart on Global Market Characteristics
Executive Summary - Chart on Market by Geography
Executive Summary - Chart on Market Segmentation by Type
Executive Summary - Chart on Market Segmentation by Application
Executive Summary - Chart on Market Segmentation by Channel
Executive Summary - Chart on Incremental Growth
Executive Summary - Data Table on Incremental Growth
Executive Summary - Chart on Company Market Positioning

2. Technavio Analysis

2.1 Analysis of price sensitivity, lifecycle, customer purchase basket, adoption rates, and purchase criteria

2.2 Criticality of inputs and Factors of differentiation

Chart on Overview on criticality of inputs and factors of differentiation

2.3 Factors of disruption

Chart on Overview on factors of disruption

2.4 Impact of drivers and challenges

Chart on Impact of drivers and challenges in 2025 and 2030

3. Market Landscape

3.1 Market ecosystem

Chart on Parent Market
Data Table on - Parent Market

3.2 Market characteristics

Chart on Market characteristics analysis

3.3 Value chain analysis

Chart on Value chain analysis

4. Market Sizing

4.1 Market definition

Data Table on Offerings of companies included in the market definition

4.2 Market segment analysis

Market segments

4.3 Market size 2025

4.4 Market outlook: Forecast for 2025-2030

Chart on Global - Market size and forecast 2025-2030 ($ million)
Data Table on Global - Market size and forecast 2025-2030 ($ million)
Chart on Global Market: Year-over-year growth 2025-2030 (%)
Data Table on Global Market: Year-over-year growth 2025-2030 (%)

5. Historic Market Size

5.1 Global Sodium Butyrate Market 2020 - 2024

Historic Market Size - Data Table on Global Sodium Butyrate Market 2020 - 2024 ($ million)

5.2 Type segment analysis 2020 - 2024

Historic Market Size - Type Segment 2020 - 2024 ($ million)

5.3 Application segment analysis 2020 - 2024

Historic Market Size - Application Segment 2020 - 2024 ($ million)

5.4 Channel segment analysis 2020 - 2024

Historic Market Size - Channel Segment 2020 - 2024 ($ million)

5.5 Geography segment analysis 2020 - 2024

Historic Market Size - Geography Segment 2020 - 2024 ($ million)

5.6 Country segment analysis 2020 - 2024

Historic Market Size - Country Segment 2020 - 2024 ($ million)

6. Qualitative Analysis

6.1 Impact of AI in global sodium butyrate market

7. Five Forces Analysis

7.1 Five forces summary

Five forces analysis - Comparison between 2025 and 2030

7.2 Bargaining power of buyers

Bargaining power of buyers - Impact of key factors 2025 and 2030

7.3 Bargaining power of suppliers

Bargaining power of suppliers - Impact of key factors in 2025 and 2030

7.4 Threat of new entrants

Threat of new entrants - Impact of key factors in 2025 and 2030

7.5 Threat of substitutes

Threat of substitutes - Impact of key factors in 2025 and 2030

7.6 Threat of rivalry

Threat of rivalry - Impact of key factors in 2025 and 2030

7.7 Market condition

Chart on Market condition - Five forces 2025 and 2030

8. Market Segmentation by Type

8.1 Market segments

Chart on Type - Market share 2025-2030 (%)
Data Table on Type - Market share 2025-2030 (%)

8.2 Comparison by Type

Chart on Comparison by Type
Data Table on Comparison by Type

8.3 Powder - Market size and forecast 2025-2030

Chart on Powder - Market size and forecast 2025-2030 ($ million)
Data Table on Powder - Market size and forecast 2025-2030 ($ million)
Chart on Powder - Year-over-year growth 2025-2030 (%)
Data Table on Powder - Year-over-year growth 2025-2030 (%)

8.4 Liquid - Market size and forecast 2025-2030

Chart on Liquid - Market size and forecast 2025-2030 ($ million)
Data Table on Liquid - Market size and forecast 2025-2030 ($ million)
Chart on Liquid - Year-over-year growth 2025-2030 (%)
Data Table on Liquid - Year-over-year growth 2025-2030 (%)

8.5 Market opportunity by Type

Market opportunity by Type ($ million)
Data Table on Market opportunity by Type ($ million)

9. Market Segmentation by Application

9.1 Market segments

Chart on Application - Market share 2025-2030 (%)
Data Table on Application - Market share 2025-2030 (%)

9.2 Comparison by Application

Chart on Comparison by Application
Data Table on Comparison by Application

9.3 Animal feed - Market size and forecast 2025-2030

Chart on Animal feed - Market size and forecast 2025-2030 ($ million)
Data Table on Animal feed - Market size and forecast 2025-2030 ($ million)
Chart on Animal feed - Year-over-year growth 2025-2030 (%)
Data Table on Animal feed - Year-over-year growth 2025-2030 (%)

9.4 Food and beverages - Market size and forecast 2025-2030

Chart on Food and beverages - Market size and forecast 2025-2030 ($ million)
Data Table on Food and beverages - Market size and forecast 2025-2030 ($ million)
Chart on Food and beverages - Year-over-year growth 2025-2030 (%)
Data Table on Food and beverages - Year-over-year growth 2025-2030 (%)

9.5 Pharmaceuticals - Market size and forecast 2025-2030

Chart on Pharmaceuticals - Market size and forecast 2025-2030 ($ million)
Data Table on Pharmaceuticals - Market size and forecast 2025-2030 ($ million)
Chart on Pharmaceuticals - Year-over-year growth 2025-2030 (%)
Data Table on Pharmaceuticals - Year-over-year growth 2025-2030 (%)

9.6 Cosmetics - Market size and forecast 2025-2030

Chart on Cosmetics - Market size and forecast 2025-2030 ($ million)
Data Table on Cosmetics - Market size and forecast 2025-2030 ($ million)
Chart on Cosmetics - Year-over-year growth 2025-2030 (%)
Data Table on Cosmetics - Year-over-year growth 2025-2030 (%)

9.7 Others - Market size and forecast 2025-2030

Chart on Others - Market size and forecast 2025-2030 ($ million)
Data Table on Others - Market size and forecast 2025-2030 ($ million)
Chart on Others - Year-over-year growth 2025-2030 (%)
Data Table on Others - Year-over-year growth 2025-2030 (%)

9.8 Market opportunity by Application

Market opportunity by Application ($ million)
Data Table on Market opportunity by Application ($ million)

10. Market Segmentation by Channel

10.1 Market segments

Chart on Channel - Market share 2025-2030 (%)
Data Table on Channel - Market share 2025-2030 (%)

10.2 Comparison by Channel

Chart on Comparison by Channel
Data Table on Comparison by Channel

10.3 Direct sales - Market size and forecast 2025-2030

Chart on Direct sales - Market size and forecast 2025-2030 ($ million)
Data Table on Direct sales - Market size and forecast 2025-2030 ($ million)
Chart on Direct sales - Year-over-year growth 2025-2030 (%)
Data Table on Direct sales - Year-over-year growth 2025-2030 (%)

10.4 Indirect sales - Market size and forecast 2025-2030

Chart on Indirect sales - Market size and forecast 2025-2030 ($ million)
Data Table on Indirect sales - Market size and forecast 2025-2030 ($ million)
Chart on Indirect sales - Year-over-year growth 2025-2030 (%)
Data Table on Indirect sales - Year-over-year growth 2025-2030 (%)

10.5 Market opportunity by Channel

Market opportunity by Channel ($ million)
Data Table on Market opportunity by Channel ($ million)

11. Customer Landscape

11.1 Customer landscape overview

Analysis of price sensitivity, lifecycle, customer purchase basket, adoption rates, and purchase criteria

12. Geographic Landscape

12.1 Geographic segmentation

Chart on Market share by geography 2025-2030 (%)
Data Table on Market share by geography 2025-2030 (%)

12.2 Geographic comparison

Chart on Geographic comparison
Data Table on Geographic comparison

12.3 APAC - Market size and forecast 2025-2030

Chart on APAC - Market size and forecast 2025-2030 ($ million)
Data Table on APAC - Market size and forecast 2025-2030 ($ million)
Chart on APAC - Year-over-year growth 2025-2030 (%)
Data Table on APAC - Year-over-year growth 2025-2030 (%)
Chart on Regional Comparison - APAC
Data Table on Regional Comparison - APAC

12.3.1 China - Market size and forecast 2025-2030

Chart on China - Market size and forecast 2025-2030 ($ million)
Data Table on China - Market size and forecast 2025-2030 ($ million)
Chart on China - Year-over-year growth 2025-2030 (%)
Data Table on China - Year-over-year growth 2025-2030 (%)

12.3.2 Japan - Market size and forecast 2025-2030

Chart on Japan - Market size and forecast 2025-2030 ($ million)
Data Table on Japan - Market size and forecast 2025-2030 ($ million)
Chart on Japan - Year-over-year growth 2025-2030 (%)
Data Table on Japan - Year-over-year growth 2025-2030 (%)

12.3.3 India - Market size and forecast 2025-2030

Chart on India - Market size and forecast 2025-2030 ($ million)
Data Table on India - Market size and forecast 2025-2030 ($ million)
Chart on India - Year-over-year growth 2025-2030 (%)
Data Table on India - Year-over-year growth 2025-2030 (%)

12.3.4 South Korea - Market size and forecast 2025-2030

Chart on South Korea - Market size and forecast 2025-2030 ($ million)
Data Table on South Korea - Market size and forecast 2025-2030 ($ million)
Chart on South Korea - Year-over-year growth 2025-2030 (%)
Data Table on South Korea - Year-over-year growth 2025-2030 (%)

12.3.5 Australia - Market size and forecast 2025-2030

Chart on Australia - Market size and forecast 2025-2030 ($ million)
Data Table on Australia - Market size and forecast 2025-2030 ($ million)
Chart on Australia - Year-over-year growth 2025-2030 (%)
Data Table on Australia - Year-over-year growth 2025-2030 (%)

12.3.6 Indonesia - Market size and forecast 2025-2030

Chart on Indonesia - Market size and forecast 2025-2030 ($ million)
Data Table on Indonesia - Market size and forecast 2025-2030 ($ million)
Chart on Indonesia - Year-over-year growth 2025-2030 (%)
Data Table on Indonesia - Year-over-year growth 2025-2030 (%)

12.4 Europe - Market size and forecast 2025-2030

Chart on Europe - Market size and forecast 2025-2030 ($ million)
Data Table on Europe - Market size and forecast 2025-2030 ($ million)
Chart on Europe - Year-over-year growth 2025-2030 (%)
Data Table on Europe - Year-over-year growth 2025-2030 (%)
Chart on Regional Comparison - Europe
Data Table on Regional Comparison - Europe

12.4.1 Germany - Market size and forecast 2025-2030

Chart on Germany - Market size and forecast 2025-2030 ($ million)
Data Table on Germany - Market size and forecast 2025-2030 ($ million)
Chart on Germany - Year-over-year growth 2025-2030 (%)
Data Table on Germany - Year-over-year growth 2025-2030 (%)

12.4.2 UK - Market size and forecast 2025-2030

Chart on UK - Market size and forecast 2025-2030 ($ million)
Data Table on UK - Market size and forecast 2025-2030 ($ million)
Chart on UK - Year-over-year growth 2025-2030 (%)
Data Table on UK - Year-over-year growth 2025-2030 (%)

12.4.3 France - Market size and forecast 2025-2030

Chart on France - Market size and forecast 2025-2030 ($ million)
Data Table on France - Market size and forecast 2025-2030 ($ million)
Chart on France - Year-over-year growth 2025-2030 (%)
Data Table on France - Year-over-year growth 2025-2030 (%)

12.4.4 Italy - Market size and forecast 2025-2030

Chart on Italy - Market size and forecast 2025-2030 ($ million)
Data Table on Italy - Market size and forecast 2025-2030 ($ million)
Chart on Italy - Year-over-year growth 2025-2030 (%)
Data Table on Italy - Year-over-year growth 2025-2030 (%)

12.4.5 Spain - Market size and forecast 2025-2030

Chart on Spain - Market size and forecast 2025-2030 ($ million)
Data Table on Spain - Market size and forecast 2025-2030 ($ million)
Chart on Spain - Year-over-year growth 2025-2030 (%)
Data Table on Spain - Year-over-year growth 2025-2030 (%)

12.4.6 The Netherlands - Market size and forecast 2025-2030

Chart on The Netherlands - Market size and forecast 2025-2030 ($ million)
Data Table on The Netherlands - Market size and forecast 2025-2030 ($ million)
Chart on The Netherlands - Year-over-year growth 2025-2030 (%)
Data Table on The Netherlands - Year-over-year growth 2025-2030 (%)

12.5 North America - Market size and forecast 2025-2030

Chart on North America - Market size and forecast 2025-2030 ($ million)
Data Table on North America - Market size and forecast 2025-2030 ($ million)
Chart on North America - Year-over-year growth 2025-2030 (%)
Data Table on North America - Year-over-year growth 2025-2030 (%)
Chart on Regional Comparison - North America
Data Table on Regional Comparison - North America

12.5.1 US - Market size and forecast 2025-2030

Chart on US - Market size and forecast 2025-2030 ($ million)
Data Table on US - Market size and forecast 2025-2030 ($ million)
Chart on US - Year-over-year growth 2025-2030 (%)
Data Table on US - Year-over-year growth 2025-2030 (%)

12.5.2 Canada - Market size and forecast 2025-2030

Chart on Canada - Market size and forecast 2025-2030 ($ million)
Data Table on Canada - Market size and forecast 2025-2030 ($ million)
Chart on Canada - Year-over-year growth 2025-2030 (%)
Data Table on Canada - Year-over-year growth 2025-2030 (%)

12.5.3 Mexico - Market size and forecast 2025-2030

Chart on Mexico - Market size and forecast 2025-2030 ($ million)
Data Table on Mexico - Market size and forecast 2025-2030 ($ million)
Chart on Mexico - Year-over-year growth 2025-2030 (%)
Data Table on Mexico - Year-over-year growth 2025-2030 (%)

12.6 South America - Market size and forecast 2025-2030

Chart on South America - Market size and forecast 2025-2030 ($ million)
Data Table on South America - Market size and forecast 2025-2030 ($ million)
Chart on South America - Year-over-year growth 2025-2030 (%)
Data Table on South America - Year-over-year growth 2025-2030 (%)
Chart on Regional Comparison - South America
Data Table on Regional Comparison - South America

12.6.1 Brazil - Market size and forecast 2025-2030

Chart on Brazil - Market size and forecast 2025-2030 ($ million)
Data Table on Brazil - Market size and forecast 2025-2030 ($ million)
Chart on Brazil - Year-over-year growth 2025-2030 (%)
Data Table on Brazil - Year-over-year growth 2025-2030 (%)

12.6.2 Argentina - Market size and forecast 2025-2030

Chart on Argentina - Market size and forecast 2025-2030 ($ million)
Data Table on Argentina - Market size and forecast 2025-2030 ($ million)
Chart on Argentina - Year-over-year growth 2025-2030 (%)
Data Table on Argentina - Year-over-year growth 2025-2030 (%)

12.6.3 Colombia - Market size and forecast 2025-2030

Chart on Colombia - Market size and forecast 2025-2030 ($ million)
Data Table on Colombia - Market size and forecast 2025-2030 ($ million)
Chart on Colombia - Year-over-year growth 2025-2030 (%)
Data Table on Colombia - Year-over-year growth 2025-2030 (%)

12.7 Middle East and Africa - Market size and forecast 2025-2030

Chart on Middle East and Africa - Market size and forecast 2025-2030 ($ million)
Data Table on Middle East and Africa - Market size and forecast 2025-2030 ($ million)
Chart on Middle East and Africa - Year-over-year growth 2025-2030 (%)
Data Table on Middle East and Africa - Year-over-year growth 2025-2030 (%)
Chart on Regional Comparison - Middle East and Africa
Data Table on Regional Comparison - Middle East and Africa

12.7.1 Saudi Arabia - Market size and forecast 2025-2030

Chart on Saudi Arabia - Market size and forecast 2025-2030 ($ million)
Data Table on Saudi Arabia - Market size and forecast 2025-2030 ($ million)
Chart on Saudi Arabia - Year-over-year growth 2025-2030 (%)
Data Table on Saudi Arabia - Year-over-year growth 2025-2030 (%)

12.7.2 UAE - Market size and forecast 2025-2030

Chart on UAE - Market size and forecast 2025-2030 ($ million)
Data Table on UAE - Market size and forecast 2025-2030 ($ million)
Chart on UAE - Year-over-year growth 2025-2030 (%)
Data Table on UAE - Year-over-year growth 2025-2030 (%)

12.7.3 South Africa - Market size and forecast 2025-2030

Chart on South Africa - Market size and forecast 2025-2030 ($ million)
Data Table on South Africa - Market size and forecast 2025-2030 ($ million)
Chart on South Africa - Year-over-year growth 2025-2030 (%)
Data Table on South Africa - Year-over-year growth 2025-2030 (%)

12.7.4 Israel - Market size and forecast 2025-2030

Chart on Israel - Market size and forecast 2025-2030 ($ million)
Data Table on Israel - Market size and forecast 2025-2030 ($ million)
Chart on Israel - Year-over-year growth 2025-2030 (%)
Data Table on Israel - Year-over-year growth 2025-2030 (%)

12.7.5 Turkey - Market size and forecast 2025-2030

Chart on Turkey - Market size and forecast 2025-2030 ($ million)
Data Table on Turkey - Market size and forecast 2025-2030 ($ million)
Chart on Turkey - Year-over-year growth 2025-2030 (%)
Data Table on Turkey - Year-over-year growth 2025-2030 (%)

12.8 Market opportunity by geography

Market opportunity by geography ($ million)
Data Tables on Market opportunity by geography ($ million)

13. Drivers, Challenges, and Opportunity

13.1 Market drivers

Rise of e-commerce and online health platforms
Expanding market for probiotics and prebiotics
Increasing incidence of gastrointestinal diseases

13.2 Market challenges

High production cost of sodium butyrate
Stringent regulations on chemical industry
Adverse effects or reactions associated with sodium butyrate

13.3 Impact of drivers and challenges

Impact of drivers and challenges in 2025 and 2030

13.4 Market opportunities

Increasing consumption of meat products
Advancements in bio-based sodium butyrate
Regulatory advances and approvals of sodium butyrate

14. Competitive Landscape

14.1 Overview

14.2

Overview on criticality of inputs and factors of differentiation

14.3 Landscape disruption

Overview on factors of disruption

14.4 Industry risks

Impact of key risks on business

15. Competitive Analysis

15.1 Companies profiled

Companies covered

15.2 Company ranking index

15.3 Market positioning of companies

Matrix on companies position and classification

15.4 Adisseo France SAS

Adisseo France SAS - Overview
Adisseo France SAS - Product / Service
Adisseo France SAS - Key offerings
SWOT

15.5 American Elements Inc.

American Elements Inc. - Overview
American Elements Inc. - Product / Service
American Elements Inc. - Key offerings
SWOT

15.6 Bio Techne Corp.

Bio Techne Corp. - Overview
Bio Techne Corp. - Business segments
Bio Techne Corp. - Key news
Bio Techne Corp. - Key offerings
Bio Techne Corp. - Segment focus
SWOT

15.7 Coats And Layers Chemicals

Coats And Layers Chemicals - Overview
Coats And Layers Chemicals - Product / Service
Coats And Layers Chemicals - Key offerings
SWOT

15.8 DSM Firmenich AG

DSM Firmenich AG - Overview
DSM Firmenich AG - Product / Service
DSM Firmenich AG - Key offerings
SWOT

15.9 Glentham Life Sciences Ltd.

Glentham Life Sciences Ltd. - Overview
Glentham Life Sciences Ltd. - Product / Service
Glentham Life Sciences Ltd. - Key offerings
SWOT

15.10 Jainex Speciality Chemical

Jainex Speciality Chemical - Overview
Jainex Speciality Chemical - Product / Service
Jainex Speciality Chemical - Key offerings
SWOT

15.11 Merck KGaA

Merck KGaA - Overview
Merck KGaA - Business segments
Merck KGaA - Key news
Merck KGaA - Key offerings
Merck KGaA - Segment focus
SWOT

15.12 Muby Chem Ltd.

Muby Chem Ltd. - Overview
Muby Chem Ltd. - Product / Service
Muby Chem Ltd. - Key offerings
SWOT

15.13 Palital BV

Palital BV - Overview
Palital BV - Product / Service
Palital BV - Key offerings
SWOT

15.14 Santa Cruz Biotechnology Inc.

Santa Cruz Biotechnology Inc. - Overview
Santa Cruz Biotechnology Inc. - Product / Service
Santa Cruz Biotechnology Inc. - Key offerings
SWOT

15.15 Thermo Fisher Scientific Inc.

Thermo Fisher Scientific Inc. - Overview
Thermo Fisher Scientific Inc. - Business segments
Thermo Fisher Scientific Inc. - Key news
Thermo Fisher Scientific Inc. - Key offerings
Thermo Fisher Scientific Inc. - Segment focus
SWOT

15.16 Tokyo Chemical Co. Ltd.

Tokyo Chemical Co. Ltd. - Overview
Tokyo Chemical Co. Ltd. - Product / Service
Tokyo Chemical Co. Ltd. - Key offerings
SWOT

15.17 West Bengal Chemical Ltd.

West Bengal Chemical Ltd. - Overview
West Bengal Chemical Ltd. - Product / Service
West Bengal Chemical Ltd. - Key offerings
SWOT

15.18 Zhejiang Yaofi Bio Co Ltd.

Zhejiang Yaofi Bio Co Ltd. - Overview
Zhejiang Yaofi Bio Co Ltd. - Product / Service
Zhejiang Yaofi Bio Co Ltd. - Key offerings
SWOT

16. Appendix

16.1 Scope of the report

Market definition
Objectives
Notes and caveats

16.2 Inclusions and exclusions checklist

Inclusions checklist
Exclusions checklist

16.3 Currency conversion rates for US$

16.4 Research methodology

16.5 Data procurement

Information sources

16.6 Data validation

16.7 Validation techniques employed for market sizing

16.8 Data synthesis

16.9 360 degree market analysis

16.10 List of abbreviations

Research Methodology

Technavio presents a detailed picture of the market by way of study, synthesis, and summation of data from multiple sources. The analysts have presented the various facets of the market with a particular focus on identifying the key industry influencers. The data thus presented is comprehensive, reliable, and the result of extensive research, both primary and secondary.

INFORMATION SOURCES

Primary sources

  • Manufacturers and suppliers
  • Channel partners
  • Industry experts
  • Strategic decision makers

Secondary sources

  • Industry journals and periodicals
  • Government data
  • Financial reports of key industry players
  • Historical data
  • Press releases

DATA ANALYSIS

Data Synthesis

  • Collation of data
  • Estimation of key figures
  • Analysis of derived insights

Data Validation

  • Triangulation with data models
  • Reference against proprietary databases
  • Corroboration with industry experts

REPORT WRITING

Qualitative

  • Market drivers
  • Market challenges
  • Market trends
  • Five forces analysis

Quantitative

  • Market size and forecast
  • Market segmentation
  • Geographical insights
  • Competitive landscape

Interested in this report?

Get your sample now to see our research methodology and insights!

Download Now

Frequently Asked Questions

Sodium Butyrate market growth will increase by USD 86.9 million during 2026-2030.

The Sodium Butyrate market is expected to grow at a CAGR of 5.5% during 2026-2030.

Sodium Butyrate market is segmented by Type (Powder, Liquid) Application (Animal feed, Food and beverages, Pharmaceuticals, Cosmetics, Others) Channel (Direct sales, Indirect sales)

Adisseo France SAS, American Elements Inc., Bio Techne Corp., Coats And Layers Chemicals, Conflate Chemtech, DSM Firmenich AG, Glentham Life Sciences Ltd., HiMedia Laboratories Pvt. Ltd., Jainex Speciality Chemical, KAVYA PHARMA, Merck KGaA, Muby Chem Ltd., Otto Chemie Pvt. Ltd., Palital BV, Santa Cruz Biotechnology Inc., Thermo Fisher Scientific Inc., Tokyo Chemical Co. Ltd., West Bengal Chemical Ltd., Zhejiang Yaofi Bio Co Ltd. are a few of the key vendors in the Sodium Butyrate market.

APAC will register the highest growth rate of 51.7% among the other regions. Therefore, the Sodium Butyrate market in APAC is expected to garner significant business opportunities for the vendors during the forecast period.

China, Japan, India, South Korea, Australia, Indonesia, Germany, UK, France, Italy, Spain, The Netherlands, US, Canada, Mexico, Brazil, Argentina, Colombia, Saudi Arabia, UAE, South Africa, Israel, Turkey

  • Rise of e-commerce and online health platforms is the driving factor this market.

The Sodium Butyrate market vendors should focus on grabbing business opportunities from the Type segment as it accounted for the largest market share in the base year.