Software Bill Of Materials (SBOM) Management Market Analysis, Size, and Forecast 2026-2030: North America (US, Canada, and Mexico), Europe (Germany, UK, and France), APAC (China, India, and Japan), Middle East and Africa (Saudi Arabia, UAE, and South Africa), South America (Brazil, Argentina, and Colombia), and Rest of World (ROW)

Software Bill Of Materials (SBOM) Management Market Analysis, Size, and Forecast 2026-2030:
North America (US, Canada, and Mexico), Europe (Germany, UK, and France), APAC (China, India, and Japan), Middle East and Africa (Saudi Arabia, UAE, and South Africa), South America (Brazil, Argentina, and Colombia), and Rest of World (ROW)

Published: May 2026 302 Pages SKU: IRTNTR81285

Market Overview at a Glance

$2.41 B
Market Opportunity
22.1%
CAGR 2025 - 2030
33.4%
North America Growth
$745.2 Mn
Cloud-based segment 2024

Software Bill Of Materials (Sbom) Management Market Size and Growth Forecast 2026-2030

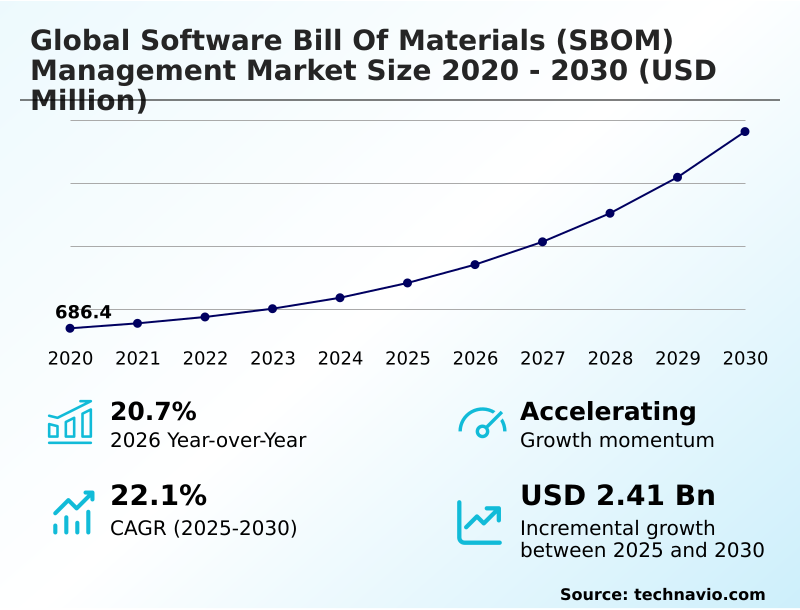
The Software Bill Of Materials (Sbom) Management Market size was valued at USD 1.41 billion in 2025 growing at a CAGR of 22.1% during the forecast period 2026-2030.

North America accounts for 33.4% of incremental growth during the forecast period. The Cloud-based segment by Deployment was valued at USD 745.2 million in 2024, while the Vulnerability and risk management segment holds the largest revenue share by Application.

The market is projected to grow by USD 3.13 billion from 2020 to 2030, with USD 2.41 billion of the growth expected during the forecast period of 2025 to 2030.

Get Key Insights on Market Forecast (PDF) Request Free Sample

Software Bill Of Materials (Sbom) Management Market Overview

The software bill of materials (sbom) management market is fundamentally shaped by the escalating need for software component transparency amidst rising supply chain attacks. A key driver is the accelerated adoption of devsecops, which necessitates integrating automated security checks directly into the development lifecycle. This shift is particularly evident in regulated sectors; for instance, a medical device manufacturer implementing automated sbom generation ensures continuous compliance with FDA premarket submission guidelines, embedding vulnerability and risk management into its CI/CD pipeline. This proactive stance contrasts sharply with reactive measures, reflecting a broader industry transition toward managing software provenance and integrity from code inception. With North America accounting for over 33% of the market's incremental growth, regulatory pressure from bodies like CISA is setting a global benchmark. The adoption of AI-driven dependency analysis is further refining these processes, enabling more sophisticated threat intelligence integration and reducing the manual overhead associated with open-source license compliance and vulnerability disclosure policies.

Drivers, Trends, and Challenges in the Software Bill Of Materials (Sbom) Management Market

The imperative to secure digital infrastructure is pushing organizations to adopt comprehensive strategies for managing software supply chains. A critical factor is the EU Cyber Resilience Act, which mandates stringent transparency and security-by-design principles, making the implementation of sbom management platforms for automotive software and other critical systems a non-negotiable compliance task.

In a typical automotive OEM setting, leveraging automated sbom generation for ci/cd pipelines is essential to track components from hundreds of tier-one and tier-two suppliers, ensuring that every piece of code meets security and licensing requirements.

As procurement teams are now comparing sbom generation tools for enterprises, the focus is on platforms that offer not just generation but also continuous monitoring and vulnerability prioritization.

Enterprises are discovering that following best practices for sbom implementation, which includes integrating these tools with existing security information and event management systems, can reduce mean-time-to-remediate critical vulnerabilities by over 40% compared to manual tracking methods. The financial impact of sbom on software development costs is offset by reduced risk of breaches and streamlined compliance.

Understanding how to use sbom for vulnerability management becomes a core competency for security teams, who must manage the sbom lifecycle for open source components effectively. The benefits of sbom for developers include faster remediation and clearer guidance, fostering a more secure development culture.

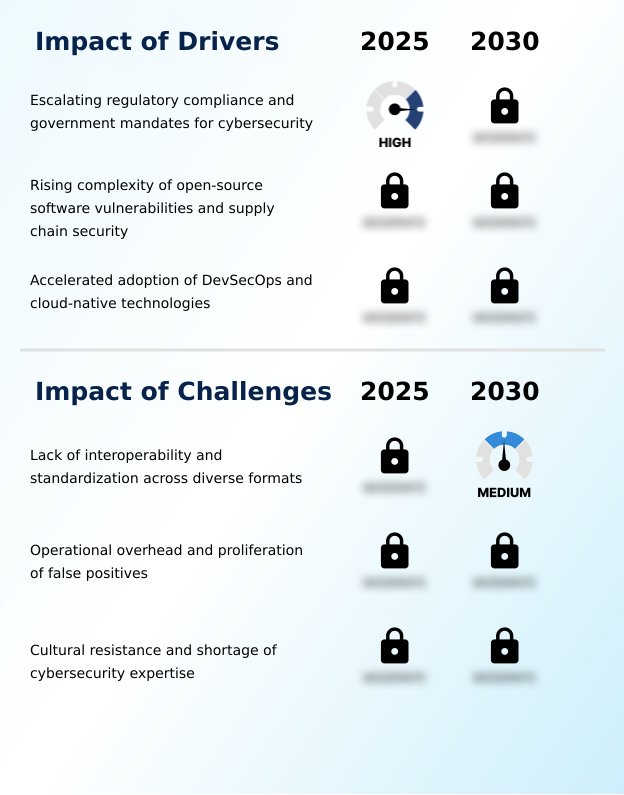
Primary Growth Driver: Escalating regulatory compliance requirements and government mandates for cybersecurity are a primary driver for the adoption of software bill of materials (SBOM) management solutions.

Regulatory pressure and the inherent risks of modern software development are the primary drivers of the software bill of materials (SBOM) management market.

Government mandates, particularly in North America, which commands a 33.37% share of the global market opportunity, have made software supply chain security a prerequisite for public sector contracts. This has forced organizations to adopt formal processes for software component verification.

The widespread use of open-source components has also made open-source vulnerability scanning an essential practice to mitigate risks from software supply chain attacks.

Furthermore, the accelerated adoption of devsecops and cloud-native development requires automated security solutions, making devsecops toolchain integration a critical driver for market growth as organizations seek to embed security without impeding development velocity.

Emerging Market Trend: The integration of artificial intelligence and machine learning for automated dependency analysis represents a key emerging trend. This enables proactive vulnerability prediction and prioritization of critical threats within complex software ecosystems.

Key trends are reshaping the software bill of materials (SBOM) management market, moving it beyond simple inventory creation toward dynamic risk management. The integration of AI-driven dependency analysis is central to this evolution, enabling security teams to perform automated remediation and prioritize threats with greater precision.

This shift is evident as the vulnerability and risk management application segment continues to hold the largest market share. Concurrently, there is a strong push for global standardization around formats like CycloneDX and SPDX, which facilitates better threat intelligence integration across disparate tools and supply chains.

This trend supports a more robust vulnerability disclosure policy, as clear, interoperable data is crucial for rapid communication and response. The market is increasingly focused on the entire sbom lifecycle management, transforming static documents into living inventories for continuous security.

Key Industry Challenge: The lack of interoperability and standardization across diverse documentation formats presents a significant challenge to seamless data exchange and market growth.

A significant challenge constraining the software bill of materials (SBOM) management market is the operational overhead caused by a lack of standardization and the prevalence of false positives. A recent report indicated that 40% of global enterprises struggle to reconcile disparate metadata formats, which impedes efforts toward automated sbom validation and creates significant friction in multi-vendor environments.

This lack of standardization is a critical structural issue. Additionally, security teams often face vulnerability fatigue from a high volume of alerts generated by vulnerability scanning tools, many of which lack the context to determine actual exploitability.

The global shortage of cybersecurity expertise, particularly in interpreting complex vulnerability cvss scores and managing open-source software risks, further exacerbates this challenge, limiting the effective adoption and utilization of advanced SBOM management platforms.

Explore Full Market Dynamics Analysis Request Free Sample

Software Bill Of Materials (Sbom) Management Market Segmentation

The software bill of materials (sbom) management industry research report provides comprehensive data including region-wise segment analysis, with forecasts and analysis for the period 2026-2030, as well as historical data from 2020-2024 for the following segments.

Market Segment by Deployment
  • Cloud-based
  • On-premises
Market Segment by Application
  • Vulnerability and risk management
  • Compliance and governance management
  • SBOM generation and discovery
Market Segment by End-user
  • Software developers
  • DevOps and CI teams
  • Security teams
  • Compliance and risk officers
  • Government and regulated industries
Market Segment by Geography
North America
US, Canada, Mexico
Europe
Germany, UK, France, The Netherlands, Italy, Spain
APAC
China, India, Japan, South Korea, Australia, Indonesia
Middle East and Africa
Saudi Arabia, UAE, South Africa, Israel, Turkey
South America
Brazil, Argentina, Colombia

Deployment Segment Analysis

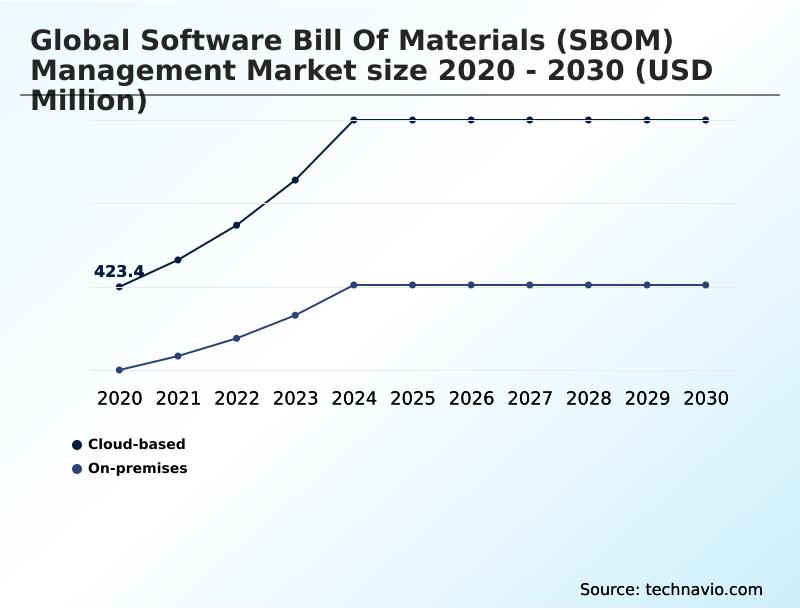
The cloud-based segment is estimated to witness significant growth during the forecast period.

The cloud-based deployment model for software bill of materials (sbom) management dominates the market, accounting for approximately 64% of the total share in 2025.

This model's rapid adoption is driven by its inherent scalability and flexibility, which align with modern cloud-native workflows and the accelerated adoption of devsecops.

Organizations increasingly favor cloud solutions to centralize oversight of software components across distributed development teams without significant upfront capital expenditure. These platforms enable seamless automated sbom validation and threat intelligence integration, ensuring that security teams can perform continuous vulnerability discovery.

The software as a service (saas) delivery model is particularly attractive for enterprises requiring sophisticated tools for software supply chain security that can scale with their growing software portfolios and support global regulatory compliance frameworks.

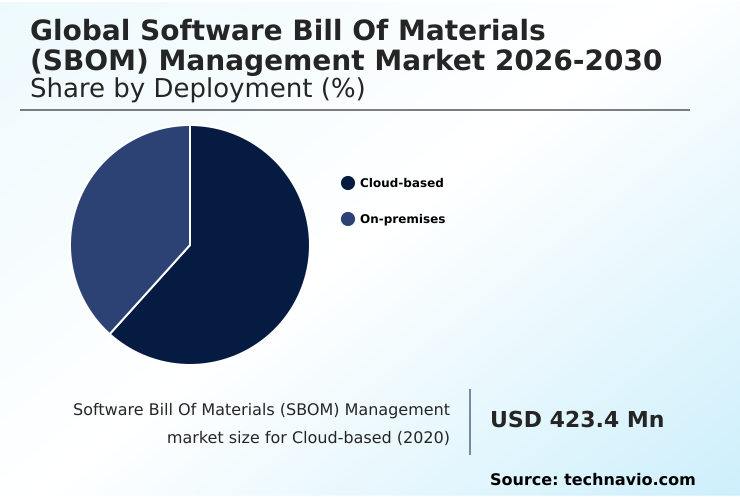
The Cloud-based segment was valued at USD 745.2 million in 2024 and showed a gradual increase during the forecast period.

Software Bill Of Materials (Sbom) Management Market by Region: North America Leads with 33.4% Growth Share

North America is estimated to contribute 33.4% to the growth of the global market during the forecast period.

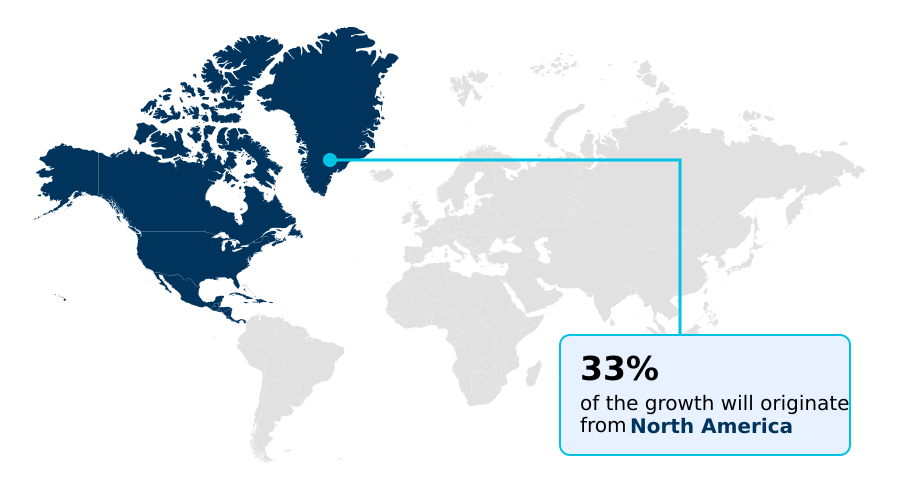
The geographic landscape of the software bill of materials (SBOM) management market is led by North America, which accounts for 33.37% of the market opportunity, largely due to stringent federal mandates that enforce software supply chain security.

This region sets the global standard for regulatory compliance frameworks and vulnerability disclosure policy.

Meanwhile, APAC is the fastest-growing region, with its market projected to expand at a 23.2% rate, fueled by rapid digitalization and the vast software development ecosystems in China and India.

Europe is also a significant market, driven by initiatives like the Cyber Resilience Act that compel organizations to adopt transparent practices such as using the cyclonedx format for interoperability.

This global divergence highlights a mature, regulation-driven market in the West versus a rapidly expanding, adoption-focused market in the East.

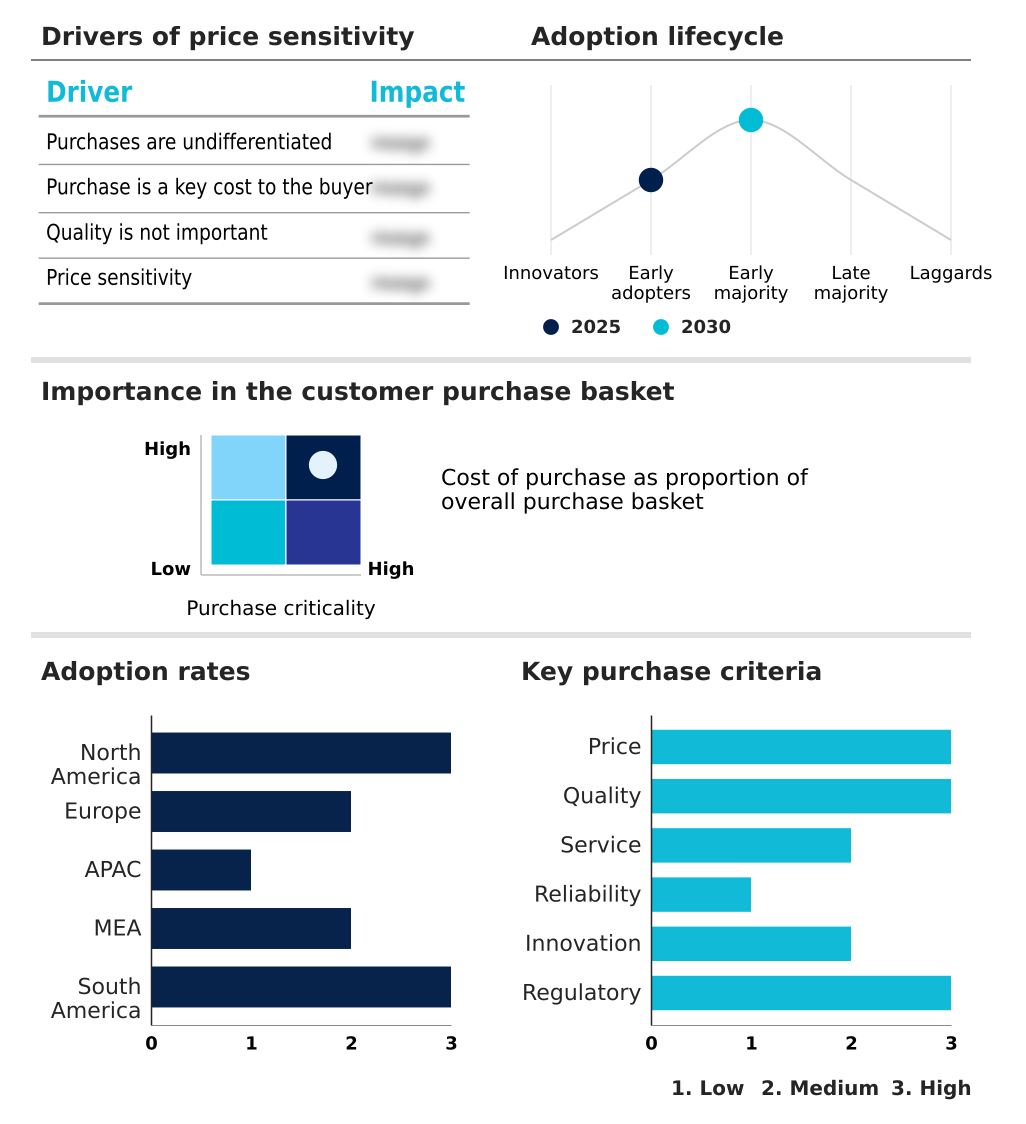
Customer Landscape Analysis for the Software Bill Of Materials (Sbom) Management Market

The software bill of materials (sbom) management market forecasting report includes the adoption lifecycle of the market, covering from the innovator’s stage to the laggard’s stage. It focuses on adoption rates in different regions based on penetration. Furthermore, the software bill of materials (sbom) management market report also includes key purchase criteria and drivers of price sensitivity to help companies evaluate and develop their market growth analysis strategies.

Competitive Landscape of the Software Bill Of Materials (Sbom) Management Market

Companies are implementing various strategies, such as strategic alliances, partnerships, mergers and acquisitions, geographical expansion, and product/service launches, to enhance their presence in the software bill of materials (sbom) management market industry.

Anchore Inc. - Offerings center on deep container inspection and filesystem analysis to generate comprehensive component inventories for securing cloud-native applications and ensuring software component transparency.

The industry research and growth report includes detailed analyses of the competitive landscape of the market and information about key companies, including:

  • Anchore Inc.
  • Aqua Security Software Ltd.
  • ArmorCode
  • Chainguard
  • Checkmarx Ltd.
  • Codenotary
  • Cybeats Technologies Inc.
  • Finite State Inc.
  • Flexera Software LLC
  • FOSSA Inc.
  • JFrog Ltd.
  • Karamba Security Ltd.
  • Mend.io
  • Palo Alto Networks Inc.
  • ReversingLabs
  • ServiceNow Inc.
  • Snyk Ltd.
  • Sonatype Inc.
  • Veracode Inc.
  • Vigilant Ops

Qualitative and quantitative analysis of companies has been conducted to help clients understand the wider business environment as well as the strengths and weaknesses of key industry players. Data is qualitatively analyzed to categorize companies as pure play, category-focused, industry-focused, and diversified; it is quantitatively analyzed to categorize companies as dominant, leading, strong, tentative, and weak.

Recent Developments in the Software Bill Of Materials (Sbom) Management Market

  • In March 2025, Finite State Inc. released updated firmware analysis modules designed to enhance the security of critical infrastructure and embedded systems.
  • In March 2025, Karamba Security Ltd. also launched updated firmware analysis modules, focusing on strengthening the security posture of IoT and automotive software.
  • In February 2025, the International Organization for Standardization introduced a new protocol to facilitate the automated exchange of software bill of materials data across international borders.
  • In March 2025, the US Department of Commerce published a comprehensive update to its minimum elements for a software bill of materials, mandating more stringent requirements for component origin identification.

Research Analyst Overview: Software Bill Of Materials (Sbom) Management Market

The software bill of materials (sbom) management market is maturing from a compliance-centric necessity to a strategic tool for proactive risk management. Boardroom decisions increasingly weigh the total cost of ownership of a comprehensive cloud native application protection platform (cnapp) against siloed software composition analysis (sca) tools, with a clear trend toward integrated solutions.

This shift is driven by the operational need for a single source of truth that supports not just vulnerability scanning but also advanced capabilities like vulnerability reachability mapping and zero-day vulnerability response. Adherence to standards like ISO/IEC 5230 for open-source license compliance is no longer optional but a baseline for vendor qualification.

With year-over-year market growth hitting 20.7%, investment is accelerating in technologies that automate and secure the entire software lifecycle. The rise of immutable ledger technology for ensuring code provenance tracking further underscores the market's move toward verifiable, end-to-end software supply chain security and robust devsecops toolchain integration.

Dive into Technavio’s robust research methodology, blending expert interviews, extensive data synthesis, and validated models for unparalleled Software Bill Of Materials (Sbom) Management Market insights. See full methodology.

Request Free Sample

Market Scope
Page number 302
Base year 2025
Historic period 2020-2024
Forecast period 2026-2030
Growth momentum & CAGR Accelerate at a CAGR of 22.1%
Market growth 2026-2030 USD 2408.4 million
Market structure Fragmented
YoY growth 2025-2026(%) 20.7%
Key countries US, Canada, Mexico, Germany, UK, France, The Netherlands, Italy, Spain, China, India, Japan, South Korea, Australia, Indonesia, Saudi Arabia, UAE, South Africa, Israel, Turkey, Brazil, Argentina and Colombia
Competitive landscape Leading Companies, Market Positioning of Companies, Competitive Strategies, and Industry Risks

Software Bill Of Materials (Sbom) Management Market: Key Questions Answered in This Report

  • What is the expected growth of the Software Bill Of Materials (Sbom) Management Market between 2026 and 2030?

    • The Software Bill Of Materials (Sbom) Management Market is expected to grow by USD 2.41 billion during 2026-2030, registering a CAGR of 22.1%. Year-over-year growth in 2026 is estimated at 20.7%%. This acceleration is shaped by escalating regulatory compliance and government mandates for cybersecurity, which is intensifying demand across multiple end-use verticals covered in the report.

  • What segmentation does the market report cover?

    • The report is segmented by Deployment (Cloud-based, and On-premises), Application (Vulnerability and risk management, Compliance and governance management, and SBOM generation and discovery), End-user (Software developers, DevOps and CI teams, Security teams, Compliance and risk officers, and Government and regulated industries) and Geography (North America, Europe, APAC, Middle East and Africa, South America). Among these, the Cloud-based segment is estimated to witness significant growth during the forecast period, driven by rising adoption across key application areas. Each segment includes detailed qualitative and quantitative analysis, along with historical data from 2020-2024 and forecasts through 2030 with year-over-year growth rates.

  • Which regions are analyzed in the report?

    • The report covers North America, Europe, APAC, Middle East and Africa and South America. North America is estimated to contribute 33.4% to market growth during the forecast period. Country-level analysis includes US, Canada, Mexico, Germany, UK, France, The Netherlands, Italy, Spain, China, India, Japan, South Korea, Australia, Indonesia, Saudi Arabia, UAE, South Africa, Israel, Turkey, Brazil, Argentina and Colombia, with dedicated market size tables and year-over-year growth for each.

  • What are the key growth drivers and market challenges?

    • The primary driver is escalating regulatory compliance and government mandates for cybersecurity, which is accelerating investment and industry demand. The main challenge is lack of interoperability and standardization across diverse formats, creating operational barriers for key market participants. The report quantifies the impact of each driver and challenge across 2026 and 2030 with comparative analysis.

  • Who are the major players in the Software Bill Of Materials (Sbom) Management Market?

    • Key vendors include Anchore Inc., Aqua Security Software Ltd., ArmorCode, Chainguard, Checkmarx Ltd., Codenotary, Cybeats Technologies Inc., Finite State Inc., Flexera Software LLC, FOSSA Inc., JFrog Ltd., Karamba Security Ltd., Mend.io, Palo Alto Networks Inc., ReversingLabs, ServiceNow Inc., Snyk Ltd., Sonatype Inc., Veracode Inc. and Vigilant Ops. The report provides qualitative and quantitative analysis categorizing companies as dominant, leading, strong, tentative, and weak based on their market positioning. Company profiles include business segment analysis, SWOT assessment, key offerings, and recent strategic developments.

Software Bill Of Materials (Sbom) Management Market Research Insights

The market dynamics for software bill of materials (SBOM) management are heavily influenced by the push for greater software component transparency, driven by an increase in sophisticated software supply chain attacks. As organizations grapple with third-party software risk management, the adoption of standardized formats like Software Package Data Exchange (SPDX) becomes critical for interoperability.

The market's shift toward cloud-based solutions is pronounced, with this segment projected to be nearly double the size of on-premises deployments by 2025. In practice, security teams are leveraging open source vulnerability scanning and software composition analysis within the CI/CD pipeline to automatically identify and flag risks, moving from periodic audits to continuous security assurance and effective vulnerability management.

We can help! Our analysts can customize this software bill of materials (sbom) management market research report to meet your requirements.

Get in touch

1. Executive Summary

1.1 Market overview

Executive Summary - Chart on Market Overview
Executive Summary - Data Table on Market Overview
Executive Summary - Chart on Global Market Characteristics
Executive Summary - Chart on Market by Geography
Executive Summary - Chart on Market Segmentation by Deployment
Executive Summary - Chart on Market Segmentation by Application
Executive Summary - Chart on Market Segmentation by End-user
Executive Summary - Chart on Incremental Growth
Executive Summary - Data Table on Incremental Growth
Executive Summary - Chart on Company Market Positioning

2. Technavio Analysis

2.1 Analysis of price sensitivity, lifecycle, customer purchase basket, adoption rates, and purchase criteria

2.2 Criticality of inputs and Factors of differentiation

Chart on Overview on criticality of inputs and factors of differentiation

2.3 Factors of disruption

Chart on Overview on factors of disruption

2.4 Impact of drivers and challenges

Chart on Impact of drivers and challenges in 2025 and 2030

3. Market Landscape

3.1 Market ecosystem

Chart on Parent Market
Data Table on - Parent Market

3.2 Market characteristics

Chart on Market characteristics analysis

3.3 Value chain analysis

Chart on Value chain analysis

4. Market Sizing

4.1 Market definition

Data Table on Offerings of companies included in the market definition

4.2 Market segment analysis

Market segments

4.3 Market size 2025

4.4 Market outlook: Forecast for 2025-2030

Chart on Global - Market size and forecast 2025-2030 ($ million)
Data Table on Global - Market size and forecast 2025-2030 ($ million)
Chart on Global Market: Year-over-year growth 2025-2030 (%)
Data Table on Global Market: Year-over-year growth 2025-2030 (%)

5. Historic Market Size

5.1 Global Software Bill Of Materials (SBOM) Management Market 2020 - 2024

Historic Market Size - Data Table on Global Software Bill Of Materials (SBOM) Management Market 2020 - 2024 ($ million)

5.2 Deployment segment analysis 2020 - 2024

Historic Market Size - Deployment Segment 2020 - 2024 ($ million)

5.3 Application segment analysis 2020 - 2024

Historic Market Size - Application Segment 2020 - 2024 ($ million)

5.4 End-user segment analysis 2020 - 2024

Historic Market Size - End-user Segment 2020 - 2024 ($ million)

5.5 Geography segment analysis 2020 - 2024

Historic Market Size - Geography Segment 2020 - 2024 ($ million)

5.6 Country segment analysis 2020 - 2024

Historic Market Size - Country Segment 2020 - 2024 ($ million)

6. Qualitative Analysis

6.1 Impact of AI on Global Software Bill of Materials (SBOM) Management Market

7. Five Forces Analysis

7.1 Five forces summary

Five forces analysis - Comparison between 2025 and 2030

7.2 Bargaining power of buyers

Bargaining power of buyers - Impact of key factors 2025 and 2030

7.3 Bargaining power of suppliers

Bargaining power of suppliers - Impact of key factors in 2025 and 2030

7.4 Threat of new entrants

Threat of new entrants - Impact of key factors in 2025 and 2030

7.5 Threat of substitutes

Threat of substitutes - Impact of key factors in 2025 and 2030

7.6 Threat of rivalry

Threat of rivalry - Impact of key factors in 2025 and 2030

7.7 Market condition

Chart on Market condition - Five forces 2025 and 2030

8. Market Segmentation by Deployment

8.1 Market segments

Chart on Deployment - Market share 2025-2030 (%)
Data Table on Deployment - Market share 2025-2030 (%)

8.2 Comparison by Deployment

Chart on Comparison by Deployment
Data Table on Comparison by Deployment

8.3 Cloud-based - Market size and forecast 2025-2030

Chart on Cloud-based - Market size and forecast 2025-2030 ($ million)
Data Table on Cloud-based - Market size and forecast 2025-2030 ($ million)
Chart on Cloud-based - Year-over-year growth 2025-2030 (%)
Data Table on Cloud-based - Year-over-year growth 2025-2030 (%)

8.4 On-premises - Market size and forecast 2025-2030

Chart on On-premises - Market size and forecast 2025-2030 ($ million)
Data Table on On-premises - Market size and forecast 2025-2030 ($ million)
Chart on On-premises - Year-over-year growth 2025-2030 (%)
Data Table on On-premises - Year-over-year growth 2025-2030 (%)

8.5 Market opportunity by Deployment

Market opportunity by Deployment ($ million)
Data Table on Market opportunity by Deployment ($ million)

9. Market Segmentation by Application

9.1 Market segments

Chart on Application - Market share 2025-2030 (%)
Data Table on Application - Market share 2025-2030 (%)

9.2 Comparison by Application

Chart on Comparison by Application
Data Table on Comparison by Application

9.3 Vulnerability and risk management - Market size and forecast 2025-2030

Chart on Vulnerability and risk management - Market size and forecast 2025-2030 ($ million)
Data Table on Vulnerability and risk management - Market size and forecast 2025-2030 ($ million)
Chart on Vulnerability and risk management - Year-over-year growth 2025-2030 (%)
Data Table on Vulnerability and risk management - Year-over-year growth 2025-2030 (%)

9.4 Compliance and governance management - Market size and forecast 2025-2030

Chart on Compliance and governance management - Market size and forecast 2025-2030 ($ million)
Data Table on Compliance and governance management - Market size and forecast 2025-2030 ($ million)
Chart on Compliance and governance management - Year-over-year growth 2025-2030 (%)
Data Table on Compliance and governance management - Year-over-year growth 2025-2030 (%)

9.5 SBOM generation and discovery - Market size and forecast 2025-2030

Chart on SBOM generation and discovery - Market size and forecast 2025-2030 ($ million)
Data Table on SBOM generation and discovery - Market size and forecast 2025-2030 ($ million)
Chart on SBOM generation and discovery - Year-over-year growth 2025-2030 (%)
Data Table on SBOM generation and discovery - Year-over-year growth 2025-2030 (%)

9.6 Market opportunity by Application

Market opportunity by Application ($ million)
Data Table on Market opportunity by Application ($ million)

10. Market Segmentation by End-user

10.1 Market segments

Chart on End-user - Market share 2025-2030 (%)
Data Table on End-user - Market share 2025-2030 (%)

10.2 Comparison by End-user

Chart on Comparison by End-user
Data Table on Comparison by End-user

10.3 Software developers - Market size and forecast 2025-2030

Chart on Software developers - Market size and forecast 2025-2030 ($ million)
Data Table on Software developers - Market size and forecast 2025-2030 ($ million)
Chart on Software developers - Year-over-year growth 2025-2030 (%)
Data Table on Software developers - Year-over-year growth 2025-2030 (%)

10.4 DevOps and CI teams - Market size and forecast 2025-2030

Chart on DevOps and CI teams - Market size and forecast 2025-2030 ($ million)
Data Table on DevOps and CI teams - Market size and forecast 2025-2030 ($ million)
Chart on DevOps and CI teams - Year-over-year growth 2025-2030 (%)
Data Table on DevOps and CI teams - Year-over-year growth 2025-2030 (%)

10.5 Security teams - Market size and forecast 2025-2030

Chart on Security teams - Market size and forecast 2025-2030 ($ million)
Data Table on Security teams - Market size and forecast 2025-2030 ($ million)
Chart on Security teams - Year-over-year growth 2025-2030 (%)
Data Table on Security teams - Year-over-year growth 2025-2030 (%)

10.6 Compliance and risk officers - Market size and forecast 2025-2030

Chart on Compliance and risk officers - Market size and forecast 2025-2030 ($ million)
Data Table on Compliance and risk officers - Market size and forecast 2025-2030 ($ million)
Chart on Compliance and risk officers - Year-over-year growth 2025-2030 (%)
Data Table on Compliance and risk officers - Year-over-year growth 2025-2030 (%)

10.7 Government and regulated industries - Market size and forecast 2025-2030

Chart on Government and regulated industries - Market size and forecast 2025-2030 ($ million)
Data Table on Government and regulated industries - Market size and forecast 2025-2030 ($ million)
Chart on Government and regulated industries - Year-over-year growth 2025-2030 (%)
Data Table on Government and regulated industries - Year-over-year growth 2025-2030 (%)

10.8 Market opportunity by End-user

Market opportunity by End-user ($ million)
Data Table on Market opportunity by End-user ($ million)

11. Customer Landscape

11.1 Customer landscape overview

Analysis of price sensitivity, lifecycle, customer purchase basket, adoption rates, and purchase criteria

12. Geographic Landscape

12.1 Geographic segmentation

Chart on Market share by geography 2025-2030 (%)
Data Table on Market share by geography 2025-2030 (%)

12.2 Geographic comparison

Chart on Geographic comparison
Data Table on Geographic comparison

12.3 North America - Market size and forecast 2025-2030

Chart on North America - Market size and forecast 2025-2030 ($ million)
Data Table on North America - Market size and forecast 2025-2030 ($ million)
Chart on North America - Year-over-year growth 2025-2030 (%)
Data Table on North America - Year-over-year growth 2025-2030 (%)
Chart on Regional Comparison - North America
Data Table on Regional Comparison - North America

12.3.1 US - Market size and forecast 2025-2030

Chart on US - Market size and forecast 2025-2030 ($ million)
Data Table on US - Market size and forecast 2025-2030 ($ million)
Chart on US - Year-over-year growth 2025-2030 (%)
Data Table on US - Year-over-year growth 2025-2030 (%)

12.3.2 Canada - Market size and forecast 2025-2030

Chart on Canada - Market size and forecast 2025-2030 ($ million)
Data Table on Canada - Market size and forecast 2025-2030 ($ million)
Chart on Canada - Year-over-year growth 2025-2030 (%)
Data Table on Canada - Year-over-year growth 2025-2030 (%)

12.3.3 Mexico - Market size and forecast 2025-2030

Chart on Mexico - Market size and forecast 2025-2030 ($ million)
Data Table on Mexico - Market size and forecast 2025-2030 ($ million)
Chart on Mexico - Year-over-year growth 2025-2030 (%)
Data Table on Mexico - Year-over-year growth 2025-2030 (%)

12.4 Europe - Market size and forecast 2025-2030

Chart on Europe - Market size and forecast 2025-2030 ($ million)
Data Table on Europe - Market size and forecast 2025-2030 ($ million)
Chart on Europe - Year-over-year growth 2025-2030 (%)
Data Table on Europe - Year-over-year growth 2025-2030 (%)
Chart on Regional Comparison - Europe
Data Table on Regional Comparison - Europe

12.4.1 Germany - Market size and forecast 2025-2030

Chart on Germany - Market size and forecast 2025-2030 ($ million)
Data Table on Germany - Market size and forecast 2025-2030 ($ million)
Chart on Germany - Year-over-year growth 2025-2030 (%)
Data Table on Germany - Year-over-year growth 2025-2030 (%)

12.4.2 UK - Market size and forecast 2025-2030

Chart on UK - Market size and forecast 2025-2030 ($ million)
Data Table on UK - Market size and forecast 2025-2030 ($ million)
Chart on UK - Year-over-year growth 2025-2030 (%)
Data Table on UK - Year-over-year growth 2025-2030 (%)

12.4.3 France - Market size and forecast 2025-2030

Chart on France - Market size and forecast 2025-2030 ($ million)
Data Table on France - Market size and forecast 2025-2030 ($ million)
Chart on France - Year-over-year growth 2025-2030 (%)
Data Table on France - Year-over-year growth 2025-2030 (%)

12.4.4 The Netherlands - Market size and forecast 2025-2030

Chart on The Netherlands - Market size and forecast 2025-2030 ($ million)
Data Table on The Netherlands - Market size and forecast 2025-2030 ($ million)
Chart on The Netherlands - Year-over-year growth 2025-2030 (%)
Data Table on The Netherlands - Year-over-year growth 2025-2030 (%)

12.4.5 Italy - Market size and forecast 2025-2030

Chart on Italy - Market size and forecast 2025-2030 ($ million)
Data Table on Italy - Market size and forecast 2025-2030 ($ million)
Chart on Italy - Year-over-year growth 2025-2030 (%)
Data Table on Italy - Year-over-year growth 2025-2030 (%)

12.4.6 Spain - Market size and forecast 2025-2030

Chart on Spain - Market size and forecast 2025-2030 ($ million)
Data Table on Spain - Market size and forecast 2025-2030 ($ million)
Chart on Spain - Year-over-year growth 2025-2030 (%)
Data Table on Spain - Year-over-year growth 2025-2030 (%)

12.5 APAC - Market size and forecast 2025-2030

Chart on APAC - Market size and forecast 2025-2030 ($ million)
Data Table on APAC - Market size and forecast 2025-2030 ($ million)
Chart on APAC - Year-over-year growth 2025-2030 (%)
Data Table on APAC - Year-over-year growth 2025-2030 (%)
Chart on Regional Comparison - APAC
Data Table on Regional Comparison - APAC

12.5.1 China - Market size and forecast 2025-2030

Chart on China - Market size and forecast 2025-2030 ($ million)
Data Table on China - Market size and forecast 2025-2030 ($ million)
Chart on China - Year-over-year growth 2025-2030 (%)
Data Table on China - Year-over-year growth 2025-2030 (%)

12.5.2 India - Market size and forecast 2025-2030

Chart on India - Market size and forecast 2025-2030 ($ million)
Data Table on India - Market size and forecast 2025-2030 ($ million)
Chart on India - Year-over-year growth 2025-2030 (%)
Data Table on India - Year-over-year growth 2025-2030 (%)

12.5.3 Japan - Market size and forecast 2025-2030

Chart on Japan - Market size and forecast 2025-2030 ($ million)
Data Table on Japan - Market size and forecast 2025-2030 ($ million)
Chart on Japan - Year-over-year growth 2025-2030 (%)
Data Table on Japan - Year-over-year growth 2025-2030 (%)

12.5.4 South Korea - Market size and forecast 2025-2030

Chart on South Korea - Market size and forecast 2025-2030 ($ million)
Data Table on South Korea - Market size and forecast 2025-2030 ($ million)
Chart on South Korea - Year-over-year growth 2025-2030 (%)
Data Table on South Korea - Year-over-year growth 2025-2030 (%)

12.5.5 Australia - Market size and forecast 2025-2030

Chart on Australia - Market size and forecast 2025-2030 ($ million)
Data Table on Australia - Market size and forecast 2025-2030 ($ million)
Chart on Australia - Year-over-year growth 2025-2030 (%)
Data Table on Australia - Year-over-year growth 2025-2030 (%)

12.5.6 Indonesia - Market size and forecast 2025-2030

Chart on Indonesia - Market size and forecast 2025-2030 ($ million)
Data Table on Indonesia - Market size and forecast 2025-2030 ($ million)
Chart on Indonesia - Year-over-year growth 2025-2030 (%)
Data Table on Indonesia - Year-over-year growth 2025-2030 (%)

12.6 Middle East and Africa - Market size and forecast 2025-2030

Chart on Middle East and Africa - Market size and forecast 2025-2030 ($ million)
Data Table on Middle East and Africa - Market size and forecast 2025-2030 ($ million)
Chart on Middle East and Africa - Year-over-year growth 2025-2030 (%)
Data Table on Middle East and Africa - Year-over-year growth 2025-2030 (%)
Chart on Regional Comparison - Middle East and Africa
Data Table on Regional Comparison - Middle East and Africa

12.6.1 Saudi Arabia - Market size and forecast 2025-2030

Chart on Saudi Arabia - Market size and forecast 2025-2030 ($ million)
Data Table on Saudi Arabia - Market size and forecast 2025-2030 ($ million)
Chart on Saudi Arabia - Year-over-year growth 2025-2030 (%)
Data Table on Saudi Arabia - Year-over-year growth 2025-2030 (%)

12.6.2 UAE - Market size and forecast 2025-2030

Chart on UAE - Market size and forecast 2025-2030 ($ million)
Data Table on UAE - Market size and forecast 2025-2030 ($ million)
Chart on UAE - Year-over-year growth 2025-2030 (%)
Data Table on UAE - Year-over-year growth 2025-2030 (%)

12.6.3 South Africa - Market size and forecast 2025-2030

Chart on South Africa - Market size and forecast 2025-2030 ($ million)
Data Table on South Africa - Market size and forecast 2025-2030 ($ million)
Chart on South Africa - Year-over-year growth 2025-2030 (%)
Data Table on South Africa - Year-over-year growth 2025-2030 (%)

12.6.4 Israel - Market size and forecast 2025-2030

Chart on Israel - Market size and forecast 2025-2030 ($ million)
Data Table on Israel - Market size and forecast 2025-2030 ($ million)
Chart on Israel - Year-over-year growth 2025-2030 (%)
Data Table on Israel - Year-over-year growth 2025-2030 (%)

12.6.5 Turkey - Market size and forecast 2025-2030

Chart on Turkey - Market size and forecast 2025-2030 ($ million)
Data Table on Turkey - Market size and forecast 2025-2030 ($ million)
Chart on Turkey - Year-over-year growth 2025-2030 (%)
Data Table on Turkey - Year-over-year growth 2025-2030 (%)

12.7 South America - Market size and forecast 2025-2030

Chart on South America - Market size and forecast 2025-2030 ($ million)
Data Table on South America - Market size and forecast 2025-2030 ($ million)
Chart on South America - Year-over-year growth 2025-2030 (%)
Data Table on South America - Year-over-year growth 2025-2030 (%)
Chart on Regional Comparison - South America
Data Table on Regional Comparison - South America

12.7.1 Brazil - Market size and forecast 2025-2030

Chart on Brazil - Market size and forecast 2025-2030 ($ million)
Data Table on Brazil - Market size and forecast 2025-2030 ($ million)
Chart on Brazil - Year-over-year growth 2025-2030 (%)
Data Table on Brazil - Year-over-year growth 2025-2030 (%)

12.7.2 Argentina - Market size and forecast 2025-2030

Chart on Argentina - Market size and forecast 2025-2030 ($ million)
Data Table on Argentina - Market size and forecast 2025-2030 ($ million)
Chart on Argentina - Year-over-year growth 2025-2030 (%)
Data Table on Argentina - Year-over-year growth 2025-2030 (%)

12.7.3 Colombia - Market size and forecast 2025-2030

Chart on Colombia - Market size and forecast 2025-2030 ($ million)
Data Table on Colombia - Market size and forecast 2025-2030 ($ million)
Chart on Colombia - Year-over-year growth 2025-2030 (%)
Data Table on Colombia - Year-over-year growth 2025-2030 (%)

12.8 Market opportunity by geography

Market opportunity by geography ($ million)
Data Tables on Market opportunity by geography ($ million)

13. Drivers, Challenges, and Opportunity

13.1 Market drivers

Escalating regulatory compliance and government mandates for cybersecurity
Rising complexity of open-source software vulnerabilities and supply chain security
Accelerated adoption of DevSecOps and cloud-native technologies

13.2 Market challenges

Lack of interoperability and standardization across diverse formats
Operational overhead and proliferation of false positives
Cultural resistance and shortage of cybersecurity expertise

13.3 Impact of drivers and challenges

Impact of drivers and challenges in 2025 and 2030

13.4 Market opportunities

Integration of AI and machine learning for automated dependency analysis
Global standardization and regulatory harmonization of compliance frameworks
Expansion of SBOM utility into risk management

14. Competitive Landscape

14.1 Overview

14.2

Overview on criticality of inputs and factors of differentiation

14.3 Landscape disruption

Overview on factors of disruption

14.4 Industry risks

Impact of key risks on business

15. Competitive Analysis

15.1 Companies profiled

Companies covered

15.2 Company ranking index

15.3 Market positioning of companies

Matrix on companies position and classification

15.4 Anchore Inc.

Anchore Inc. - Overview
Anchore Inc. - Product / Service
Anchore Inc. - Key offerings
SWOT

15.5 Chainguard

Chainguard - Overview
Chainguard - Product / Service
Chainguard - Key offerings
SWOT

15.6 Checkmarx Ltd.

Checkmarx Ltd. - Overview
Checkmarx Ltd. - Product / Service
Checkmarx Ltd. - Key offerings
SWOT

15.7 Codenotary

Codenotary - Overview
Codenotary - Product / Service
Codenotary - Key offerings
SWOT

15.8 Cybeats Technologies Inc.

Cybeats Technologies Inc. - Overview
Cybeats Technologies Inc. - Product / Service
Cybeats Technologies Inc. - Key offerings
SWOT

15.9 Finite State Inc.

Finite State Inc. - Overview
Finite State Inc. - Product / Service
Finite State Inc. - Key offerings
SWOT

15.10 Flexera Software LLC

Flexera Software LLC - Overview
Flexera Software LLC - Product / Service
Flexera Software LLC - Key offerings
SWOT

15.11 FOSSA Inc.

FOSSA Inc. - Overview
FOSSA Inc. - Product / Service
FOSSA Inc. - Key offerings
SWOT

15.12 JFrog Ltd.

JFrog Ltd. - Overview
JFrog Ltd. - Product / Service
JFrog Ltd. - Key offerings
SWOT

15.13 Mend.io

Mend.io - Overview
Mend.io - Product / Service
Mend.io - Key offerings
SWOT

15.14 Palo Alto Networks Inc.

Palo Alto Networks Inc. - Overview
Palo Alto Networks Inc. - Business segments
Palo Alto Networks Inc. - Key offerings
Palo Alto Networks Inc. - Segment focus
SWOT

15.15 ReversingLabs

ReversingLabs - Overview
ReversingLabs - Product / Service
ReversingLabs - Key offerings
SWOT

15.16 Snyk Ltd.

Snyk Ltd. - Overview
Snyk Ltd. - Product / Service
Snyk Ltd. - Key offerings
SWOT

15.17 Sonatype Inc.

Sonatype Inc. - Overview
Sonatype Inc. - Product / Service
Sonatype Inc. - Key offerings
SWOT

15.18 Veracode Inc.

Veracode Inc. - Overview
Veracode Inc. - Product / Service
Veracode Inc. - Key offerings
SWOT

16. Appendix

16.1 Scope of the report

Market definition
Objectives
Notes and caveats

16.2 Inclusions and exclusions checklist

Inclusions checklist
Exclusions checklist

16.3 Currency conversion rates for US$

16.4 Research methodology

16.5 Data procurement

Information sources

16.6 Data validation

16.7 Validation techniques employed for market sizing

16.8 Data synthesis

16.9 360 degree market analysis

16.10 List of abbreviations

Research Methodology

Technavio presents a detailed picture of the market by way of study, synthesis, and summation of data from multiple sources. The analysts have presented the various facets of the market with a particular focus on identifying the key industry influencers. The data thus presented is comprehensive, reliable, and the result of extensive research, both primary and secondary.

INFORMATION SOURCES

Primary sources

  • Manufacturers and suppliers
  • Channel partners
  • Industry experts
  • Strategic decision makers

Secondary sources

  • Industry journals and periodicals
  • Government data
  • Financial reports of key industry players
  • Historical data
  • Press releases

DATA ANALYSIS

Data Synthesis

  • Collation of data
  • Estimation of key figures
  • Analysis of derived insights

Data Validation

  • Triangulation with data models
  • Reference against proprietary databases
  • Corroboration with industry experts

REPORT WRITING

Qualitative

  • Market drivers
  • Market challenges
  • Market trends
  • Five forces analysis

Quantitative

  • Market size and forecast
  • Market segmentation
  • Geographical insights
  • Competitive landscape

Interested in this report?

Get your sample now to see our research methodology and insights!

Download Now

Frequently Asked Questions

Software Bill Of Materials (Sbom) Management market growth will increase by USD 2408.4 million during 2026-2030.

The Software Bill Of Materials (Sbom) Management market is expected to grow at a CAGR of 22.1% during 2026-2030.

Software Bill Of Materials (Sbom) Management market is segmented by Deployment (Cloud-based, On-premises) Application (Vulnerability and risk management, Compliance and governance management, SBOM generation and discovery) End-user (Software developers, DevOps and CI teams, Security teams, Compliance and risk officers, Government and regulated industries)

Anchore Inc., Aqua Security Software Ltd., ArmorCode, Chainguard, Checkmarx Ltd., Codenotary, Cybeats Technologies Inc., Finite State Inc., Flexera Software LLC, FOSSA Inc., JFrog Ltd., Karamba Security Ltd., Mend.io, Palo Alto Networks Inc., ReversingLabs, ServiceNow Inc., Snyk Ltd., Sonatype Inc., Veracode Inc., Vigilant Ops are a few of the key vendors in the Software Bill Of Materials (Sbom) Management market.

North America will register the highest growth rate of 33.4% among the other regions. Therefore, the Software Bill Of Materials (Sbom) Management market in North America is expected to garner significant business opportunities for the vendors during the forecast period.

US, Canada, Mexico, Germany, UK, France, The Netherlands, Italy, Spain, China, India, Japan, South Korea, Australia, Indonesia, Saudi Arabia, UAE, South Africa, Israel, Turkey, Brazil, Argentina, Colombia

  • Escalating regulatory compliance and government mandates for cybersecurity is the driving factor this market.

The Software Bill Of Materials (Sbom) Management market vendors should focus on grabbing business opportunities from the Deployment segment as it accounted for the largest market share in the base year.
RIA - Research AI Assistant
Ask RIA