Software-defined Vehicle (SDV) Market Analysis, Size, and Forecast 2026-2030: North America (US, Canada, and Mexico), Europe (Germany, France, and UK), APAC (China, Japan, and South Korea), South America (Brazil and Argentina), Middle East and Africa (UAE, Saudi Arabia, and South Africa), and Rest of World (ROW)

Software-defined Vehicle (SDV) Market Analysis, Size, and Forecast 2026-2030:
North America (US, Canada, and Mexico), Europe (Germany, France, and UK), APAC (China, Japan, and South Korea), South America (Brazil and Argentina), Middle East and Africa (UAE, Saudi Arabia, and South Africa), and Rest of World (ROW)

Published: Mar 2026 297 Pages SKU: IRTNTR80130

Market Overview at a Glance

$147.00 B
Market Opportunity
27.2%
CAGR 2025 - 2030
38.4%
North America Growth
$35.35 B
Semi-SDV segment 2024

Software-defined Vehicle (SDV) Market Size 2026-2030

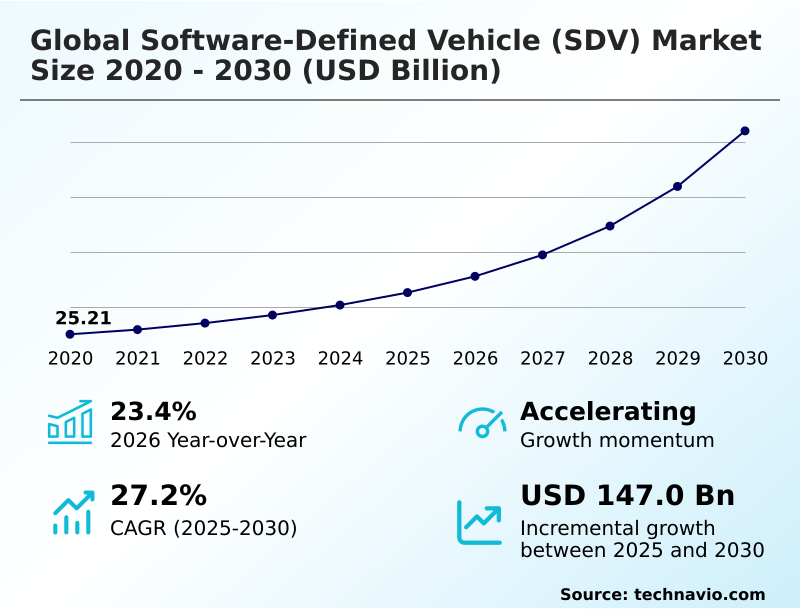
The software-defined vehicle (sdv) market size is valued to increase by USD 147.00 billion, at a CAGR of 27.2% from 2025 to 2030. Increasing demand for autonomous vehicles will drive the software-defined vehicle (sdv) market.

Major Market Trends & Insights

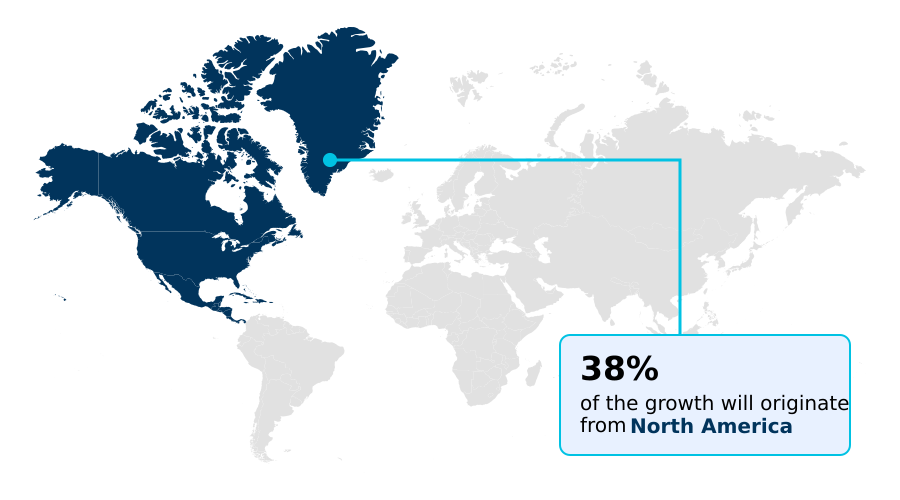
  • North America dominated the market and accounted for a 38.4% growth during the forecast period.
  • By Type - Semi-SDV segment was valued at USD 35.35 billion in 2024
  • By Vehicle Type - Passenger cars segment accounted for the largest market revenue share in 2024

Market Size & Forecast

  • Market Opportunities: USD 184.90 billion
  • Market Future Opportunities: USD 147.00 billion
  • CAGR from 2025 to 2030 : 27.2%

Market Summary

  • The software-defined vehicle (SDV) market represents a fundamental transformation, shifting the basis of automotive value from mechanical engineering to software innovation. This evolution is driven by consumer demand for connectivity and personalization, mirroring experiences with consumer electronics. Vehicles are becoming dynamic platforms capable of receiving over-the-air updates that enhance performance, safety, and infotainment features throughout the vehicle's lifecycle.
  • A key business scenario involves fleet management, where predictive maintenance algorithms analyze real-time vehicle data to forecast component failures, reducing downtime and optimizing operational efficiency. However, this transition introduces significant challenges, including managing immense software complexity and ensuring robust cybersecurity against remote threats.
  • The industry's move toward centralized E/E architecture and high-performance computing is essential for enabling advanced driver-assistance systems and paving the way for full autonomy, fundamentally redefining mobility and creating new revenue streams through on-demand services.

What will be the Size of the Software-defined Vehicle (SDV) Market during the forecast period?

Get Key Insights on Market Forecast (PDF) Request Free Sample

How is the Software-defined Vehicle (SDV) Market Segmented?

The software-defined vehicle (sdv) industry research report provides comprehensive data (region-wise segment analysis), with forecasts and estimates in "USD million" for the period 2026-2030, as well as historical data from 2020-2024 for the following segments.

  • Type
    • Semi-SDV
    • Full SDV
  • Vehicle type
    • Passenger cars
    • Commercial vehicles
  • Application
    • Powertrain control
    • Advanced driver-assistance systems (ADAS)
    • Infotainment and connectivity
    • Others
  • Geography
    • North America
      • US
      • Canada
      • Mexico
    • Europe
      • Germany
      • France
      • UK
    • APAC
      • China
      • Japan
      • South Korea
    • South America
      • Brazil
      • Argentina
    • Middle East and Africa
      • UAE
      • Saudi Arabia
      • South Africa
    • Rest of World (ROW)

By Type Insights

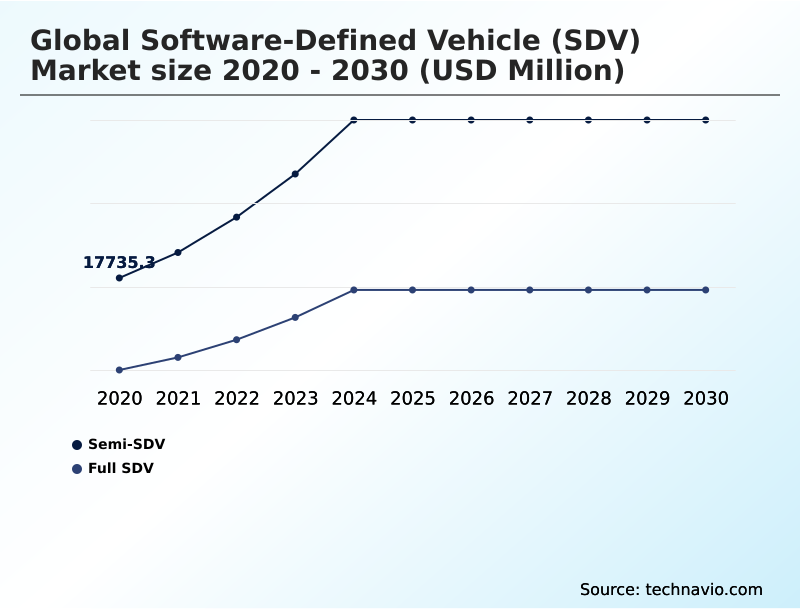
The semi-sdv segment is estimated to witness significant growth during the forecast period.

The semi-software-defined vehicle segment represents a critical transitional phase in the industry's E/E architecture transformation. This category is characterized by a domain-controlled architecture, where a domain controller unit manages distinct functionalities.

While it represents consolidation from legacy designs, the software-hardware decoupling is incomplete, limiting the scope of over-the-air updates. These updates are often restricted to non-critical systems like in-vehicle infotainment, impacting less than 30% of the vehicle’s functional domains.

This approach allows manufacturers to introduce subscription-based features and connected car services without a complete overhaul, balancing innovation with existing vehicle lifecycle management strategies.

The focus remains on progressing toward a true software-first development model through incremental advances in embedded software development.

Request Free Sample

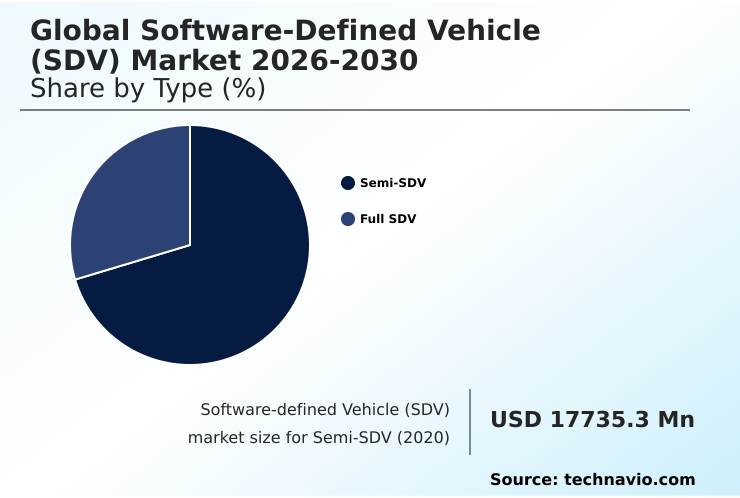
The Semi-SDV segment was valued at USD 35.35 billion in 2024 and showed a gradual increase during the forecast period.

Request Free Sample

Regional Analysis

North America is estimated to contribute 38.4% to the growth of the global market during the forecast period.Technavio’s analysts have elaborately explained the regional trends and drivers that shape the market during the forecast period.

See How Software-defined Vehicle (SDV) Market Demand is Rising in North America Request Free Sample

The geographic landscape is highly dynamic, with North America expected to command approximately 38% of the market's incremental growth. This region's leadership is fueled by intense competition and strong consumer adoption of new technologies.

Europe follows, contributing around 28% of the growth, driven by stringent regulations and deep automotive engineering expertise. The APAC region, securing about 26%, is the fastest-growing area, led by China's massive market scale and rapid innovation.

A key enabler is the move toward a zonal architecture, which simplifies vehicle-to-everything communication. This transition is supported by the adoption of automotive grade linux and advanced vehicle virtualization techniques.

These regional dynamics highlight a global push toward creating a comprehensive digital thread for automotive manufacturing.

Market Dynamics

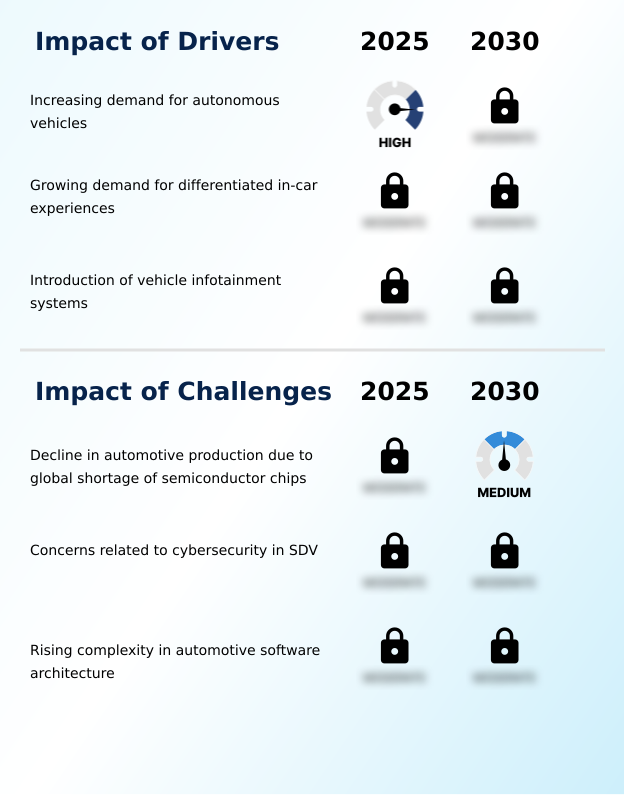
Our researchers analyzed the data with 2025 as the base year, along with the key drivers, trends, and challenges. A holistic analysis of drivers will help companies refine their marketing strategies to gain a competitive advantage.

  • The transition to the software-defined vehicle introduces profound complexity in managing software complexity in SDVs. The core challenge lies in the effective decoupling of software from hardware, a task central to achieving true modularity. The role of middleware in SDV platforms is therefore critical, providing the abstraction layer that enables independent development cycles and seamless integration.
  • For commercial vehicles, adopting an SDV architecture for commercial vehicles promises significant operational gains through OTA updates for powertrain control and predictive maintenance in electric vehicles. However, ensuring cybersecurity in centralized vehicle computers is a non-negotiable requirement, governed by rigorous industry standards.
  • The impact of 5G on V2X communication is transformative, enabling real-time data exchange for enhanced safety and traffic efficiency. This connectivity underpins the HPC platform for autonomous driving, which processes immense data streams. The industry is also exploring new business models, such as the subscription model for in-car features and on-demand ADAS feature activation via software.
  • To manage this evolution, automakers are leveraging the benefits of virtual ECU testing and creating a digital twin for vehicle simulation, achieving development cycles that are more than 50% faster than traditional methods. The vehicle OS impact on development is profound, dictating everything from application deployment to system-wide security.
  • Strategic decisions around SOA for cross-domain communication and the use of an automotive hypervisor for mixed-criticality systems are essential for ensuring functional safety in zonal architectures. The migration from domain to zonal architectures and the AI integration in smart cockpits represent the next frontier in this technological shift, which is further complicated by the challenges of software-hardware decoupling.
  • A robust cloud platform for HD mapping is also a prerequisite for advancing autonomous capabilities.

What are the key market drivers leading to the rise in the adoption of Software-defined Vehicle (SDV) Industry?

  • The increasing demand for autonomous vehicles is a key market driver, necessitating advanced, centrally managed software-defined vehicle architectures to process complex environmental data.

  • Market growth is being driven by the architectural shift toward high-performance computing and a centralized E/E architecture. This enables the development of an intelligent vehicle platform capable of supporting mobility-as-a-service business models.
  • The use of middleware layer abstraction is critical, allowing for a software-defined powertrain that can be optimized for efficiency, leading to a 10% improvement in energy consumption in certain use cases.
  • The adoption of cloud-native automotive software, coupled with continuous integration/continuous deployment pipelines, has been shown to reduce development and validation cycles by up to 25%.
  • A sophisticated AI-driven mobility platform relies on this infrastructure to process data from sensor fusion algorithms, paving the way for more advanced autonomous capabilities and connected services.

What are the market trends shaping the Software-defined Vehicle (SDV) Industry?

  • The integration of advanced safety technologies within luxury vehicles is a prominent market trend, driven by escalating consumer demand for enhanced protection and stricter safety regulations.

  • Key market trends are reshaping the in-vehicle experience and operational capabilities. The vehicle operating system is becoming the central nervous system, enabling a sophisticated smart cockpit technology and a next-generation user experience. This platform supports an in-vehicle app marketplace, allowing for feature-on-demand activation and continuous value delivery.
  • The integration of advanced driver-assistance systems is evolving, with data-driven vehicle development enabling performance improvements of over 20% through software updates. Automakers are leveraging the AUTOSAR adaptive platform to manage the complexity of these systems. Furthermore, predictive maintenance algorithms are gaining traction, capable of reducing unplanned downtime by up to 30%.
  • This shift toward an AI-defined vehicle is not just about features but about creating an adaptable, intelligent mobility platform.

What challenges does the Software-defined Vehicle (SDV) Industry face during its growth?

  • A significant challenge affecting industry growth is the decline in automotive production caused by the global shortage of mission-critical semiconductor chips.

  • Significant challenges stem from rising system complexity and stringent safety requirements. Adherence to ISO 26262 functional safety and UN R155 cybersecurity standards necessitates a robust automotive cybersecurity framework and a secure automotive software stack. The introduction of zonal security concepts and the use of an automotive hypervisor are critical for isolating safety-critical functions from other domains.
  • The sheer volume of code, which has increased by over 100% in recent vehicle generations, escalates development and validation costs. Managing this intricate web of software component management through virtual ECU simulation and other advanced tools is essential, as failure to do so can increase post-launch patch deployments by over 50%.
  • The underlying automotive ethernet and real-time operating system must also be secured to prevent vulnerabilities.

Exclusive Technavio Analysis on Customer Landscape

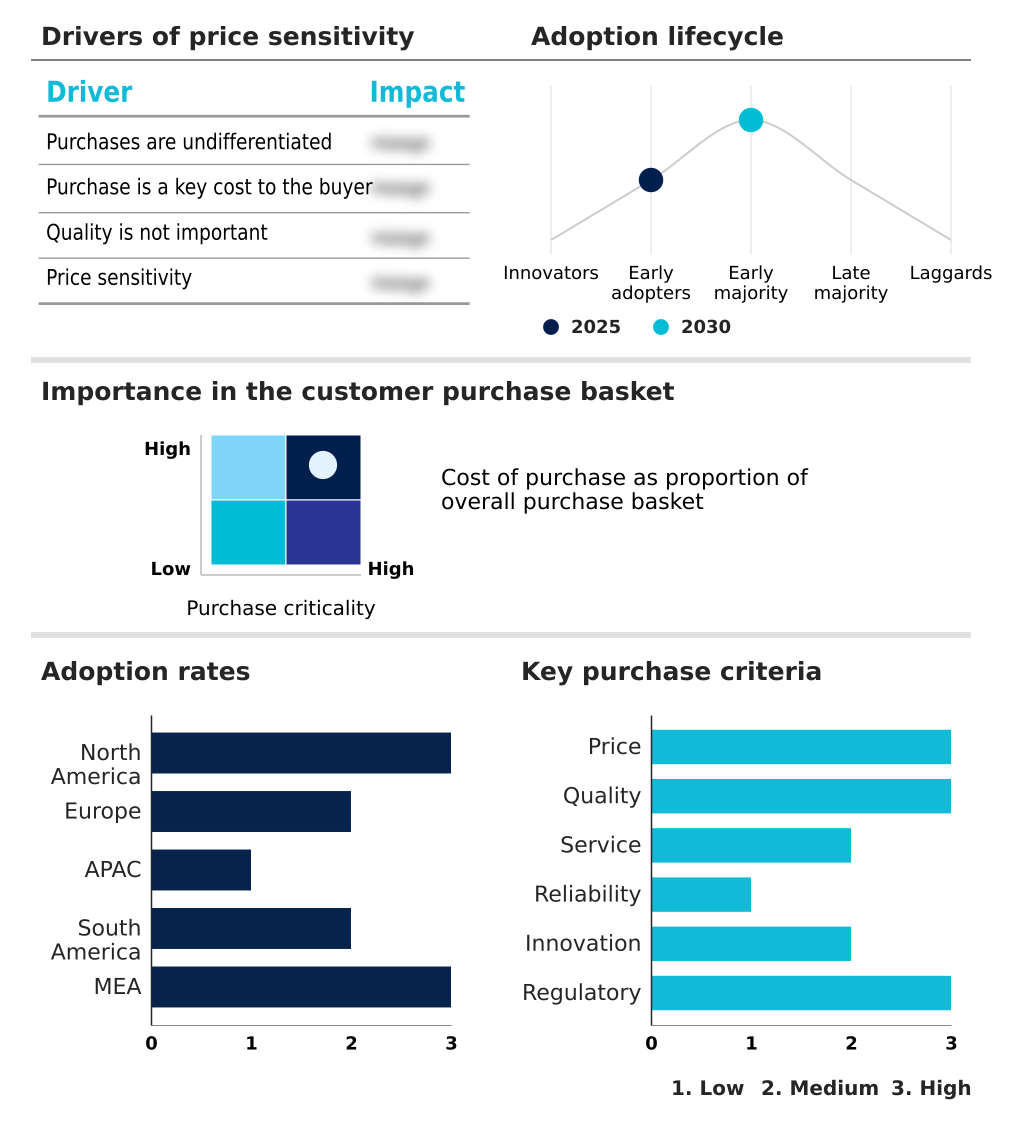
The software-defined vehicle (sdv) market forecasting report includes the adoption lifecycle of the market, covering from the innovator’s stage to the laggard’s stage. It focuses on adoption rates in different regions based on penetration. Furthermore, the software-defined vehicle (sdv) market report also includes key purchase criteria and drivers of price sensitivity to help companies evaluate and develop their market growth analysis strategies.

Customer Landscape of Software-defined Vehicle (SDV) Industry

Competitive Landscape

Companies are implementing various strategies, such as strategic alliances, software-defined vehicle (sdv) market forecast, partnerships, mergers and acquisitions, geographical expansion, and product/service launches, to enhance their presence in the industry.

Arm Ltd. - A diverse range of companies, from semiconductor manufacturers to embedded software specialists and major Tier-1 suppliers, provide critical solutions for the evolving automotive ecosystem.

The industry research and growth report includes detailed analyses of the competitive landscape of the market and information about key companies, including:

  • Arm Ltd.
  • Arorian Technologies GmbH
  • BlackBerry Ltd.
  • Bluekei Solutions Pvt.Ltd.
  • Continental AG
  • ETAS GmbH
  • Expleo Group SAS
  • Keysight Technologies Inc.
  • Larsen and Toubro Ltd.
  • MulticoreWare Inc.
  • NCC Group Plc
  • NTT DATA Corp.
  • NXP Semiconductors NV
  • Real-Time Innovations Inc.
  • Robert Bosch GmbH
  • Samsung Electronics Co. Ltd.
  • Siemens AG
  • u blox AG
  • Vector Informatik GmbH

Qualitative and quantitative analysis of companies has been conducted to help clients understand the wider business environment as well as the strengths and weaknesses of key industry players. Data is qualitatively analyzed to categorize companies as pure play, category-focused, industry-focused, and diversified; it is quantitatively analyzed to categorize companies as dominant, leading, strong, tentative, and weak.

Recent Development and News in Software-defined vehicle (sdv) market

  • In May 2025, BlackBerry Ltd expanded its QNX hypervisor capabilities by launching QNX Hypervisor 8.0, a new embedded virtualization solution designed to streamline and accelerate development across automotive and IoT systems.
  • In January 2025, Intel announced its expanded automotive technology portfolio, including an adaptive control solution and a virtual development environment with AWS to help automakers transition to electric and software-defined vehicles.
  • In June 2024, NXP Semiconductors NV introduced its S32 CoreRide platform, offering automakers a unified approach to manage hardware, software, and safety functions for software-defined vehicle development.
  • In May 2024, BlackBerry Ltd and ETAS GmbH expanded their partnership to jointly market a solution aimed at accelerating the development of safety-critical functions for next-generation software-defined vehicles.

Dive into Technavio’s robust research methodology, blending expert interviews, extensive data synthesis, and validated models for unparalleled Software-defined Vehicle (SDV) Market insights. See full methodology.

Market Scope
Page number 297
Base year 2025
Historic period 2020-2024
Forecast period 2026-2030
Growth momentum & CAGR Accelerate at a CAGR of 27.2%
Market growth 2026-2030 USD 146995.7 million
Market structure Fragmented
YoY growth 2025-2026(%) 23.4%
Key countries US, Canada, Mexico, Germany, France, UK, Italy, Spain, The Netherlands, China, Japan, South Korea, India, Indonesia, Australia, Brazil, Argentina, Chile, UAE, Saudi Arabia, South Africa, Egypt and Morocco
Competitive landscape Leading Companies, Market Positioning of Companies, Competitive Strategies, and Industry Risks

Request Free Sample

Research Analyst Overview

  • The market's evolution is centered on the shift to a centralized E/E architecture, which serves as the foundation for innovation. This architectural change enables a complete software-hardware decoupling, facilitated by middleware layer abstraction and a dedicated vehicle operating system. Such a setup is crucial for deploying an advanced AI-driven mobility platform and sophisticated smart cockpit technology.
  • Key functionalities like over-the-air updates and predictive maintenance algorithms depend on this software-centric approach. From a boardroom perspective, this transformation directly impacts long-term revenue strategy, moving from one-time sales to continuous monetization through subscription services. The adoption of service-oriented architecture and an automotive hypervisor is critical for managing system complexity.
  • Ensuring compliance with ISO 26262 functional safety and UN R155 cybersecurity standards during embedded software development is paramount, with a focus on high-performance computing to run complex sensor fusion algorithms. This approach has led to a 30% reduction in diagnostic resolution times, showcasing tangible operational improvements.
  • The entire ecosystem, from the automotive digital twin and automotive ethernet to the domain controller unit and real-time operating system, is being re-engineered.

What are the Key Data Covered in this Software-defined Vehicle (SDV) Market Research and Growth Report?

  • What is the expected growth of the Software-defined Vehicle (SDV) Market between 2026 and 2030?

    • USD 147.00 billion, at a CAGR of 27.2%

  • What segmentation does the market report cover?

    • The report is segmented by Type (Semi-SDV, and Full SDV), Vehicle Type (Passenger cars, and Commercial vehicles), Application (Powertrain control, Advanced driver-assistance systems (ADAS), Infotainment and connectivity, and Others) and Geography (North America, Europe, APAC, South America, Middle East and Africa)

  • Which regions are analyzed in the report?

    • North America, Europe, APAC, South America and Middle East and Africa

  • What are the key growth drivers and market challenges?

    • Increasing demand for autonomous vehicles, Decline in automotive production due to global shortage of semiconductor chips

  • Who are the major players in the Software-defined Vehicle (SDV) Market?

    • Arm Ltd., Arorian Technologies GmbH, BlackBerry Ltd., Bluekei Solutions Pvt.Ltd., Continental AG, ETAS GmbH, Expleo Group SAS, Keysight Technologies Inc., Larsen and Toubro Ltd., MulticoreWare Inc., NCC Group Plc, NTT DATA Corp., NXP Semiconductors NV, Real-Time Innovations Inc. , Robert Bosch GmbH, Samsung Electronics Co. Ltd., Siemens AG, u blox AG and Vector Informatik GmbH

Market Research Insights

  • The market is defined by a strategic E/E architecture transformation, where OEMs pursue software-first development to deliver a next-generation user experience. This shift enables new business models centered on subscription-based features and continuous integration/continuous deployment pipelines, which can accelerate feature rollout by up to 40%.
  • The adoption of cloud-native automotive software and intelligent vehicle platforms supports this evolution, providing the backbone for advanced connected car services. Managing the complex automotive software stack is a critical focus, with successful integration leading to a 25% improvement in diagnostic accuracy.
  • As the industry moves toward the AI-defined vehicle, the focus on a cohesive software component management strategy becomes paramount for sustaining innovation and market differentiation.

We can help! Our analysts can customize this software-defined vehicle (sdv) market research report to meet your requirements.

Get in touch

1. Executive Summary

1.1 Market overview

Executive Summary - Chart on Market Overview
Executive Summary - Data Table on Market Overview
Executive Summary - Chart on Global Market Characteristics
Executive Summary - Chart on Market by Geography
Executive Summary - Chart on Market Segmentation by Type
Executive Summary - Chart on Market Segmentation by Vehicle Type
Executive Summary - Chart on Market Segmentation by Application
Executive Summary - Chart on Incremental Growth
Executive Summary - Data Table on Incremental Growth
Executive Summary - Chart on Company Market Positioning

2. Technavio Analysis

2.1 Analysis of price sensitivity, lifecycle, customer purchase basket, adoption rates, and purchase criteria

2.2 Criticality of inputs and Factors of differentiation

Chart on Overview on criticality of inputs and factors of differentiation

2.3 Factors of disruption

Chart on Overview on factors of disruption

2.4 Impact of drivers and challenges

Chart on Impact of drivers and challenges in 2025 and 2030

3. Market Landscape

3.1 Market ecosystem

Chart on Parent Market
Data Table on - Parent Market

3.2 Market characteristics

Chart on Market characteristics analysis

3.3 Value chain analysis

Chart on Value chain analysis

4. Market Sizing

4.1 Market definition

Data Table on Offerings of companies included in the market definition

4.2 Market segment analysis

Market segments

4.3 Market size 2025

4.4 Market outlook: Forecast for 2025-2030

Chart on Global - Market size and forecast 2025-2030 ($ million)
Data Table on Global - Market size and forecast 2025-2030 ($ million)
Chart on Global Market: Year-over-year growth 2025-2030 (%)
Data Table on Global Market: Year-over-year growth 2025-2030 (%)

5. Historic Market Size

5.1 Global Software-Defined Vehicle (SDV) Market 2020 - 2024

Historic Market Size - Data Table on Global Software-Defined Vehicle (SDV) Market 2020 - 2024 ($ million)

5.2 Type segment analysis 2020 - 2024

Historic Market Size - Type Segment 2020 - 2024 ($ million)

5.3 Vehicle Type segment analysis 2020 - 2024

Historic Market Size - Vehicle Type Segment 2020 - 2024 ($ million)

5.4 Application segment analysis 2020 - 2024

Historic Market Size - Application Segment 2020 - 2024 ($ million)

5.5 Geography segment analysis 2020 - 2024

Historic Market Size - Geography Segment 2020 - 2024 ($ million)

5.6 Country segment analysis 2020 - 2024

Historic Market Size - Country Segment 2020 - 2024 ($ million)

6. Qualitative Analysis

6.1 Impact of AI in the global software-defined vehicle (SDV) market

7. Five Forces Analysis

7.1 Five forces summary

Five forces analysis - Comparison between 2025 and 2030

7.2 Bargaining power of buyers

Bargaining power of buyers - Impact of key factors 2025 and 2030

7.3 Bargaining power of suppliers

Bargaining power of suppliers - Impact of key factors in 2025 and 2030

7.4 Threat of new entrants

Threat of new entrants - Impact of key factors in 2025 and 2030

7.5 Threat of substitutes

Threat of substitutes - Impact of key factors in 2025 and 2030

7.6 Threat of rivalry

Threat of rivalry - Impact of key factors in 2025 and 2030

7.7 Market condition

Chart on Market condition - Five forces 2025 and 2030

8. Market Segmentation by Type

8.1 Market segments

Chart on Type - Market share 2025-2030 (%)
Data Table on Type - Market share 2025-2030 (%)

8.2 Comparison by Type

Chart on Comparison by Type
Data Table on Comparison by Type

8.3 Semi-SDV - Market size and forecast 2025-2030

Chart on Semi-SDV - Market size and forecast 2025-2030 ($ million)
Data Table on Semi-SDV - Market size and forecast 2025-2030 ($ million)
Chart on Semi-SDV - Year-over-year growth 2025-2030 (%)
Data Table on Semi-SDV - Year-over-year growth 2025-2030 (%)

8.4 Full SDV - Market size and forecast 2025-2030

Chart on Full SDV - Market size and forecast 2025-2030 ($ million)
Data Table on Full SDV - Market size and forecast 2025-2030 ($ million)
Chart on Full SDV - Year-over-year growth 2025-2030 (%)
Data Table on Full SDV - Year-over-year growth 2025-2030 (%)

8.5 Market opportunity by Type

Market opportunity by Type ($ million)
Data Table on Market opportunity by Type ($ million)

9. Market Segmentation by Vehicle Type

9.1 Market segments

Chart on Vehicle Type - Market share 2025-2030 (%)
Data Table on Vehicle Type - Market share 2025-2030 (%)

9.2 Comparison by Vehicle Type

Chart on Comparison by Vehicle Type
Data Table on Comparison by Vehicle Type

9.3 Passenger cars - Market size and forecast 2025-2030

Chart on Passenger cars - Market size and forecast 2025-2030 ($ million)
Data Table on Passenger cars - Market size and forecast 2025-2030 ($ million)
Chart on Passenger cars - Year-over-year growth 2025-2030 (%)
Data Table on Passenger cars - Year-over-year growth 2025-2030 (%)

9.4 Commercial vehicles - Market size and forecast 2025-2030

Chart on Commercial vehicles - Market size and forecast 2025-2030 ($ million)
Data Table on Commercial vehicles - Market size and forecast 2025-2030 ($ million)
Chart on Commercial vehicles - Year-over-year growth 2025-2030 (%)
Data Table on Commercial vehicles - Year-over-year growth 2025-2030 (%)

9.5 Market opportunity by Vehicle Type

Market opportunity by Vehicle Type ($ million)
Data Table on Market opportunity by Vehicle Type ($ million)

10. Market Segmentation by Application

10.1 Market segments

Chart on Application - Market share 2025-2030 (%)
Data Table on Application - Market share 2025-2030 (%)

10.2 Comparison by Application

Chart on Comparison by Application
Data Table on Comparison by Application

10.3 Powertrain control - Market size and forecast 2025-2030

Chart on Powertrain control - Market size and forecast 2025-2030 ($ million)
Data Table on Powertrain control - Market size and forecast 2025-2030 ($ million)
Chart on Powertrain control - Year-over-year growth 2025-2030 (%)
Data Table on Powertrain control - Year-over-year growth 2025-2030 (%)

10.4 Advanced driver-assistance systems (ADAS) - Market size and forecast 2025-2030

Chart on Advanced driver-assistance systems (ADAS) - Market size and forecast 2025-2030 ($ million)
Data Table on Advanced driver-assistance systems (ADAS) - Market size and forecast 2025-2030 ($ million)
Chart on Advanced driver-assistance systems (ADAS) - Year-over-year growth 2025-2030 (%)
Data Table on Advanced driver-assistance systems (ADAS) - Year-over-year growth 2025-2030 (%)

10.5 Infotainment and connectivity - Market size and forecast 2025-2030

Chart on Infotainment and connectivity - Market size and forecast 2025-2030 ($ million)
Data Table on Infotainment and connectivity - Market size and forecast 2025-2030 ($ million)
Chart on Infotainment and connectivity - Year-over-year growth 2025-2030 (%)
Data Table on Infotainment and connectivity - Year-over-year growth 2025-2030 (%)

10.6 Others - Market size and forecast 2025-2030

Chart on Others - Market size and forecast 2025-2030 ($ million)
Data Table on Others - Market size and forecast 2025-2030 ($ million)
Chart on Others - Year-over-year growth 2025-2030 (%)
Data Table on Others - Year-over-year growth 2025-2030 (%)

10.7 Market opportunity by Application

Market opportunity by Application ($ million)
Data Table on Market opportunity by Application ($ million)

11. Customer Landscape

11.1 Customer landscape overview

Analysis of price sensitivity, lifecycle, customer purchase basket, adoption rates, and purchase criteria

12. Geographic Landscape

12.1 Geographic segmentation

Chart on Market share by geography 2025-2030 (%)
Data Table on Market share by geography 2025-2030 (%)

12.2 Geographic comparison

Chart on Geographic comparison
Data Table on Geographic comparison

12.3 North America - Market size and forecast 2025-2030

Chart on North America - Market size and forecast 2025-2030 ($ million)
Data Table on North America - Market size and forecast 2025-2030 ($ million)
Chart on North America - Year-over-year growth 2025-2030 (%)
Data Table on North America - Year-over-year growth 2025-2030 (%)
Chart on Regional Comparison - North America
Data Table on Regional Comparison - North America

12.3.1 US - Market size and forecast 2025-2030

Chart on US - Market size and forecast 2025-2030 ($ million)
Data Table on US - Market size and forecast 2025-2030 ($ million)
Chart on US - Year-over-year growth 2025-2030 (%)
Data Table on US - Year-over-year growth 2025-2030 (%)

12.3.2 Canada - Market size and forecast 2025-2030

Chart on Canada - Market size and forecast 2025-2030 ($ million)
Data Table on Canada - Market size and forecast 2025-2030 ($ million)
Chart on Canada - Year-over-year growth 2025-2030 (%)
Data Table on Canada - Year-over-year growth 2025-2030 (%)

12.3.3 Mexico - Market size and forecast 2025-2030

Chart on Mexico - Market size and forecast 2025-2030 ($ million)
Data Table on Mexico - Market size and forecast 2025-2030 ($ million)
Chart on Mexico - Year-over-year growth 2025-2030 (%)
Data Table on Mexico - Year-over-year growth 2025-2030 (%)

12.4 Europe - Market size and forecast 2025-2030

Chart on Europe - Market size and forecast 2025-2030 ($ million)
Data Table on Europe - Market size and forecast 2025-2030 ($ million)
Chart on Europe - Year-over-year growth 2025-2030 (%)
Data Table on Europe - Year-over-year growth 2025-2030 (%)
Chart on Regional Comparison - Europe
Data Table on Regional Comparison - Europe

12.4.1 Germany - Market size and forecast 2025-2030

Chart on Germany - Market size and forecast 2025-2030 ($ million)
Data Table on Germany - Market size and forecast 2025-2030 ($ million)
Chart on Germany - Year-over-year growth 2025-2030 (%)
Data Table on Germany - Year-over-year growth 2025-2030 (%)

12.4.2 France - Market size and forecast 2025-2030

Chart on France - Market size and forecast 2025-2030 ($ million)
Data Table on France - Market size and forecast 2025-2030 ($ million)
Chart on France - Year-over-year growth 2025-2030 (%)
Data Table on France - Year-over-year growth 2025-2030 (%)

12.4.3 UK - Market size and forecast 2025-2030

Chart on UK - Market size and forecast 2025-2030 ($ million)
Data Table on UK - Market size and forecast 2025-2030 ($ million)
Chart on UK - Year-over-year growth 2025-2030 (%)
Data Table on UK - Year-over-year growth 2025-2030 (%)

12.4.4 Italy - Market size and forecast 2025-2030

Chart on Italy - Market size and forecast 2025-2030 ($ million)
Data Table on Italy - Market size and forecast 2025-2030 ($ million)
Chart on Italy - Year-over-year growth 2025-2030 (%)
Data Table on Italy - Year-over-year growth 2025-2030 (%)

12.4.5 Spain - Market size and forecast 2025-2030

Chart on Spain - Market size and forecast 2025-2030 ($ million)
Data Table on Spain - Market size and forecast 2025-2030 ($ million)
Chart on Spain - Year-over-year growth 2025-2030 (%)
Data Table on Spain - Year-over-year growth 2025-2030 (%)

12.4.6 The Netherlands - Market size and forecast 2025-2030

Chart on The Netherlands - Market size and forecast 2025-2030 ($ million)
Data Table on The Netherlands - Market size and forecast 2025-2030 ($ million)
Chart on The Netherlands - Year-over-year growth 2025-2030 (%)
Data Table on The Netherlands - Year-over-year growth 2025-2030 (%)

12.5 APAC - Market size and forecast 2025-2030

Chart on APAC - Market size and forecast 2025-2030 ($ million)
Data Table on APAC - Market size and forecast 2025-2030 ($ million)
Chart on APAC - Year-over-year growth 2025-2030 (%)
Data Table on APAC - Year-over-year growth 2025-2030 (%)
Chart on Regional Comparison - APAC
Data Table on Regional Comparison - APAC

12.5.1 China - Market size and forecast 2025-2030

Chart on China - Market size and forecast 2025-2030 ($ million)
Data Table on China - Market size and forecast 2025-2030 ($ million)
Chart on China - Year-over-year growth 2025-2030 (%)
Data Table on China - Year-over-year growth 2025-2030 (%)

12.5.2 Japan - Market size and forecast 2025-2030

Chart on Japan - Market size and forecast 2025-2030 ($ million)
Data Table on Japan - Market size and forecast 2025-2030 ($ million)
Chart on Japan - Year-over-year growth 2025-2030 (%)
Data Table on Japan - Year-over-year growth 2025-2030 (%)

12.5.3 South Korea - Market size and forecast 2025-2030

Chart on South Korea - Market size and forecast 2025-2030 ($ million)
Data Table on South Korea - Market size and forecast 2025-2030 ($ million)
Chart on South Korea - Year-over-year growth 2025-2030 (%)
Data Table on South Korea - Year-over-year growth 2025-2030 (%)

12.5.4 India - Market size and forecast 2025-2030

Chart on India - Market size and forecast 2025-2030 ($ million)
Data Table on India - Market size and forecast 2025-2030 ($ million)
Chart on India - Year-over-year growth 2025-2030 (%)
Data Table on India - Year-over-year growth 2025-2030 (%)

12.5.5 Indonesia - Market size and forecast 2025-2030

Chart on Indonesia - Market size and forecast 2025-2030 ($ million)
Data Table on Indonesia - Market size and forecast 2025-2030 ($ million)
Chart on Indonesia - Year-over-year growth 2025-2030 (%)
Data Table on Indonesia - Year-over-year growth 2025-2030 (%)

12.5.6 Australia - Market size and forecast 2025-2030

Chart on Australia - Market size and forecast 2025-2030 ($ million)
Data Table on Australia - Market size and forecast 2025-2030 ($ million)
Chart on Australia - Year-over-year growth 2025-2030 (%)
Data Table on Australia - Year-over-year growth 2025-2030 (%)

12.6 South America - Market size and forecast 2025-2030

Chart on South America - Market size and forecast 2025-2030 ($ million)
Data Table on South America - Market size and forecast 2025-2030 ($ million)
Chart on South America - Year-over-year growth 2025-2030 (%)
Data Table on South America - Year-over-year growth 2025-2030 (%)
Chart on Regional Comparison - South America
Data Table on Regional Comparison - South America

12.6.1 Brazil - Market size and forecast 2025-2030

Chart on Brazil - Market size and forecast 2025-2030 ($ million)
Data Table on Brazil - Market size and forecast 2025-2030 ($ million)
Chart on Brazil - Year-over-year growth 2025-2030 (%)
Data Table on Brazil - Year-over-year growth 2025-2030 (%)

12.6.2 Argentina - Market size and forecast 2025-2030

Chart on Argentina - Market size and forecast 2025-2030 ($ million)
Data Table on Argentina - Market size and forecast 2025-2030 ($ million)
Chart on Argentina - Year-over-year growth 2025-2030 (%)
Data Table on Argentina - Year-over-year growth 2025-2030 (%)

12.6.3 Chile - Market size and forecast 2025-2030

Chart on Chile - Market size and forecast 2025-2030 ($ million)
Data Table on Chile - Market size and forecast 2025-2030 ($ million)
Chart on Chile - Year-over-year growth 2025-2030 (%)
Data Table on Chile - Year-over-year growth 2025-2030 (%)

12.7 Middle East and Africa - Market size and forecast 2025-2030

Chart on Middle East and Africa - Market size and forecast 2025-2030 ($ million)
Data Table on Middle East and Africa - Market size and forecast 2025-2030 ($ million)
Chart on Middle East and Africa - Year-over-year growth 2025-2030 (%)
Data Table on Middle East and Africa - Year-over-year growth 2025-2030 (%)
Chart on Regional Comparison - Middle East and Africa
Data Table on Regional Comparison - Middle East and Africa

12.7.1 UAE - Market size and forecast 2025-2030

Chart on UAE - Market size and forecast 2025-2030 ($ million)
Data Table on UAE - Market size and forecast 2025-2030 ($ million)
Chart on UAE - Year-over-year growth 2025-2030 (%)
Data Table on UAE - Year-over-year growth 2025-2030 (%)

12.7.2 Saudi Arabia - Market size and forecast 2025-2030

Chart on Saudi Arabia - Market size and forecast 2025-2030 ($ million)
Data Table on Saudi Arabia - Market size and forecast 2025-2030 ($ million)
Chart on Saudi Arabia - Year-over-year growth 2025-2030 (%)
Data Table on Saudi Arabia - Year-over-year growth 2025-2030 (%)

12.7.3 South Africa - Market size and forecast 2025-2030

Chart on South Africa - Market size and forecast 2025-2030 ($ million)
Data Table on South Africa - Market size and forecast 2025-2030 ($ million)
Chart on South Africa - Year-over-year growth 2025-2030 (%)
Data Table on South Africa - Year-over-year growth 2025-2030 (%)

12.7.4 Egypt - Market size and forecast 2025-2030

Chart on Egypt - Market size and forecast 2025-2030 ($ million)
Data Table on Egypt - Market size and forecast 2025-2030 ($ million)
Chart on Egypt - Year-over-year growth 2025-2030 (%)
Data Table on Egypt - Year-over-year growth 2025-2030 (%)

12.7.5 Morocco - Market size and forecast 2025-2030

Chart on Morocco - Market size and forecast 2025-2030 ($ million)
Data Table on Morocco - Market size and forecast 2025-2030 ($ million)
Chart on Morocco - Year-over-year growth 2025-2030 (%)
Data Table on Morocco - Year-over-year growth 2025-2030 (%)

12.8 Market opportunity by geography

Market opportunity by geography ($ million)
Data Tables on Market opportunity by geography ($ million)

13. Drivers, Challenges, and Opportunity

13.1 Market drivers

Increasing demand for autonomous vehicles
Growing demand for differentiated in-car experiences
Introduction of vehicle infotainment systems

13.2 Market challenges

Decline in automotive production due to global shortage of semiconductor chips
Concerns related to cybersecurity in SDV
Rising complexity in automotive software architecture

13.3 Impact of drivers and challenges

Impact of drivers and challenges in 2025 and 2030

13.4 Market opportunities

Integration of advanced safety technologies in luxury cars
Over-the-air (OTA) updates for software components
Growing focus on software-defined electric vehicles (EVs)

14. Competitive Landscape

14.1 Overview

14.2

Overview on criticality of inputs and factors of differentiation

14.3 Landscape disruption

Overview on factors of disruption

14.4 Industry risks

Impact of key risks on business

15. Competitive Analysis

15.1 Companies profiled

Companies covered

15.2 Company ranking index

15.3 Market positioning of companies

Matrix on companies position and classification

15.4 Arm Ltd.

Arm Ltd. - Overview
Arm Ltd. - Product / Service
Arm Ltd. - Key offerings
SWOT

15.5 BlackBerry Ltd.

BlackBerry Ltd. - Overview
BlackBerry Ltd. - Business segments
BlackBerry Ltd. - Key offerings
BlackBerry Ltd. - Segment focus
SWOT

15.6 Continental AG

Continental AG - Overview
Continental AG - Business segments
Continental AG - Key news
Continental AG - Key offerings
Continental AG - Segment focus
SWOT

15.7 ETAS GmbH

ETAS GmbH - Overview
ETAS GmbH - Product / Service
ETAS GmbH - Key offerings
SWOT

15.8 Expleo Group SAS

Expleo Group SAS - Overview
Expleo Group SAS - Product / Service
Expleo Group SAS - Key offerings
SWOT

15.9 Keysight Technologies Inc.

Keysight Technologies Inc. - Overview
Keysight Technologies Inc. - Business segments
Keysight Technologies Inc. - Key news
Keysight Technologies Inc. - Key offerings
Keysight Technologies Inc. - Segment focus
SWOT

15.10 Larsen and Toubro Ltd.

Larsen and Toubro Ltd. - Overview
Larsen and Toubro Ltd. - Business segments
Larsen and Toubro Ltd. - Key offerings
Larsen and Toubro Ltd. - Segment focus
SWOT

15.11 NCC Group Plc

NCC Group Plc - Overview
NCC Group Plc - Product / Service
NCC Group Plc - Key offerings
SWOT

15.12 NTT DATA Corp.

NTT DATA Corp. - Overview
NTT DATA Corp. - Product / Service
NTT DATA Corp. - Key news
NTT DATA Corp. - Key offerings
SWOT

15.13 NXP Semiconductors NV

NXP Semiconductors NV - Overview
NXP Semiconductors NV - Product / Service
NXP Semiconductors NV - Key offerings
SWOT

15.14 Robert Bosch GmbH

Robert Bosch GmbH - Overview
Robert Bosch GmbH - Product / Service
Robert Bosch GmbH - Key news
Robert Bosch GmbH - Key offerings
SWOT

15.15 Samsung Electronics Co. Ltd.

Samsung Electronics Co. Ltd. - Overview
Samsung Electronics Co. Ltd. - Business segments
Samsung Electronics Co. Ltd. - Key news
Samsung Electronics Co. Ltd. - Key offerings
Samsung Electronics Co. Ltd. - Segment focus
SWOT

15.16 Siemens AG

Siemens AG - Overview
Siemens AG - Business segments
Siemens AG - Key news
Siemens AG - Key offerings
Siemens AG - Segment focus
SWOT

15.17 u blox AG

u blox AG - Overview
u blox AG - Business segments
u blox AG - Key offerings
u blox AG - Segment focus
SWOT

15.18 Vector Informatik GmbH

Vector Informatik GmbH - Overview
Vector Informatik GmbH - Product / Service
Vector Informatik GmbH - Key offerings
SWOT

16. Appendix

16.1 Scope of the report

Market definition
Objectives
Notes and caveats

16.2 Inclusions and exclusions checklist

Inclusions checklist
Exclusions checklist

16.3 Currency conversion rates for US$

16.4 Research methodology

16.5 Data procurement

Information sources

16.6 Data validation

16.7 Validation techniques employed for market sizing

16.8 Data synthesis

16.9 360 degree market analysis

16.10 List of abbreviations

Research Methodology

Technavio presents a detailed picture of the market by way of study, synthesis, and summation of data from multiple sources. The analysts have presented the various facets of the market with a particular focus on identifying the key industry influencers. The data thus presented is comprehensive, reliable, and the result of extensive research, both primary and secondary.

INFORMATION SOURCES

Primary sources

  • Manufacturers and suppliers
  • Channel partners
  • Industry experts
  • Strategic decision makers

Secondary sources

  • Industry journals and periodicals
  • Government data
  • Financial reports of key industry players
  • Historical data
  • Press releases

DATA ANALYSIS

Data Synthesis

  • Collation of data
  • Estimation of key figures
  • Analysis of derived insights

Data Validation

  • Triangulation with data models
  • Reference against proprietary databases
  • Corroboration with industry experts

REPORT WRITING

Qualitative

  • Market drivers
  • Market challenges
  • Market trends
  • Five forces analysis

Quantitative

  • Market size and forecast
  • Market segmentation
  • Geographical insights
  • Competitive landscape

Interested in this report?

Get your sample now to see our research methodology and insights!

Download Now

Frequently Asked Questions

Software-defined Vehicle (SDV) market growth will increase by USD 146995.7 million during 2026-2030.

The Software-defined Vehicle (SDV) market is expected to grow at a CAGR of 27.2% during 2026-2030.

Software-defined Vehicle (SDV) market is segmented by Type (Semi-SDV, Full SDV) Vehicle type (Passenger cars, Commercial vehicles) Application (Powertrain control, Advanced driver-assistance systems (ADAS), Infotainment and connectivity, Others)

Arm Ltd., Arorian Technologies GmbH, BlackBerry Ltd., Bluekei Solutions Pvt.Ltd., Continental AG, ETAS GmbH, Expleo Group SAS, Keysight Technologies Inc., Larsen and Toubro Ltd., MulticoreWare Inc., NCC Group Plc, NTT DATA Corp., NXP Semiconductors NV, Real-Time Innovations Inc. , Robert Bosch GmbH, Samsung Electronics Co. Ltd., Siemens AG, u blox AG, Vector Informatik GmbH are a few of the key vendors in the Software-defined Vehicle (SDV) market.

North America will register the highest growth rate of 38.4% among the other regions. Therefore, the Software-defined Vehicle (SDV) market in North America is expected to garner significant business opportunities for the vendors during the forecast period.

US, Canada, Mexico, Germany, France, UK, Italy, Spain, The Netherlands, China, Japan, South Korea, India, Indonesia, Australia, Brazil, Argentina, Chile, UAE, Saudi Arabia, South Africa, Egypt, Morocco

  • Increasing demand for autonomous vehicles is the driving factor this market.

The Software-defined Vehicle (SDV) market vendors should focus on grabbing business opportunities from the Type segment as it accounted for the largest market share in the base year.
RIA - Research AI Assistant
Ask RIA