Solar Central Inverters Market Analysis APAC, Europe, North America, South America, Middle East and Africa - US, China, Vietnam, Japan, Australia - Size and Forecast 2024-2028

Solar Central Inverters Market Analysis APAC, Europe, North America, South America, Middle East and Africa - US, China, Vietnam, Japan, Australia - Size and Forecast 2024-2028

Published: Jun 2024 148 Pages SKU: IRTNTR73554

Market Overview at a Glance

$3.68 B
Market Opportunity
14.99%
CAGR
13.22
YoY growth 2023-2024(%)

Solar Central Inverters Market Size 2024-2028 

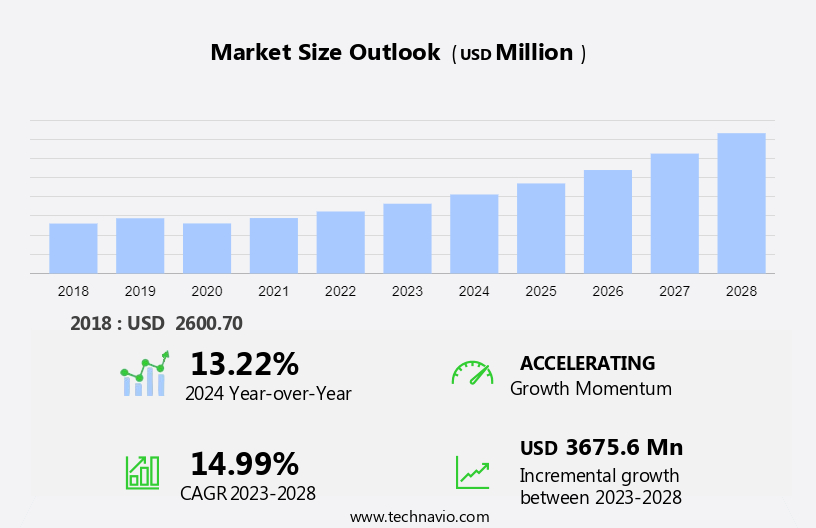
The solar central inverters market size is forecast to increase by USD 3.68 billion at a CAGR of 14.99% between 2023 and 2028.

  • The market is experiencing significant growth due to the rising investment in renewable energy sources and the increasing demand for clean energy technologies. This trend is driven by governments and businesses seeking to reduce their carbon footprint and reliance on fossil fuels. However, the market also faces challenges from alternative sources of energy, such as wind and hydroelectric power, which can offer competitive pricing and energy production capabilities. To remain competitive, solar central inverter manufacturers must focus on improving efficiency, reducing costs, and offering flexible solutions to meet the diverse needs of customers. Additionally, the integration of energy storage systems and the development of smart grid technologies are expected to provide new opportunities for market growth. Overall, the market is poised for continued expansion as the global shift towards renewable energy gains momentum.

What will be the Size of the Market During the Forecast Period?

Solar Central Inverters Market Size

 Request Free Sample

  • Solar inverters play a crucial role in the conversion of direct current (DC) power generated by solar panels into alternating current (AC) electricity suitable for industrial, commercial, and residential applications. Central inverters, also known as utility-scale or string inverters, are a popular choice for large-scale solar photovoltaic (PV) systems. Central inverters are designed to handle DC power from multiple solar panels and convert it into AC power for grid connection. In utilities applications, both PV inverter and central inverter are commonly used to convert solar energy into electricity, with string inverter providing a more modular solution, while pure sine wave technology ensures smooth and efficient power delivery for on-grid solar systems. They are typically used in on-grid solar systems and can support various applications, including home appliances and utilities. Central inverters offer several advantages, such as high efficiency, cost-effectiveness, and ease of installation.
  • On the other hand, microinverters are used in smaller residential solar systems and are installed at the individual solar panel level. They convert DC power from each panel into AC power independently, providing maximum power point tracking for each panel and reducing the impact of shading and other performance issues. Both central and micro inverters have their unique advantages and applications. Central inverters are suitable for industrial and commercial solar installations, while microinverters are ideal for residential solar systems. The market is expected to grow significantly due to the increasing demand for renewable energy sources and the ongoing shift towards decentralized power generation.

How is this market segmented and which is the largest segment?

The market research report provides comprehensive data (region-wise segment analysis), with forecasts and estimates in "USD billion" for the period 2024-2028, as well as historical data from 2018-2022 for the following segments.

  • Application
    • Utility
    • Non-utility
  • Geography
    • APAC
      • China
      • Japan
      • Vietnam
    • Europe
    • North America
      • US
    • South America
    • Middle East and Africa

By Application Insights

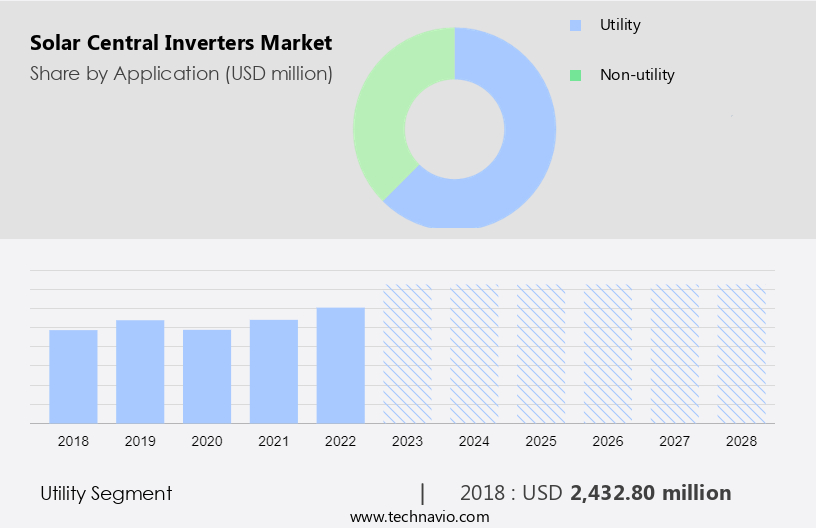
  • The utility segment is estimated to witness significant growth during the forecast period.

The utility segment dominated the market in 2023. Utility-scale solar projects, defined as those with a generation capacity of 1 MW or more, accounted for a significant share of the installed solar power capacity worldwide. These projects are driven by government policies and corporate initiatives to expand power generation capacity, meet increasing energy demand, and decrease reliance on the grid. Central inverters are a crucial component of utility-scale solar photovoltaic systems, converting direct current (DC) power from solar panels into alternating current (AC) for grid connection. Key components of central inverters include maximum power point trackers, low-frequency transformers, and BOS (balance of system) components.

Furthermore, input voltage and grid connection standards also play a role in their design and functionality. Central inverters come in various forms, including monolithic and modular designs, with multi-MPPT trackers and master-slave control approaches. Energy storage systems are increasingly being integrated with utility-scale solar projects to ensure continuous power supply and improve grid stability.

Solar Central Inverters Market Size

Get a glance at the market report of share of various segments Request Free Sample

The utility segment was valued at USD 2.43 billion in 2018 and showed a gradual increase during the forecast period.

Regional Analysis

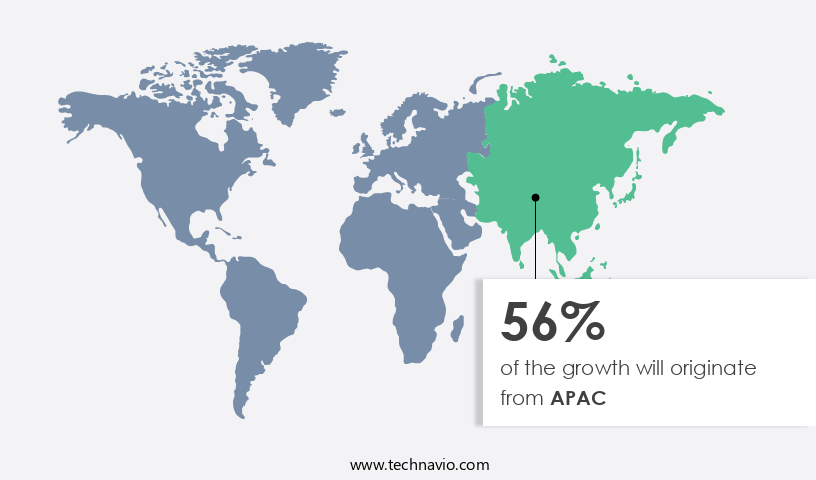
  • APAC is estimated to contribute 56% to the growth of the global market during the forecast period.

Technavio's analysts have elaborately explained the regional trends and drivers that shape the market during the forecast period.

Solar Central Inverters Market Share by Geography

For more insights on the market share of various regions Request Free Sample

The market in Asia Pacific is projected to expand substantially over the forecast period. Key factors fueling this growth include increasing environmental consciousness, escalating energy demand, population growth, and enhancing living standards. Major contributors to the market's expansion will be India, China, and Japan. Government initiatives, such as Feed-in Tariffs (Fit) in China, Japan, India, South Korea, and Thailand, will further propel market growth. China aims to reach a total installed solar energy capacity of up to 90 GW by 2022. This growth is expected to continue as the region's economies develop and prioritize renewable energy sources.

Market Dynamics

Our researchers analyzed the data with 2023 as the base year, along with the key drivers, trends, and challenges. A holistic analysis of drivers will help companies refine their marketing strategies to gain a competitive advantage.

What are the key market drivers leading to the rise in the adoption of Solar Central Inverters Market?

Rising investment in renewables is the key driver of the market.

  • In the evolving energy landscape, solar inverters have emerged as a crucial component in the conversion of solar electricity from DC to AC for both industrial, commercial, and residential applications. Solar inverters are integral to the functioning of photovoltaic (PV) systems, enabling the integration of solar power into the electric grid or providing power backup in off-grid systems. Central inverters, string inverters, and micro inverters are the primary types of solar inverters, each catering to specific requirements. The renewable energy sector's expansion is driven by environmental concerns, government support, and economic incentives. Large buildings, home loans, and home renovation projects offer tax benefits for solar power installation.
  • Business owners are increasingly adopting solar power to reduce electricity bills and ensure reliable power supply, especially in hot-prone regions and rural electrification projects. The solar inverter market is witnessing significant expansion activities, with new product innovations, phase-shift solutions, and panel-level monitoring technologies. Utility-scale solar power plants, solar parks, and solar structures are increasingly adopting large-sized solar inverters for efficient power generation and transmission. The transition to renewable energy is essential for decarbonization and reducing greenhouse gas emissions. Solar energy is becoming increasingly competitive with traditional power sources, with solar capacity expected to reach 1,000 GW in the US by 2030.

What are the market trends shaping the Solar Central Inverters Market?

Growing demand for clean energy technologies is the upcoming trend in the market.

  • The market is experiencing significant growth due to the increasing demand for renewable energy sources and the need for reliable power supply, particularly in the industrial and commercial sectors. Solar inverters, which convert DC power from solar panels into AC power for electricity usage, play a crucial role in the renewable energy sector. Central inverters, which convert DC power from multiple solar panels into AC power, are commonly used in large-scale solar power plants and industrial applications. In the residential sector, homeowners are increasingly adopting solar power for economic and environmental reasons. Solar power reduces carbon emissions and greenhouse gas emissions, making it an attractive option for those concerned about the environment.
  • Solar panels installed on rooftops can provide backup power during power outages, making solar power an essential component of home renovation projects and new home constructions. Homeowners can also benefit from tax incentives and subsidies, making solar power an economically friendly solution. In the commercial sector, businesses are investing in solar power to reduce electricity costs and improve their bottom line. Solar power is also an attractive option for large buildings that require significant power backup. Infrastructural development and government support for renewable energy projects are also driving growth in the Solar Inverter market. The Solar Inverter market is also witnessing expansion activities and new product innovations.

What challenges does the Solar Central Inverters Market face during the growth?

Challenges posed by alternative sources of energy is a key challenge affecting the market growth.

  • The market encompasses the production, sales, and installation of central inverters, a crucial component of solar photovoltaic (PV) systems. Central inverters convert DC power from solar panels into AC power for electricity transmission and distribution. In the US, the solar inverter market is driven by the growing demand for renewable energy, environmental concerns, and government support. Solar power is becoming increasingly economic-friendly for residential and commercial users, with home loans and tax benefits incentivizing home renovation projects. Industrial and commercial buildings, particularly those in hot-prone regions, seek reliable power supply and backup power solutions, further expanding the market. Central inverters support both on-grid and off-grid applications, with on-grid inverters connected to the utility grid and off-grid inverters providing power backup and electrification in rural areas.
  • The market is segmented into single-phase and three-phase, with large-sized solar inverters used in utility-scale applications. String inverters and micro inverters are alternative technologies, but central inverters offer advantages such as panel-level monitoring, lower installation costs, and higher efficiency. The solar inverter market is influenced by several factors, including the expansion of solar power generation, the transmission sector's development, and the growth of renewable energy capacity. Decarbonization efforts and increasing electricity demand are driving the market, as solar energy becomes more competitive with traditional energy sources. Solar parks and solar structures are being constructed, and solar power is being integrated into the electric grid, necessitating the use of central inverters for grid connection and maximum power point tracking.

Exclusive Customer Landscape

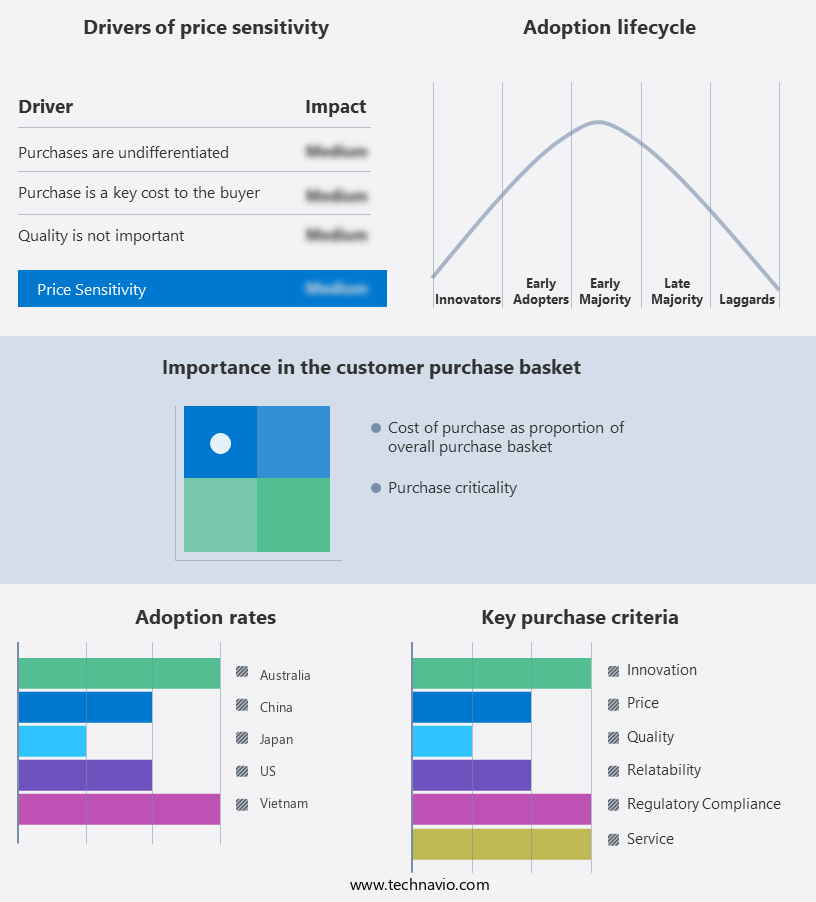
The market forecasting report includes the adoption lifecycle of the market, covering from the innovator's stage to the laggard's stage. It focuses on adoption rates in different regions based on penetration. Furthermore, the market report also includes key purchase criteria and drivers of price sensitivity to help companies evaluate and develop their market growth analysis strategies.

Solar Central Inverters Market Share by Geography

 Customer Landscape

Key Companies & Market Insights

Companies are implementing various strategies, such as strategic alliances, market forecast, partnerships, mergers and acquisitions, geographical expansion, and product/service launches, to enhance their presence in the market. The market research and growth report includes detailed analyses of the competitive landscape of the market and information about key companies, including:

  • ABB Ltd.
  • Delta Electronics Inc.
  • Eaton Corp. Plc
  • Fimer SpA
  • Hitachi Ltd.
  • Huawei Technologies Co. Ltd.
  • Infineon Technologies AG
  • Ingeteam Corp. S.A.
  • OCI Co. Ltd.
  • Shenzen Growatt New Energy Technology Co. Ltd.
  • Siemens AG
  • Sineng Electric Co. Ltd.
  • SMA Solar Technology AG
  • SolarEdge Technologies Inc.
  • Sungrow Power Supply Co. Ltd.
  • Toshiba Corp.
  • Yaskawa Solectria Solar
  • Zhejiang CHINT Electrics Co. Ltd.

Qualitative and quantitative analysis of companies has been conducted to help clients understand the wider business environment as well as the strengths and weaknesses of key market players. Data is qualitatively analyzed to categorize companies as pure play, category-focused, industry-focused, and diversified; it is quantitatively analyzed to categorize companies as dominant, leading, strong, tentative, and weak.

Research Analyst Overview

Solar central inverters play a pivotal role in the conversion of direct current (DC) electricity generated by solar panels into alternating current (AC) electricity that can be used by homes, industries, and commercial establishments. This transition is crucial for the effective integration of solar power into the electrical grid and the reduction of carbon emissions and greenhouse gas (GHG) releases. Central inverters, also known as utility-scale or large-sized solar inverters, are designed to handle high power output and are typically used in industrial, commercial, and utility-scale solar power installations.

Moreover, these inverters are capable of converting DC electricity from multiple solar panels or strings into AC electricity, making them an essential component of solar power generation systems. The renewable energy sector has witnessed significant growth in recent years due to increasing environmental concerns, economic benefits, and government support. Solar power, in particular, has gained immense popularity as a clean and sustainable energy source. Central inverters are a key enabler for this transition, providing reliable power supply and continuous power generation, even in hot, prone regions. Central inverters are also essential for off-grid applications, such as rural electrification projects, where the electrical grid is not available.

Furthermore, these inverters help ensure a stable power supply, enabling businesses and households to operate efficiently and reducing their reliance on traditional energy sources. The expansion of solar power generation capacity has led to the development of new product innovations in the solar inverter market. These include monolithic and modular inverters, multi-MPPT trackers, and master-slave control approaches. These advancements have improved the efficiency and reliability of solar power systems, making them more economically viable for businesses and homeowners. The use of solar inverters is not limited to residential and commercial applications. They are also used in large-scale solar power generation projects, such as solar parks and power plants.

Market Scope

Report Coverage

Details

Page number

148

Base year

2023

Historic period

2018-2022

Forecast period

2024-2028

Growth momentum & CAGR

Accelerate at a CAGR of 14.99%

Market Growth 2024-2028

USD 3.68 billion

Market structure

Fragmented

YoY growth 2023-2024(%)

13.22

Key countries

US, China, Vietnam, Japan, and Australia

Competitive landscape

Leading Companies, Market Positioning of Companies, Competitive Strategies, and Industry Risks

Request Free Sample

What are the Key Data Covered in this Market Research and Growth Report?

  • CAGR of the market during the forecast period
  • Detailed information on factors that will drive the market growth and forecasting between 2024 and 2028
  • Precise estimation of the size of the market  and its contribution of the market in focus to the parent market
  • Accurate predictions about upcoming market growth and trends and changes in consumer behaviour
  • Growth of the market across APAC, Europe, North America, South America, and Middle East and Africa
  • Thorough analysis of the market's competitive landscape and detailed information about companies
  • Comprehensive analysis of factors that will challenge the growth of market companies

We can help! Our analysts can customize this market research report to meet your requirements. Get in touch

1 Executive Summary

  • 1.1 Market overview
    • Executive Summary - Chart on Market Overview
    • Executive Summary - Data Table on Market Overview
    • Executive Summary - Chart on Global Market Characteristics
    • Executive Summary - Chart on Market by Geography
    • Executive Summary - Chart on Market Segmentation by Application
    • Executive Summary - Chart on Incremental Growth
    • Executive Summary - Data Table on Incremental Growth
    • Executive Summary - Chart on Company Market Positioning

2 Market Landscape

  • 2.1 Market ecosystem
    • Parent Market
    • Data Table on - Parent Market
  • 2.2 Market characteristics
    • Market characteristics analysis
  • 2.3 Value chain analysis
    • Value Chain Analysis

3 Market Sizing

  • 3.1 Market definition
    • Offerings of companies included in the market definition
  • 3.2 Market segment analysis
    • Market segments
  • 3.3 Market size 2023
    • 3.4 Market outlook: Forecast for 2023-2028
      • Chart on Global - Market size and forecast 2023-2028 ($ million)
      • Data Table on Global - Market size and forecast 2023-2028 ($ million)
      • Chart on Global Market: Year-over-year growth 2023-2028 (%)
      • Data Table on Global Market: Year-over-year growth 2023-2028 (%)

    4 Historic Market Size

    • 4.1 Global Solar Central Inverters Market 2018 - 2022
      • Historic Market Size - Data Table on Global Solar Central Inverters Market 2018 - 2022 ($ million)
    • 4.2 Application segment analysis 2018 - 2022
      • Historic Market Size - Application Segment 2018 - 2022 ($ million)
    • 4.3 Geography segment analysis 2018 - 2022
      • Historic Market Size - Geography Segment 2018 - 2022 ($ million)
    • 4.4 Country segment analysis 2018 - 2022
      • Historic Market Size - Country Segment 2018 - 2022 ($ million)

    5 Five Forces Analysis

    • 5.1 Five forces summary
      • Five forces analysis - Comparison between 2023 and 2028
    • 5.2 Bargaining power of buyers
      • Bargaining power of buyers - Impact of key factors 2023 and 2028
    • 5.3 Bargaining power of suppliers
      • Bargaining power of suppliers - Impact of key factors in 2023 and 2028
    • 5.4 Threat of new entrants
      • Threat of new entrants - Impact of key factors in 2023 and 2028
    • 5.5 Threat of substitutes
      • Threat of substitutes - Impact of key factors in 2023 and 2028
    • 5.6 Threat of rivalry
      • Threat of rivalry - Impact of key factors in 2023 and 2028
    • 5.7 Market condition
      • Chart on Market condition - Five forces 2023 and 2028

    6 Market Segmentation by Application

    • 6.1 Market segments
      • Chart on Application - Market share 2023-2028 (%)
      • Data Table on Application - Market share 2023-2028 (%)
    • 6.2 Comparison by Application
      • Chart on Comparison by Application
      • Data Table on Comparison by Application
    • 6.3 Utility - Market size and forecast 2023-2028
      • Chart on Utility - Market size and forecast 2023-2028 ($ million)
      • Data Table on Utility - Market size and forecast 2023-2028 ($ million)
      • Chart on Utility - Year-over-year growth 2023-2028 (%)
      • Data Table on Utility - Year-over-year growth 2023-2028 (%)
    • 6.4 Non-utility - Market size and forecast 2023-2028
      • Chart on Non-utility - Market size and forecast 2023-2028 ($ million)
      • Data Table on Non-utility - Market size and forecast 2023-2028 ($ million)
      • Chart on Non-utility - Year-over-year growth 2023-2028 (%)
      • Data Table on Non-utility - Year-over-year growth 2023-2028 (%)
    • 6.5 Market opportunity by Application
      • Market opportunity by Application ($ million)
      • Data Table on Market opportunity by Application ($ million)

    7 Customer Landscape

    • 7.1 Customer landscape overview
      • Analysis of price sensitivity, lifecycle, customer purchase basket, adoption rates, and purchase criteria

    8 Geographic Landscape

    • 8.1 Geographic segmentation
      • Chart on Market share by geography 2023-2028 (%)
      • Data Table on Market share by geography 2023-2028 (%)
    • 8.2 Geographic comparison
      • Chart on Geographic comparison
      • Data Table on Geographic comparison
    • 8.3 APAC - Market size and forecast 2023-2028
      • Chart on APAC - Market size and forecast 2023-2028 ($ million)
      • Data Table on APAC - Market size and forecast 2023-2028 ($ million)
      • Chart on APAC - Year-over-year growth 2023-2028 (%)
      • Data Table on APAC - Year-over-year growth 2023-2028 (%)
    • 8.4 Europe - Market size and forecast 2023-2028
      • Chart on Europe - Market size and forecast 2023-2028 ($ million)
      • Data Table on Europe - Market size and forecast 2023-2028 ($ million)
      • Chart on Europe - Year-over-year growth 2023-2028 (%)
      • Data Table on Europe - Year-over-year growth 2023-2028 (%)
    • 8.5 North America - Market size and forecast 2023-2028
      • Chart on North America - Market size and forecast 2023-2028 ($ million)
      • Data Table on North America - Market size and forecast 2023-2028 ($ million)
      • Chart on North America - Year-over-year growth 2023-2028 (%)
      • Data Table on North America - Year-over-year growth 2023-2028 (%)
    • 8.6 South America - Market size and forecast 2023-2028
      • Chart on South America - Market size and forecast 2023-2028 ($ million)
      • Data Table on South America - Market size and forecast 2023-2028 ($ million)
      • Chart on South America - Year-over-year growth 2023-2028 (%)
      • Data Table on South America - Year-over-year growth 2023-2028 (%)
    • 8.7 Middle East and Africa - Market size and forecast 2023-2028
      • Chart on Middle East and Africa - Market size and forecast 2023-2028 ($ million)
      • Data Table on Middle East and Africa - Market size and forecast 2023-2028 ($ million)
      • Chart on Middle East and Africa - Year-over-year growth 2023-2028 (%)
      • Data Table on Middle East and Africa - Year-over-year growth 2023-2028 (%)
    • 8.8 US - Market size and forecast 2023-2028
      • Chart on US - Market size and forecast 2023-2028 ($ million)
      • Data Table on US - Market size and forecast 2023-2028 ($ million)
      • Chart on US - Year-over-year growth 2023-2028 (%)
      • Data Table on US - Year-over-year growth 2023-2028 (%)
    • 8.9 China - Market size and forecast 2023-2028
      • Chart on China - Market size and forecast 2023-2028 ($ million)
      • Data Table on China - Market size and forecast 2023-2028 ($ million)
      • Chart on China - Year-over-year growth 2023-2028 (%)
      • Data Table on China - Year-over-year growth 2023-2028 (%)
    • 8.10 Vietnam - Market size and forecast 2023-2028
      • Chart on Vietnam - Market size and forecast 2023-2028 ($ million)
      • Data Table on Vietnam - Market size and forecast 2023-2028 ($ million)
      • Chart on Vietnam - Year-over-year growth 2023-2028 (%)
      • Data Table on Vietnam - Year-over-year growth 2023-2028 (%)
    • 8.11 Japan - Market size and forecast 2023-2028
      • Chart on Japan - Market size and forecast 2023-2028 ($ million)
      • Data Table on Japan - Market size and forecast 2023-2028 ($ million)
      • Chart on Japan - Year-over-year growth 2023-2028 (%)
      • Data Table on Japan - Year-over-year growth 2023-2028 (%)
    • 8.12 Australia - Market size and forecast 2023-2028
      • Chart on Australia - Market size and forecast 2023-2028 ($ million)
      • Data Table on Australia - Market size and forecast 2023-2028 ($ million)
      • Chart on Australia - Year-over-year growth 2023-2028 (%)
      • Data Table on Australia - Year-over-year growth 2023-2028 (%)
    • 8.13 Market opportunity by geography
      • Market opportunity by geography ($ million)
      • Data Tables on Market opportunity by geography ($ million)

    9 Drivers, Challenges, and Opportunity/Restraints

    • 9.1 Market drivers
      • 9.2 Market challenges
        • 9.3 Impact of drivers and challenges
          • Impact of drivers and challenges in 2023 and 2028
        • 9.4 Market opportunities/restraints

          10 Competitive Landscape

          • 10.1 Overview
            • 10.2 Competitive Landscape
              • Overview on criticality of inputs and factors of differentiation
            • 10.3 Landscape disruption
              • Overview on factors of disruption
            • 10.4 Industry risks
              • Impact of key risks on business

            11 Competitive Analysis

            • 11.1 Companies profiled
              • Companies covered
            • 11.2 Market positioning of companies
              • Matrix on companies position and classification
            • 11.3 ABB Ltd.
              • ABB Ltd. - Overview
              • ABB Ltd. - Business segments
              • ABB Ltd. - Key news
              • ABB Ltd. - Key offerings
              • ABB Ltd. - Segment focus
            • 11.4 Delta Electronics Inc.
              • Delta Electronics Inc. - Overview
              • Delta Electronics Inc. - Business segments
              • Delta Electronics Inc. - Key news
              • Delta Electronics Inc. - Key offerings
              • Delta Electronics Inc. - Segment focus
            • 11.5 Eaton Corp. Plc
              • Eaton Corp. Plc - Overview
              • Eaton Corp. Plc - Business segments
              • Eaton Corp. Plc - Key news
              • Eaton Corp. Plc - Key offerings
              • Eaton Corp. Plc - Segment focus
            • 11.6 Hitachi Ltd.
              • Hitachi Ltd. - Overview
              • Hitachi Ltd. - Business segments
              • Hitachi Ltd. - Key news
              • Hitachi Ltd. - Key offerings
              • Hitachi Ltd. - Segment focus
            • 11.7 Ingeteam Corp. S.A.
              • Ingeteam Corp. S.A. - Overview
              • Ingeteam Corp. S.A. - Product / Service
              • Ingeteam Corp. S.A. - Key offerings
            • 11.8 OCI Co. Ltd.
              • OCI Co. Ltd. - Overview
              • OCI Co. Ltd. - Business segments
              • OCI Co. Ltd. - Key offerings
              • OCI Co. Ltd. - Segment focus
            • 11.9 Sineng Electric Co. Ltd.
              • Sineng Electric Co. Ltd. - Overview
              • Sineng Electric Co. Ltd. - Product / Service
              • Sineng Electric Co. Ltd. - Key offerings
            • 11.10 SMA Solar Technology AG
              • SMA Solar Technology AG - Overview
              • SMA Solar Technology AG - Business segments
              • SMA Solar Technology AG - Key offerings
              • SMA Solar Technology AG - Segment focus
            • 11.11 Sungrow Power Supply Co. Ltd.
              • Sungrow Power Supply Co. Ltd. - Overview
              • Sungrow Power Supply Co. Ltd. - Product / Service
              • Sungrow Power Supply Co. Ltd. - Key offerings
            • 11.12 Zhejiang CHINT Electrics Co. Ltd.
              • Zhejiang CHINT Electrics Co. Ltd. - Overview
              • Zhejiang CHINT Electrics Co. Ltd. - Product / Service
              • Zhejiang CHINT Electrics Co. Ltd. - Key offerings

            12 Appendix

            • 12.1 Scope of the report
              • 12.2 Inclusions and exclusions checklist
                • Inclusions checklist
                • Exclusions checklist
              • 12.3 Currency conversion rates for US$
                • Currency conversion rates for US$
              • 12.4 Research methodology
                • Research methodology
              • 12.5 Data procurement
                • Information sources
              • 12.6 Data validation
                • Data validation
              • 12.7 Validation techniques employed for market sizing
                • Validation techniques employed for market sizing
              • 12.8 Data synthesis
                • Data synthesis
              • 12.9 360 degree market analysis
                • 360 degree market analysis
              • 12.10 List of abbreviations
                • List of abbreviations

              Research Methodology

              Technavio presents a detailed picture of the market by way of study, synthesis, and summation of data from multiple sources. The analysts have presented the various facets of the market with a particular focus on identifying the key industry influencers. The data thus presented is comprehensive, reliable, and the result of extensive research, both primary and secondary.

              INFORMATION SOURCES

              Primary sources

              • Manufacturers and suppliers
              • Channel partners
              • Industry experts
              • Strategic decision makers

              Secondary sources

              • Industry journals and periodicals
              • Government data
              • Financial reports of key industry players
              • Historical data
              • Press releases

              DATA ANALYSIS

              Data Synthesis

              • Collation of data
              • Estimation of key figures
              • Analysis of derived insights

              Data Validation

              • Triangulation with data models
              • Reference against proprietary databases
              • Corroboration with industry experts

              REPORT WRITING

              Qualitative

              • Market drivers
              • Market challenges
              • Market trends
              • Five forces analysis

              Quantitative

              • Market size and forecast
              • Market segmentation
              • Geographical insights
              • Competitive landscape

              Interested in this report?

              Get your sample now to see our research methodology and insights!

              Download Now

              Frequently Asked Questions

              Solar Central Inverters market growth will increase by $ 3675.6 mn during 2024-2028 .

              The Solar Central Inverters market is expected to grow at a CAGR of 14.99% during 2024-2028 .

              Solar Central Inverters market is segmented by Application( Utility, Non-utility)

              ABB Ltd., Delta Electronics Inc., Eaton Corp. Plc, Fimer SpA, Hitachi Ltd., Huawei Technologies Co. Ltd., Infineon Technologies AG, Ingeteam Corp. S.A., OCI Co. Ltd., Shenzen Growatt New Energy Technology Co. Ltd., Siemens AG, Sineng Electric Co. Ltd., SMA Solar Technology AG, SolarEdge Technologies Inc., Sungrow Power Supply Co. Ltd., Toshiba Corp., Yaskawa Solectria Solar, Zhejiang CHINT Electrics Co. Ltd. are a few of the key vendors in the Solar Central Inverters market.

              APAC will register the highest growth rate of 56% among the other regions. Therefore, the Solar Central Inverters market in APAC is expected to garner significant business opportunities for the vendors during the forecast period.

              US, China, Vietnam, Japan, Australia

              • Rising investment in renewablesRenewable energy is playing a vital role in the global shift toward attaining a more sustainable and less carbon-intensive environment. Government regulations pertaining to reduction in carbon emissions have resulted in significant adoption of clean energy technologies across the world. The proliferation of clean energy technologies is further boosted by the rise in investment. During the past two decades is the driving factor this market.
              • there has been a drastic change in the global energy mix. According to IEA is the driving factor this market.
              • the share of renewables in global electricity production was 29% in 2020 is the driving factor this market.
              • and it is expected to reach 40% by 2040. There has been a significant growth in the renewable energy sector globally owing to the competitive price of power generation coupled with subsidies provided by governments and favorable regulations. According to IEA is the driving factor this market.
              • renewables accounted for two-thirds of the investments in power generation in 2021. For instance is the driving factor this market.
              • in 2021 is the driving factor this market.
              • more than $530 billion was invested in the renewable energy sector globally. According to IEA is the driving factor this market.
              • solar PV investment increased to record levels in 2021 is the driving factor this market.
              • as the share of deployment in historically low-cost countries such as China and India is the driving factor this market.
              • continued to grow. Thus is the driving factor this market.
              • the use of renewable energy sources has been growing rapidly because of increasing government support and investments. Hence is the driving factor this market.
              • these factors will eventually boost the adoption of solar PV systems is the driving factor this market.
              • thus increasing the demand for solar central inverters during the forecast period. is the driving factor this market.

              The Solar Central Inverters market vendors should focus on grabbing business opportunities from the Utility segment as it accounted for the largest market share in the base year.