Inverter Market Analysis, Size, and Forecast 2024-2028: APAC (China, India, Japan, South Korea), Europe (France, Germany, Italy, Spain, UK), North America (Canada and Mexico), Middle East and Africa (UAE), and South America (Brazil)

Inverter Market Analysis, Size, and Forecast 2024-2028:
APAC (China, India, Japan, South Korea), Europe (France, Germany, Italy, Spain, UK), North America (Canada and Mexico), Middle East and Africa (UAE), and South America (Brazil)

Published: Aug 2024 180 Pages SKU: IRTNTR70280

Market Overview at a Glance

$32.38 B
Market Opportunity
6.78%
CAGR
6.23
YoY growth 2023-2024(%)

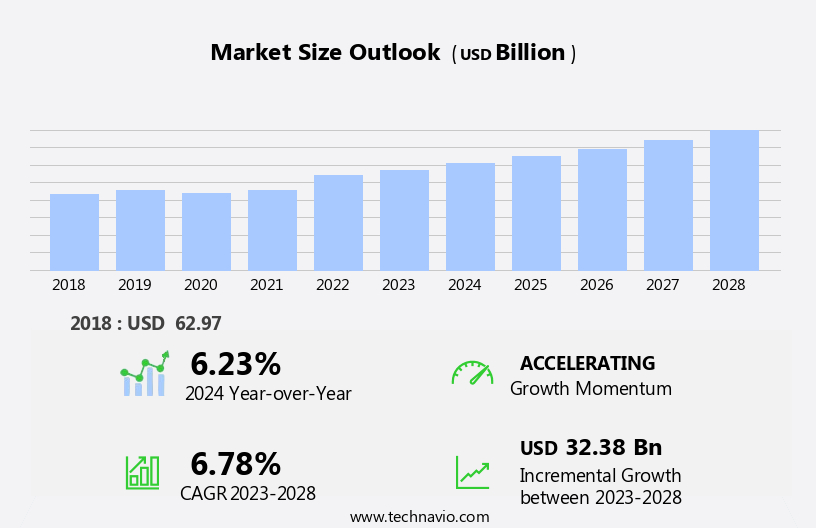
Inverter Market Size 2024-2028

The inverter market size is forecast to increase by USD 32.38 billion at a CAGR of 6.78% between 2023 and 2028.

  • The market is witnessing significant growth, driven primarily by the rise in wind energy consumption and the increasing demand for clean power. Renewable energy sources, particularly wind energy, are becoming increasingly popular due to their environmental benefits and decreasing costs. However, the intermittent nature of renewable energy poses a significant challenge for market growth. Inverters play a crucial role in converting direct current (DC) power from renewable energy sources into alternating current (AC) for grid connection and distribution. The market's growth is further fueled by advancements in inverter technology, enabling higher efficiency, larger capacity, and more flexibility.
  • However, the intermittency of renewable energy sources necessitates the development of energy storage solutions to ensure a consistent power supply. This presents both an opportunity and a challenge for market participants. Companies that can effectively address the energy storage issue and provide reliable, efficient, and cost-effective solutions will be well-positioned to capitalize on the growing demand for renewable energy and clean power. Conversely, those that fail to address this challenge may struggle to compete in the market. Overall, the market is poised for growth, with key drivers including the increasing adoption of renewable energy sources and the demand for clean power.However, the intermittency of these sources and the need for energy storage solutions present significant challenges that market participants must address to succeed.

What will be the Size of the Inverter Market during the forecast period?

Inverter Market Size

 Request Free Sample

  • The market continues to evolve, driven by the increasing adoption of renewable energy sources and the push for carbon emissions reduction. Grid-tied inverters play a crucial role in converting photovoltaic (PV) energy into usable AC power for residential and commercial applications. Efficiency optimization is a key focus, with data analytics and energy management systems enabling real-time monitoring and adjustments. Power factor correction, data security, and smart grid integration are also essential components. Predictive maintenance, voltage regulation, and energy efficiency are increasingly important for ensuring system reliability and cost reduction. Power electronics and energy storage solutions, such as battery backup and DC-to-AC conversion, are also gaining traction.
  • The market dynamics are shaped by various factors, including utility-scale applications, demand response, safety standards, and grid integration. Renewable energy sources, including wind power and solar energy, continue to drive market growth, with hybrid inverters offering flexibility and improved power system stability. The ongoing integration of artificial intelligence (AI) and cloud computing is transforming the industry, enabling advanced monitoring, control, and fault detection capabilities.

How is this Inverter Industry segmented?

The inverter industry research report provides comprehensive data (region-wise segment analysis), with forecasts and estimates in "USD billion" for the period 2024-2028, as well as historical data from 2018-2022 for the following segments.

  • Application
    • Solar PV
    • Automotive
    • Industrial
    • Residential
  • Type
    • On-grid
    • Off-grid
  • Technology
    • Pure Sine Wave
    • Modified Sine Wave
    • Square Wave
  • Product
    • String Inverters
    • Micro Inverters
    • Central Inverters
    • Hybrid Inverters
  • Geography
    • North America
      • US
      • Canada
      • Mexico
    • Europe
      • France
      • Germany
      • Italy
      • Spain
      • UK
    • Middle East and Africa
      • UAE
    • APAC
      • China
      • India
      • Japan
      • South Korea
    • South America
      • Brazil
    • Rest of World (ROW)

By Application Insights

The solar pv segment is estimated to witness significant growth during the forecast period.

The market is experiencing significant growth, particularly in the grid-tied inverter segment, driven by the increasing adoption of renewable energy sources, such as solar and wind power, for residential and commercial applications. Grid-tied inverters enable the conversion of direct current (DC) electricity from photovoltaic (PV) panels into alternating current (AC) for grid integration. This market trend aligns with the global push towards reducing carbon emissions and increasing energy efficiency. In the residential sector, energy management and data analytics are crucial for optimizing energy consumption and costs. Smart grid technology and predictive maintenance enable real-time monitoring and control of energy usage, ensuring power quality and stability.

Central inverters are increasingly being used in utility-scale applications for grid integration, while battery backup systems provide energy storage solutions for renewable energy. Power factor correction and voltage regulation are essential for optimizing grid performance and ensuring power system stability. Harmonic distortion and frequency regulation are critical considerations for grid integration, with inverters playing a vital role in mitigating these issues. Demand response and demand side management are also becoming increasingly important for grid management and cost reduction. The integration of artificial intelligence (AI) and data analytics in inverters enables advanced monitoring and control, including fault detection, predictive maintenance, and demand response.

Safety standards and monitoring and control systems are essential for ensuring grid safety and preventing islanding. Off-grid inverters are used in remote locations where grid connection is not available, providing a sustainable energy solution for powering homes and businesses. Hybrid inverters, which combine solar and battery storage systems, offer increased energy independence and cost savings. The market for inverters is expected to continue growing, driven by the increasing adoption of renewable energy sources, the need for energy efficiency and cost savings, and the integration of advanced technologies such as AI and data analytics. The future of the market lies in the development of more efficient, intelligent, and cost-effective solutions for grid integration and energy management.

Inverter Market Size

Request Free Sample

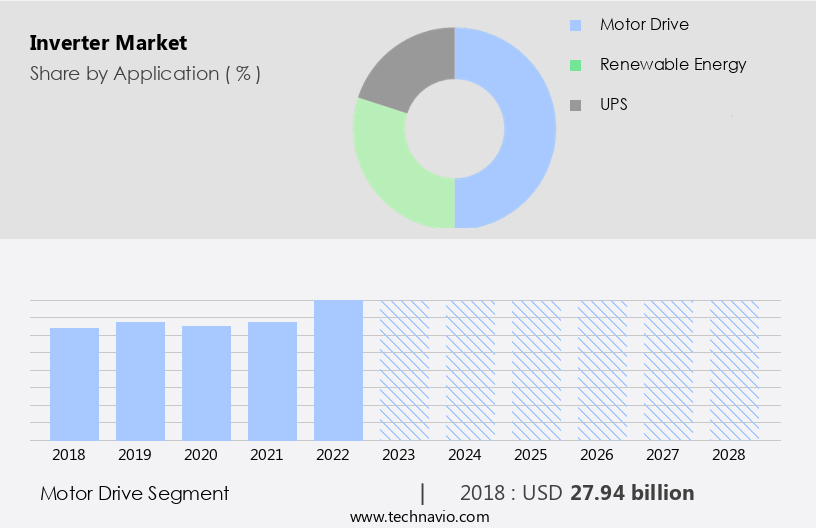
The Solar PV segment was valued at USD 27.94 billion in 2018 and showed a gradual increase during the forecast period.
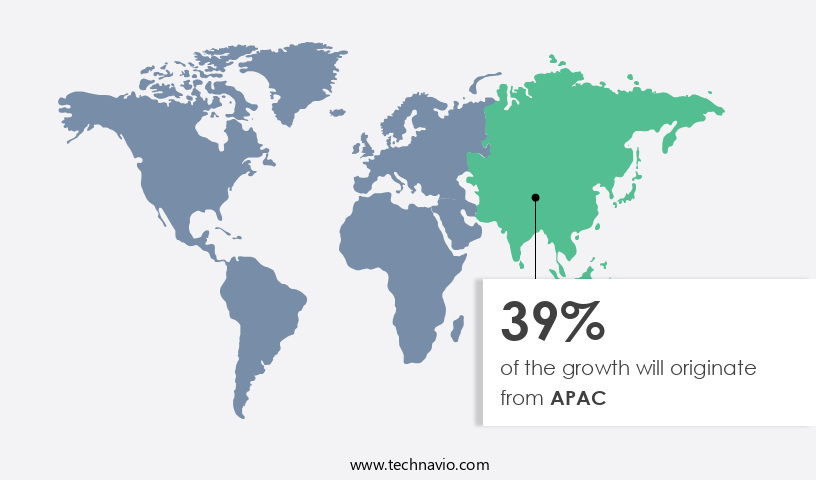
Regional Analysis

APAC is estimated to contribute 39% to the growth of the global market during the forecast period.Technavio's analysts have elaborately explained the regional trends and drivers that shape the market during the forecast period.

Inverter Market Share by Geography

 Request Free Sample

In the Asia-Pacific region, the market is experiencing significant growth due to the increasing adoption of inverters in various sectors, including electric vehicles and railways, wind and solar energy, and manufacturing and industrial applications. Countries such as Japan, China, Australia, India, South Korea, Taiwan, and Singapore are driving this growth. The rising population and improving standards of living in APAC have led to a surging demand for energy, which in turn is fueling the focus on renewable energy sources. China and India are expected to account for a large portion of the installations in the region, given their substantial wind energy potential and robust government support.

Efficiency optimization is a key trend in the market, with photovoltaic (PV) systems increasingly being integrated with energy management systems and data analytics for better power usage. Grid-tied inverters are being used to improve power quality and reduce carbon emissions. Power factor correction and voltage regulation are essential features for grid integration. Smart grids and predictive maintenance are also gaining traction, with cloud computing enabling remote monitoring and fault detection. Central inverters and string inverters are being used for utility-scale applications, while hybrid inverters are being adopted for renewable energy systems that combine solar and wind power. Safety standards and monitoring and control systems are crucial for ensuring power system stability and preventing islanding.

Battery backup and dc-to-ac conversion are essential for ensuring energy storage and reducing costs. Artificial intelligence (AI) is being used to optimize energy efficiency and improve power system performance. Harmonic distortion is a concern for power quality, and inverters are being designed to minimize it. In conclusion, the market in APAC is witnessing robust growth due to the increasing demand for energy and the focus on renewable energy sources. The market is being driven by trends such as efficiency optimization, smart grids, predictive maintenance, and energy storage. Inverters are being used in various sectors, including EV and railways, wind and solar energy, and manufacturing and industrial applications. The market is expected to continue growing as countries in the region invest in sustainable energy and improve their power infrastructure.

Market Dynamics

Our researchers analyzed the data with 2023 as the base year, along with the key drivers, trends, and challenges. A holistic analysis of drivers will help companies refine their marketing strategies to gain a competitive advantage.

The Global Inverter Market advances with inverters for solar energy and string inverters for residential use. Inverter market trends 2024 emphasize smart inverters for grids and hybrid inverters for energy storage. Inverters for industrial applications and microinverters for rooftop solar fuel demand, per inverter market forecast. High-efficiency inverters leverage inverters with IoT connectivity, while inverters for commercial buildings ensure reliability. Inverters for renewable energy and inverters for automotive EVs drive scalability. Inverters for sustainable energy, advanced inverter technologies, and inverter supply chain optimize performance. Inverters for regulatory compliance, inverters for global markets, inverters for energy efficiency, inverters for grid stability, and inverters for B2B sectors propel growth through 2028.

What are the key market drivers leading to the rise in the adoption of Inverter Industry?

  • The significant increase in wind energy consumption serves as the primary market driver.  The global market for grid-tied inverters, a crucial component in the conversion of photovoltaic (PV) energy into usable AC power for residential applications, is experiencing significant growth. This expansion is driven by the increasing emphasis on energy efficiency optimization and the integration of renewable energy sources into the power grid. With carbon emissions becoming a major concern, countries worldwide are turning to renewable energy to reduce their carbon footprint. Among all renewable energy sources, wind power is the most abundant and efficient for power generation. In 2020, China led the world in cumulative installed wind power capacity, followed closely by the US and Europe.
  • The ongoing efforts to harness wind energy's potential in these regions are expected to fuel market growth. For instance, in 2021, offshore wind installations accounted for approximately one-fifth of the annual gross wind installations in Europe. The integration of advanced technologies like energy management, data analytics, power factor correction, smart grid, and data security is further enhancing the market's growth prospects.

What are the market trends shaping the Inverter Industry?

  • The trend in the market is shifting towards an increased demand for clean power. This growing requirement for renewable energy sources is a significant development in the industry.
  • The global power demand is projected to grow significantly due to population expansion and economic development, reaching approximately 34,454 TWh by 2035 according to The World Bank. This increasing demand necessitates the adoption of efficient and sustainable power solutions. In response, the market for inverters, which facilitate dc-to-ac conversion, voltage regulation, and energy efficiency, is experiencing substantial growth. Inverters play a crucial role in various applications, including renewable energy systems, data centers, and off-grid installations. Advanced technologies, such as predictive maintenance, artificial intelligence (AI), and fault detection, are enhancing the performance and reliability of inverters.
  • These features enable cost reduction by minimizing downtime and optimizing energy usage. Off-grid inverters are gaining popularity in remote areas and developing countries, providing power solutions for those without access to the main grid. Central inverters, which manage large-scale power generation, are essential for utility-scale renewable energy projects. In conclusion, the market is driven by the growing demand for power and the shift towards low-carbon technologies. Technological advancements, such as predictive maintenance and AI, are improving the efficiency and reliability of inverters, making them an essential component of the global power infrastructure.

What challenges does the Inverter Industry face during its growth?

  • The intermittent nature of renewable energy poses a significant challenge to the industry's growth, requiring continuous research and development to ensure a reliable and sustainable energy supply. 
  • The solar photovolvoltaic (PV) market is experiencing significant growth due to decreasing installation costs and favorable government regulations. However, the intermittent nature of solar energy poses a challenge to market expansion. Solar energy production is inconsistent due to the variable nature of sunlight, which affects the power system stability and requires effective grid integration. To address these challenges, advanced technologies such as cloud computing, remote monitoring, and hybrid inverters are being adopted. Hybrid inverters, capable of managing multiple energy sources, offer improved power quality and harmonic distortion mitigation. These inverters ensure the efficient integration of renewable energy into the power grid, enhancing the reliability and stability of the power system.
  • Moreover, the increasing focus on sustainable energy and wind power is driving the demand for advanced inverter solutions. Inverter manufacturers are investing in research and development to create more efficient and effective solutions, ensuring the consistent production of renewable energy. This innovation is crucial to maintaining a stable power grid and reducing reliance on fossil fuels. In conclusion, the solar PV market is growing rapidly, but the intermittent nature of solar energy presents challenges to market expansion. Advanced technologies, such as cloud computing, remote monitoring, and hybrid inverters, are being adopted to address these challenges and ensure the efficient integration of renewable energy into the power grid. This focus on innovation is essential to maintaining power system stability and reducing reliance on fossil fuels.

Exclusive Customer Landscape

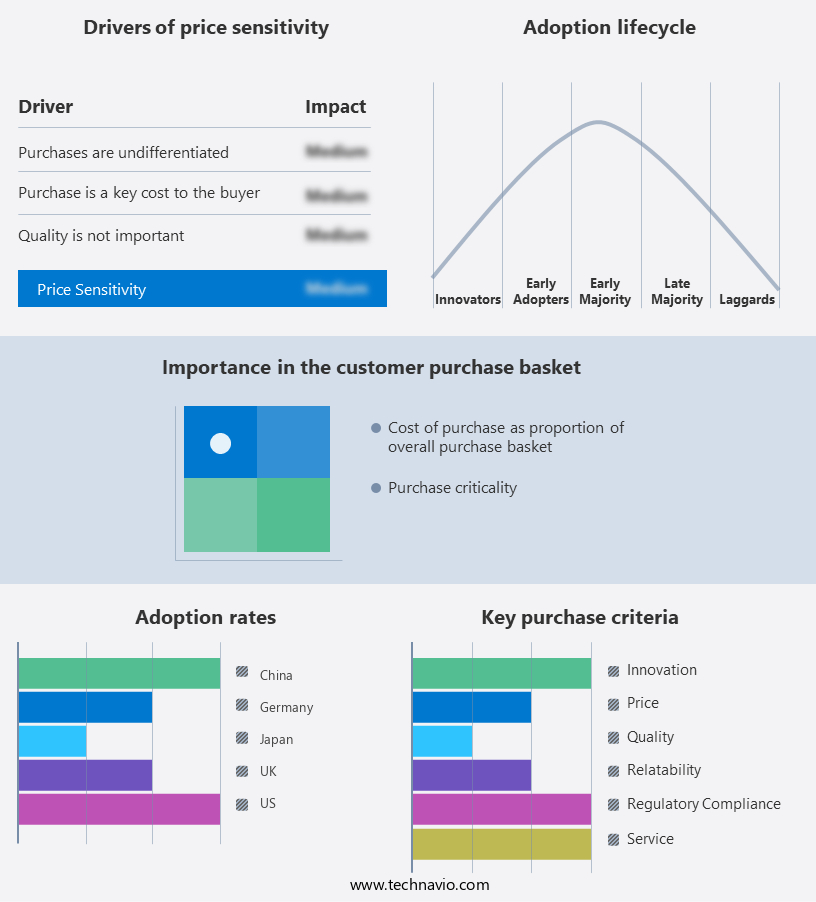
The inverter market forecasting report includes the adoption lifecycle of the market, covering from the innovator's stage to the laggard's stage. It focuses on adoption rates in different regions based on penetration. Furthermore, the inverter market report also includes key purchase criteria and drivers of price sensitivity to help companies evaluate and develop their market growth analysis strategies.

Inverter Market Share by Geography

 Customer Landscape

Key Companies & Market Insights

Companies are implementing various strategies, such as strategic alliances, inverter market forecast, partnerships, mergers and acquisitions, geographical expansion, and product/service launches, to enhance their presence in the industry.

SMA Solar Technology AG - The company specializes in providing advanced inverter solutions, including the HES880 model. Our offerings prioritize efficiency and reliability, enhancing the performance of renewable energy systems. By utilizing cutting-edge technology, we ensure optimal energy conversion and maximize system output. Our commitment to innovation and sustainability sets US apart in the industry.

The industry research and growth report includes detailed analyses of the competitive landscape of the market and information about key companies, including:

  • SMA Solar Technology AG
  • Fronius International GmbH
  • ABB Power Grids
  • Schneider Electric SE
  • Siemens AG
  • Delta Electronics Inc.
  • TMEIC Corporation
  • Mitsubishi Electric Corporation
  • Yaskawa Electric Corporation
  • Omron Corporation
  • Sungrow Power Supply Co. Ltd.
  • Huawei Technologies Co. Ltd.
  • GoodWe Power Supply Technology Co. Ltd.
  • Ginlong Technologies
  • Enphase Energy Inc.
  • SolarEdge Technologies Inc.
  • OutBack Power Technologies
  • Victron Energy
  • KACO new energy GmbH
  • Eaton Corporation plc

Qualitative and quantitative analysis of companies has been conducted to help clients understand the wider business environment as well as the strengths and weaknesses of key industry players. Data is qualitatively analyzed to categorize companies as pure play, category-focused, industry-focused, and diversified; it is quantitatively analyzed to categorize companies as dominant, leading, strong, tentative, and weak.

Recent Development and News in Inverter Market

  • In May 2022, Huawei Technologies partnered with Trina Solar to advance smart photovoltaic (PV) solutions, focusing on innovative inverter technologies. This collaboration aimed to integrate Huawei's advanced string inverters with Trina Solar's PV modules, enhancing efficiency for commercial and utility-scale solar projects by leveraging AI and cloud technology for optimized power generation.
  • In July 2023, WEG S.A. acquired Regal Rexnord's industrial motors and generators business, strengthening its position in the inverter market. This acquisition, valued at approximately USD400 million, expanded WEG's portfolio of energy-efficient motor solutions, including those paired with inverters for renewable energy applications, boosting its global market presence.
  • In January 2025, Lithuania implemented legislation banning Chinese-manufactured inverters from remotely accessing sites exceeding 100 kW due to cybersecurity concerns. This policy shift, driven by national security priorities, is expected to limit foreign inverter deployments while supporting local manufacturers in competing within the European market.
  • In May 2025, Solis Inverters' Indian subsidiary achieved a 6 GW shipment milestone and launched new 350 kW and 150 kW string inverters, alongside a 50 kW hybrid inverter, targeting India's commercial and industrial solar market. These product launches address growing demand for high-capacity, efficient inverters in one of the world's fastest-growing solar markets.

Research Analyst Overview

The market is experiencing significant growth and innovation, driven by the increasing adoption of distributed generation, green energy, and energy efficiency standards. Battery management systems and MPPT algorithms are key components of this shift, optimizing energy storage technologies like flow batteries and hydrogen energy. Distributed generation, including solar and wind, is transforming energy markets through net metering and feed-in tariffs. Smart metering and demand side management are enhancing grid stability and energy resilience, while carbon pricing and energy subsidies influence market dynamics. Power surge protection and voltage sag mitigation are crucial for grid synchronization and power conditioning. Multilevel inverters and modular inverters are advancing energy transition, enabling energy independence and energy trading.

Climate change mitigation and grid stability enhancement are primary objectives, with electric vehicles (EVs) and fuel cells contributing to the energy infrastructure evolution. Energy optimization and energy trading are becoming essential strategies for businesses in the face of energy markets' volatility.

Dive into Technavio's robust research methodology, blending expert interviews, extensive data synthesis, and validated models for unparalleled Inverter Market insights. See full methodology.

Market Scope

Report Coverage

Details

Page number

180

Base year

2023

Historic period

2018-2022

Forecast period

2024-2028

Growth momentum & CAGR

Accelerate at a CAGR of 6.78%

Market growth 2024-2028

USD 32.38 billion

Market structure

Fragmented

YoY growth 2023-2024(%)

6.23

Key countries

US, China, Germany, Canada, India, South Korea, France, Japan, Italy, Brazil, UAE, UK, Spain, and Mexico

Competitive landscape

Leading Companies, Market Positioning of Companies, Competitive Strategies, and Industry Risks

Request Free Sample

What are the Key Data Covered in this Inverter Market Research and Growth Report?

  • CAGR of the Inverter industry during the forecast period
  • Detailed information on factors that will drive the growth and forecasting between 2024 and 2028
  • Precise estimation of the size of the market and its contribution of the industry in focus to the parent market
  • Accurate predictions about upcoming growth and trends and changes in consumer behaviour
  • Growth of the market across APAC, Europe, North America, Middle East and Africa, and South America
  • Thorough analysis of the market's competitive landscape and detailed information about companies
  • Comprehensive analysis of factors that will challenge the inverter market growth of industry companies

We can help! Our analysts can customize this inverter market research report to meet your requirements.

Get in touch

1 Executive Summary

  • 1.1 Market overview
    • Executive Summary - Chart on Market Overview
    • Executive Summary - Data Table on Market Overview
    • Executive Summary - Chart on Global Market Characteristics
    • Executive Summary - Chart on Market by Geography
    • Executive Summary - Chart on Market Segmentation by Application
    • Executive Summary - Chart on Market Segmentation by Type
    • Executive Summary - Chart on Incremental Growth
    • Executive Summary - Data Table on Incremental Growth
    • Executive Summary - Chart on Company Market Positioning

2 Market Landscape

  • 2.1 Market ecosystem
    • Parent Market
    • Data Table on - Parent Market
  • 2.2 Market characteristics
    • Market characteristics analysis
  • 2.3 Value chain analysis
    • Value Chain Analysis

3 Market Sizing

  • 3.1 Market definition
    • Offerings of companies included in the market definition
  • 3.2 Market segment analysis
    • Market segments
  • 3.3 Market size 2023
    • 3.4 Market outlook: Forecast for 2023-2028
      • Chart on Global - Market size and forecast 2023-2028 ($ million)
      • Data Table on Global - Market size and forecast 2023-2028 ($ million)
      • Chart on Global Market: Year-over-year growth 2023-2028 (%)
      • Data Table on Global Market: Year-over-year growth 2023-2028 (%)

    4 Historic Market Size

    • 4.1 Global Inverter Market 2018 - 2022
      • Historic Market Size - Data Table on Global Inverter Market 2018 - 2022 ($ million)
    • 4.2 Application segment analysis 2018 - 2022
      • Historic Market Size - Application Segment 2018 - 2022 ($ million)
    • 4.3 Type segment analysis 2018 - 2022
      • Historic Market Size - Type Segment 2018 - 2022 ($ million)
    • 4.4 Geography segment analysis 2018 - 2022
      • Historic Market Size - Geography Segment 2018 - 2022 ($ million)
    • 4.5 Country segment analysis 2018 - 2022
      • Historic Market Size - Country Segment 2018 - 2022 ($ million)

    5 Five Forces Analysis

    • 5.1 Five forces summary
      • Five forces analysis - Comparison between 2023 and 2028
    • 5.2 Bargaining power of buyers
      • Bargaining power of buyers - Impact of key factors 2023 and 2028
    • 5.3 Bargaining power of suppliers
      • Bargaining power of suppliers - Impact of key factors in 2023 and 2028
    • 5.4 Threat of new entrants
      • Threat of new entrants - Impact of key factors in 2023 and 2028
    • 5.5 Threat of substitutes
      • Threat of substitutes - Impact of key factors in 2023 and 2028
    • 5.6 Threat of rivalry
      • Threat of rivalry - Impact of key factors in 2023 and 2028
    • 5.7 Market condition
      • Chart on Market condition - Five forces 2023 and 2028

    6 Market Segmentation by Application

    • 6.1 Market segments
      • Chart on Application - Market share (2023-2028) (%)
      • Data Table on Application - Market share (2023-2028) (%)
    • 6.2 Comparison by Application
      • Chart on Comparison by Application
      • Data Table on Comparison by Application
    • 6.3 Motor drive - Market size and forecast (2023-2028)
      • Chart on Motor drive - Market size and forecast (2023-2028) ($ million)
      • Data Table on Motor drive - Market size and forecast (2023-2028) ($ million)
      • Chart on Motor drive - Year-over-year growth (2023-2028) (%)
      • Data Table on Motor drive - Year-over-year growth (2023-2028) (%)
    • 6.4 Renewable energy - Market size and forecast (2023-2028)
      • Chart on Renewable energy - Market size and forecast (2023-2028) ($ million)
      • Data Table on Renewable energy - Market size and forecast (2023-2028) ($ million)
      • Chart on Renewable energy - Year-over-year growth (2023-2028) (%)
      • Data Table on Renewable energy - Year-over-year growth (2023-2028) (%)
    • 6.5 UPS - Market size and forecast (2023-2028)
      • Chart on UPS - Market size and forecast (2023-2028) ($ million)
      • Data Table on UPS - Market size and forecast (2023-2028) ($ million)
      • Chart on UPS - Year-over-year growth (2023-2028) (%)
      • Data Table on UPS - Year-over-year growth (2023-2028) (%)
    • 6.6 Market opportunity by Application
      • Market opportunity by Application ($ million)
      • Data Table on Market opportunity by Application ($ million)

    7 Market Segmentation by Type

    • 7.1 Market segments
      • Chart on Type - Market share (2023-2028) (%)
      • Data Table on Type - Market share (2023-2028) (%)
    • 7.2 Comparison by Type
      • Chart on Comparison by Type
      • Data Table on Comparison by Type
    • 7.3 On-grid - Market size and forecast (2023-2028)
      • Chart on On-grid - Market size and forecast (2023-2028) ($ million)
      • Data Table on On-grid - Market size and forecast (2023-2028) ($ million)
      • Chart on On-grid - Year-over-year growth (2023-2028) (%)
      • Data Table on On-grid - Year-over-year growth (2023-2028) (%)
    • 7.4 Off-grid - Market size and forecast (2023-2028)
      • Chart on Off-grid - Market size and forecast (2023-2028) ($ million)
      • Data Table on Off-grid - Market size and forecast (2023-2028) ($ million)
      • Chart on Off-grid - Year-over-year growth (2023-2028) (%)
      • Data Table on Off-grid - Year-over-year growth (2023-2028) (%)
    • 7.5 Market opportunity by Type
      • Market opportunity by Type ($ million)
      • Data Table on Market opportunity by Type ($ million)

    8 Market Segmentation by Technology

    • 8.1 Market segments
      • Chart on Technology - Market share (2023-2028) (%)
      • Data Table on Technology - Market share (2023-2028) (%)
    • 8.2 Comparison by Technology
      • Chart on Comparison by Technology
      • Data Table on Comparison by Technology
    • 8.3 Pure Sine Wave - Market size and forecast (2023-2028)
      • Chart on Pure Sine Wave - Market size and forecast (2023-2028) ($ million)
      • Data Table on Pure Sine Wave - Market size and forecast (2023-2028) ($ million)
      • Chart on Pure Sine Wave - Year-over-year growth (2023-2028) (%)
      • Data Table on Pure Sine Wave - Year-over-year growth (2023-2028) (%)
    • 8.4 Modified Sine Wave - Market size and forecast (2023-2028)
      • Chart on Modified Sine Wave - Market size and forecast (2023-2028) ($ million)
      • Data Table on Modified Sine Wave - Market size and forecast (2023-2028) ($ million)
      • Chart on Modified Sine Wave - Year-over-year growth (2023-2028) (%)
      • Data Table on Modified Sine Wave - Year-over-year growth (2023-2028) (%)
    • 8.5 Square Wave - Market size and forecast (2023-2028)
      • Chart on Square Wave - Market size and forecast (2023-2028) ($ million)
      • Data Table on Square Wave - Market size and forecast (2023-2028) ($ million)
      • Chart on Square Wave - Year-over-year growth (2023-2028) (%)
      • Data Table on Square Wave - Year-over-year growth (2023-2028) (%)
    • 8.6 Market opportunity by Technology
      • Market opportunity by Technology ($ million)
      • Data Table on Market opportunity by Technology ($ million)

    9 Market Segmentation by Product

    • 9.1 Market segments
      • Chart on Product - Market share (2023-2028) (%)
      • Data Table on Product - Market share (2023-2028) (%)
    • 9.2 Comparison by Product
      • Chart on Comparison by Product
      • Data Table on Comparison by Product
    • 9.3 String Inverters - Market size and forecast (2023-2028)
      • Chart on String Inverters - Market size and forecast (2023-2028) ($ million)
      • Data Table on String Inverters - Market size and forecast (2023-2028) ($ million)
      • Chart on String Inverters - Year-over-year growth (2023-2028) (%)
      • Data Table on String Inverters - Year-over-year growth (2023-2028) (%)
    • 9.4 Micro Inverters - Market size and forecast (2023-2028)
      • Chart on Micro Inverters - Market size and forecast (2023-2028) ($ million)
      • Data Table on Micro Inverters - Market size and forecast (2023-2028) ($ million)
      • Chart on Micro Inverters - Year-over-year growth (2023-2028) (%)
      • Data Table on Micro Inverters - Year-over-year growth (2023-2028) (%)
    • 9.5 Central Inverters - Market size and forecast (2023-2028)
      • Chart on Central Inverters - Market size and forecast (2023-2028) ($ million)
      • Data Table on Central Inverters - Market size and forecast (2023-2028) ($ million)
      • Chart on Central Inverters - Year-over-year growth (2023-2028) (%)
      • Data Table on Central Inverters - Year-over-year growth (2023-2028) (%)
    • 9.6 Hybrid Inverters - Market size and forecast (2023-2028)
      • Chart on Hybrid Inverters - Market size and forecast (2023-2028) ($ million)
      • Data Table on Hybrid Inverters - Market size and forecast (2023-2028) ($ million)
      • Chart on Hybrid Inverters - Year-over-year growth (2023-2028) (%)
      • Data Table on Hybrid Inverters - Year-over-year growth (2023-2028) (%)
    • 9.7 Market opportunity by Product
      • Market opportunity by Product ($ million)
      • Data Table on Market opportunity by Product ($ million)

    10 Market Segmentation by Application

    • 10.1 Market segments
      • Chart on Application - Market share (2023-2028) (%)
      • Data Table on Application - Market share (2023-2028) (%)
    • 10.2 Comparison by Application
      • Chart on Comparison by Application
      • Data Table on Comparison by Application
    • 10.3 Solar PV - Market size and forecast (2023-2028)
      • Chart on Solar PV - Market size and forecast (2023-2028) ($ million)
      • Data Table on Solar PV - Market size and forecast (2023-2028) ($ million)
      • Chart on Solar PV - Year-over-year growth (2023-2028) (%)
      • Data Table on Solar PV - Year-over-year growth (2023-2028) (%)
    • 10.4 Automotive - Market size and forecast (2023-2028)
      • Chart on Automotive - Market size and forecast (2023-2028) ($ million)
      • Data Table on Automotive - Market size and forecast (2023-2028) ($ million)
      • Chart on Automotive - Year-over-year growth (2023-2028) (%)
      • Data Table on Automotive - Year-over-year growth (2023-2028) (%)
    • 10.5 Industrial - Market size and forecast (2023-2028)
      • Chart on Industrial - Market size and forecast (2023-2028) ($ million)
      • Data Table on Industrial - Market size and forecast (2023-2028) ($ million)
      • Chart on Industrial - Year-over-year growth (2023-2028) (%)
      • Data Table on Industrial - Year-over-year growth (2023-2028) (%)
    • 10.6 Residential - Market size and forecast (2023-2028)
      • Chart on Residential - Market size and forecast (2023-2028) ($ million)
      • Data Table on Residential - Market size and forecast (2023-2028) ($ million)
      • Chart on Residential - Year-over-year growth (2023-2028) (%)
      • Data Table on Residential - Year-over-year growth (2023-2028) (%)
    • 10.7 Market opportunity by Application
      • Market opportunity by Application ($ million)
      • Data Table on Market opportunity by Application ($ million)

    11 Customer Landscape

    • 11.1 Customer landscape overview
      • Analysis of price sensitivity, lifecycle, customer purchase basket, adoption rates, and purchase criteria

    12 Geographic Landscape

    • 12.1 Geographic segmentation
      • Chart on Market share by geography 2023-2028 (%)
      • Data Table on Market share by geography 2023-2028 (%)
    • 12.2 Geographic comparison
      • Chart on Geographic comparison
      • Data Table on Geographic comparison
    • 12.3 APAC - Market size and forecast 2023-2028
      • Chart on APAC - Market size and forecast 2023-2028 ($ million)
      • Data Table on APAC - Market size and forecast 2023-2028 ($ million)
      • Chart on APAC - Year-over-year growth 2023-2028 (%)
      • Data Table on APAC - Year-over-year growth 2023-2028 (%)
    • 12.4 Europe - Market size and forecast 2023-2028
      • Chart on Europe - Market size and forecast 2023-2028 ($ million)
      • Data Table on Europe - Market size and forecast 2023-2028 ($ million)
      • Chart on Europe - Year-over-year growth 2023-2028 (%)
      • Data Table on Europe - Year-over-year growth 2023-2028 (%)
    • 12.5 North America - Market size and forecast 2023-2028
      • Chart on North America - Market size and forecast 2023-2028 ($ million)
      • Data Table on North America - Market size and forecast 2023-2028 ($ million)
      • Chart on North America - Year-over-year growth 2023-2028 (%)
      • Data Table on North America - Year-over-year growth 2023-2028 (%)
    • 12.6 Middle East and Africa - Market size and forecast 2023-2028
      • Chart on Middle East and Africa - Market size and forecast 2023-2028 ($ million)
      • Data Table on Middle East and Africa - Market size and forecast 2023-2028 ($ million)
      • Chart on Middle East and Africa - Year-over-year growth 2023-2028 (%)
      • Data Table on Middle East and Africa - Year-over-year growth 2023-2028 (%)
    • 12.7 South America - Market size and forecast 2023-2028
      • Chart on South America - Market size and forecast 2023-2028 ($ million)
      • Data Table on South America - Market size and forecast 2023-2028 ($ million)
      • Chart on South America - Year-over-year growth 2023-2028 (%)
      • Data Table on South America - Year-over-year growth 2023-2028 (%)
    • 12.8 China - Market size and forecast 2023-2028
      • Chart on China - Market size and forecast 2023-2028 ($ million)
      • Data Table on China - Market size and forecast 2023-2028 ($ million)
      • Chart on China - Year-over-year growth 2023-2028 (%)
      • Data Table on China - Year-over-year growth 2023-2028 (%)
    • 12.9 US - Market size and forecast 2023-2028
      • Chart on US - Market size and forecast 2023-2028 ($ million)
      • Data Table on US - Market size and forecast 2023-2028 ($ million)
      • Chart on US - Year-over-year growth 2023-2028 (%)
      • Data Table on US - Year-over-year growth 2023-2028 (%)
    • 12.10 Germany - Market size and forecast 2023-2028
      • Chart on Germany - Market size and forecast 2023-2028 ($ million)
      • Data Table on Germany - Market size and forecast 2023-2028 ($ million)
      • Chart on Germany - Year-over-year growth 2023-2028 (%)
      • Data Table on Germany - Year-over-year growth 2023-2028 (%)
    • 12.11 Japan - Market size and forecast 2023-2028
      • Chart on Japan - Market size and forecast 2023-2028 ($ million)
      • Data Table on Japan - Market size and forecast 2023-2028 ($ million)
      • Chart on Japan - Year-over-year growth 2023-2028 (%)
      • Data Table on Japan - Year-over-year growth 2023-2028 (%)
    • 12.12 UK - Market size and forecast 2023-2028
      • Chart on UK - Market size and forecast 2023-2028 ($ million)
      • Data Table on UK - Market size and forecast 2023-2028 ($ million)
      • Chart on UK - Year-over-year growth 2023-2028 (%)
      • Data Table on UK - Year-over-year growth 2023-2028 (%)
    • 12.13 Market opportunity by geography
      • Market opportunity by geography ($ million)
      • Data Tables on Market opportunity by geography ($ million)
    • 12.14 Canada - Market size and forecast (2023-2028)
      • Chart on Canada - Market size and forecast (2023-2028) ($ million)
      • Data Table on Canada - Market size and forecast (2023-2028) ($ million)
      • Chart on Canada - Year-over-year growth (2023-2028) (%)
      • Data Table on Canada - Year-over-year growth (2023-2028) (%)
    • 12.15 India - Market size and forecast (2023-2028)
      • Chart on India - Market size and forecast (2023-2028) ($ million)
      • Data Table on India - Market size and forecast (2023-2028) ($ million)
      • Chart on India - Year-over-year growth (2023-2028) (%)
      • Data Table on India - Year-over-year growth (2023-2028) (%)
    • 12.16 South Korea - Market size and forecast (2023-2028)
      • Chart on South Korea - Market size and forecast (2023-2028) ($ million)
      • Data Table on South Korea - Market size and forecast (2023-2028) ($ million)
      • Chart on South Korea - Year-over-year growth (2023-2028) (%)
      • Data Table on South Korea - Year-over-year growth (2023-2028) (%)
    • 12.17 France - Market size and forecast (2023-2028)
      • Chart on France - Market size and forecast (2023-2028) ($ million)
      • Data Table on France - Market size and forecast (2023-2028) ($ million)
      • Chart on France - Year-over-year growth (2023-2028) (%)
      • Data Table on France - Year-over-year growth (2023-2028) (%)
    • 12.18 Italy - Market size and forecast (2023-2028)
      • Chart on Italy - Market size and forecast (2023-2028) ($ million)
      • Data Table on Italy - Market size and forecast (2023-2028) ($ million)
      • Chart on Italy - Year-over-year growth (2023-2028) (%)
      • Data Table on Italy - Year-over-year growth (2023-2028) (%)
    • 12.19 Brazil - Market size and forecast (2023-2028)
      • Chart on Brazil - Market size and forecast (2023-2028) ($ million)
      • Data Table on Brazil - Market size and forecast (2023-2028) ($ million)
      • Chart on Brazil - Year-over-year growth (2023-2028) (%)
      • Data Table on Brazil - Year-over-year growth (2023-2028) (%)
    • 12.20 UAE - Market size and forecast (2023-2028)
      • Chart on UAE - Market size and forecast (2023-2028) ($ million)
      • Data Table on UAE - Market size and forecast (2023-2028) ($ million)
      • Chart on UAE - Year-over-year growth (2023-2028) (%)
      • Data Table on UAE - Year-over-year growth (2023-2028) (%)
    • 12.21 Spain - Market size and forecast (2023-2028)
      • Chart on Spain - Market size and forecast (2023-2028) ($ million)
      • Data Table on Spain - Market size and forecast (2023-2028) ($ million)
      • Chart on Spain - Year-over-year growth (2023-2028) (%)
      • Data Table on Spain - Year-over-year growth (2023-2028) (%)
    • 12.22 Mexico - Market size and forecast (2023-2028)
      • Chart on Mexico - Market size and forecast (2023-2028) ($ million)
      • Data Table on Mexico - Market size and forecast (2023-2028) ($ million)
      • Chart on Mexico - Year-over-year growth (2023-2028) (%)
      • Data Table on Mexico - Year-over-year growth (2023-2028) (%)
    • 12.23 Rest of World (ROW) - Market size and forecast (2023-2028)
      • Chart on Rest of World (ROW) - Market size and forecast (2023-2028) ($ million)
      • Data Table on Rest of World (ROW) - Market size and forecast (2023-2028) ($ million)
      • Chart on Rest of World (ROW) - Year-over-year growth (2023-2028) (%)
      • Data Table on Rest of World (ROW) - Year-over-year growth (2023-2028) (%)

    13 Drivers, Challenges, and Opportunity/Restraints

    • 13.1 Market drivers
      • 13.2 Market challenges
        • 13.3 Impact of drivers and challenges
          • Impact of drivers and challenges in 2023 and 2028
        • 13.4 Market opportunities/restraints

          14 Competitive Landscape

          • 14.1 Overview
            • 14.2 Competitive Landscape
              • Overview on criticality of inputs and factors of differentiation
            • 14.3 Landscape disruption
              • Overview on factors of disruption
            • 14.4 Industry risks
              • Impact of key risks on business

            15 Competitive Analysis

            • 15.1 Companies profiled
              • Companies covered
            • 15.2 Market positioning of companies
              • Matrix on companies position and classification
            • 15.3 SMA Solar Technology AG
              • SMA Solar Technology AG - Overview
              • SMA Solar Technology AG - Product / Service
              • SMA Solar Technology AG - Key offerings
            • 15.4 Fronius International GmbH
              • Fronius International GmbH - Overview
              • Fronius International GmbH - Product / Service
              • Fronius International GmbH - Key offerings
            • 15.5 ABB Power Grids
              • ABB Power Grids - Overview
              • ABB Power Grids - Product / Service
              • ABB Power Grids - Key offerings
            • 15.6 Schneider Electric SE
              • Schneider Electric SE - Overview
              • Schneider Electric SE - Product / Service
              • Schneider Electric SE - Key offerings
            • 15.7 Siemens AG
              • Siemens AG - Overview
              • Siemens AG - Product / Service
              • Siemens AG - Key offerings
            • 15.8 Delta Electronics Inc.
              • Delta Electronics Inc. - Overview
              • Delta Electronics Inc. - Product / Service
              • Delta Electronics Inc. - Key offerings
            • 15.9 TMEIC Corporation
              • TMEIC Corporation - Overview
              • TMEIC Corporation - Product / Service
              • TMEIC Corporation - Key offerings
            • 15.10 Mitsubishi Electric Corporation
              • Mitsubishi Electric Corporation - Overview
              • Mitsubishi Electric Corporation - Product / Service
              • Mitsubishi Electric Corporation - Key offerings
            • 15.11 Yaskawa Electric Corporation
              • Yaskawa Electric Corporation - Overview
              • Yaskawa Electric Corporation - Product / Service
              • Yaskawa Electric Corporation - Key offerings
            • 15.12 Omron Corporation
              • Omron Corporation - Overview
              • Omron Corporation - Product / Service
              • Omron Corporation - Key offerings
            • 15.13 Sungrow Power Supply Co. Ltd.
              • Sungrow Power Supply Co. Ltd. - Overview
              • Sungrow Power Supply Co. Ltd. - Product / Service
              • Sungrow Power Supply Co. Ltd. - Key offerings
            • 15.14 Huawei Technologies Co. Ltd.
              • Huawei Technologies Co. Ltd. - Overview
              • Huawei Technologies Co. Ltd. - Product / Service
              • Huawei Technologies Co. Ltd. - Key offerings
            • 15.15 GoodWe Power Supply Technology Co. Ltd.
              • GoodWe Power Supply Technology Co. Ltd. - Overview
              • GoodWe Power Supply Technology Co. Ltd. - Product / Service
              • GoodWe Power Supply Technology Co. Ltd. - Key offerings
            • 15.16 Ginlong Technologies
              • Ginlong Technologies - Overview
              • Ginlong Technologies - Product / Service
              • Ginlong Technologies - Key offerings
            • 15.17 Enphase Energy Inc.
              • Enphase Energy Inc. - Overview
              • Enphase Energy Inc. - Product / Service
              • Enphase Energy Inc. - Key offerings
            • 15.18 SolarEdge Technologies Inc.
              • SolarEdge Technologies Inc. - Overview
              • SolarEdge Technologies Inc. - Product / Service
              • SolarEdge Technologies Inc. - Key offerings
            • 15.19 OutBack Power Technologies
              • OutBack Power Technologies - Overview
              • OutBack Power Technologies - Product / Service
              • OutBack Power Technologies - Key offerings
            • 15.20 Victron Energy
              • Victron Energy - Overview
              • Victron Energy - Product / Service
              • Victron Energy - Key offerings
            • 15.21 KACO new energy GmbH
              • KACO new energy GmbH - Overview
              • KACO new energy GmbH - Product / Service
              • KACO new energy GmbH - Key offerings
            • 15.22 Eaton Corporation plc
              • Eaton Corporation plc - Overview
              • Eaton Corporation plc - Product / Service
              • Eaton Corporation plc - Key offerings
            • 15.23 ABB Ltd.
              • ABB Ltd. - Overview
              • ABB Ltd. - Product / Service
              • ABB Ltd. - Key offerings
            • 15.24 Altenergy Power System Inc.
              • Altenergy Power System Inc. - Overview
              • Altenergy Power System Inc. - Product / Service
              • Altenergy Power System Inc. - Key offerings
            • 15.25 Danfoss AS
              • Danfoss AS - Overview
              • Danfoss AS - Product / Service
              • Danfoss AS - Key offerings
            • 15.26 DARFON ELECTRONICS CORP.
              • DARFON ELECTRONICS CORP. - Overview
              • DARFON ELECTRONICS CORP. - Product / Service
              • DARFON ELECTRONICS CORP. - Key offerings
            • 15.27 Delta Electronics Inc.
              • Delta Electronics Inc. - Overview
              • Delta Electronics Inc. - Product / Service
              • Delta Electronics Inc. - Key offerings
            • 15.28 Eaton Corp. Plc
              • Eaton Corp. Plc - Overview
              • Eaton Corp. Plc - Product / Service
              • Eaton Corp. Plc - Key offerings
            • 15.29 Enphase Energy Inc.
              • Enphase Energy Inc. - Overview
              • Enphase Energy Inc. - Product / Service
              • Enphase Energy Inc. - Key offerings
            • 15.30 Fronius International GmbH
              • Fronius International GmbH - Overview
              • Fronius International GmbH - Product / Service
              • Fronius International GmbH - Key offerings
            • 15.31 General Electric Co.
              • General Electric Co. - Overview
              • General Electric Co. - Product / Service
              • General Electric Co. - Key offerings
            • 15.32 Huawei Technologies Co. Ltd.
              • Huawei Technologies Co. Ltd. - Overview
              • Huawei Technologies Co. Ltd. - Product / Service
              • Huawei Technologies Co. Ltd. - Key offerings
            • 15.33 Mitsubishi Electric Corp.
              • Mitsubishi Electric Corp. - Overview
              • Mitsubishi Electric Corp. - Product / Service
              • Mitsubishi Electric Corp. - Key offerings
            • 15.34 OMRON Corp.
              • OMRON Corp. - Overview
              • OMRON Corp. - Product / Service
              • OMRON Corp. - Key offerings
            • 15.35 Powerone Micro Systems Pvt. Ltd.
              • Powerone Micro Systems Pvt. Ltd. - Overview
              • Powerone Micro Systems Pvt. Ltd. - Product / Service
              • Powerone Micro Systems Pvt. Ltd. - Key offerings
            • 15.36 Schneider Electric SE
              • Schneider Electric SE - Overview
              • Schneider Electric SE - Product / Service
              • Schneider Electric SE - Key offerings
            • 15.37 Shenzen Growatt New Energy Technology Co. Ltd.
              • Shenzen Growatt New Energy Technology Co. Ltd. - Overview
              • Shenzen Growatt New Energy Technology Co. Ltd. - Product / Service
              • Shenzen Growatt New Energy Technology Co. Ltd. - Key offerings
            • 15.38 Siemens AG
              • Siemens AG - Overview
              • Siemens AG - Product / Service
              • Siemens AG - Key offerings
            • 15.39 SMA Solar Technology AG
              • SMA Solar Technology AG - Overview
              • SMA Solar Technology AG - Product / Service
              • SMA Solar Technology AG - Key offerings
            • 15.40 SolarEdge Technologies Inc.
              • SolarEdge Technologies Inc. - Overview
              • SolarEdge Technologies Inc. - Product / Service
              • SolarEdge Technologies Inc. - Key offerings
            • 15.41 Sungrow Power Supply Co. Ltd.
              • Sungrow Power Supply Co. Ltd. - Overview
              • Sungrow Power Supply Co. Ltd. - Product / Service
              • Sungrow Power Supply Co. Ltd. - Key offerings
            • 15.42 Vertiv Holdings Co.
              • Vertiv Holdings Co. - Overview
              • Vertiv Holdings Co. - Product / Service
              • Vertiv Holdings Co. - Key offerings

            16 Appendix

            • 16.1 Scope of the report
              • 16.2 Inclusions and exclusions checklist
                • Inclusions checklist
                • Exclusions checklist
              • 16.3 Currency conversion rates for US$
                • Currency conversion rates for US$
              • 16.4 Research methodology
                • Research methodology
              • 16.5 Data procurement
                • Information sources
              • 16.6 Data validation
                • Data validation
              • 16.7 Validation techniques employed for market sizing
                • Validation techniques employed for market sizing
              • 16.8 Data synthesis
                • Data synthesis
              • 16.9 360 degree market analysis
                • 360 degree market analysis
              • 16.10 List of abbreviations
                • List of abbreviations

              Research Methodology

              Technavio presents a detailed picture of the market by way of study, synthesis, and summation of data from multiple sources. The analysts have presented the various facets of the market with a particular focus on identifying the key industry influencers. The data thus presented is comprehensive, reliable, and the result of extensive research, both primary and secondary.

              INFORMATION SOURCES

              Primary sources

              • Manufacturers and suppliers
              • Channel partners
              • Industry experts
              • Strategic decision makers

              Secondary sources

              • Industry journals and periodicals
              • Government data
              • Financial reports of key industry players
              • Historical data
              • Press releases

              DATA ANALYSIS

              Data Synthesis

              • Collation of data
              • Estimation of key figures
              • Analysis of derived insights

              Data Validation

              • Triangulation with data models
              • Reference against proprietary databases
              • Corroboration with industry experts

              REPORT WRITING

              Qualitative

              • Market drivers
              • Market challenges
              • Market trends
              • Five forces analysis

              Quantitative

              • Market size and forecast
              • Market segmentation
              • Geographical insights
              • Competitive landscape

              Interested in this report?

              Get your sample now to see our research methodology and insights!

              Download Now

              Frequently Asked Questions

              Inverter market growth will increase by $ 32.38 bn during 2024-2028.

              The Inverter market is expected to grow at a CAGR of 6.78% during 2024-2028.

              Inverter market is segmented by Application( Motor drive, Renewable energy, UPS) Type( On-grid, Off-grid, North America, MEA, South America)

              SMA Solar Technology AG, Fronius International GmbH, ABB Power Grids, Schneider Electric SE, Siemens AG, Delta Electronics Inc., TMEIC Corporation, Mitsubishi Electric Corporation, Yaskawa Electric Corporation, Omron Corporation, Sungrow Power Supply Co. Ltd., Huawei Technologies Co. Ltd., GoodWe Power Supply Technology Co. Ltd., Ginlong Technologies, Enphase Energy Inc., SolarEdge Technologies Inc., OutBack Power Technologies, Victron Energy, KACO new energy GmbH, Eaton Corporation plc are a few of the key vendors in the Inverter market.

              APAC will register the highest growth rate of 39% among the other regions. Therefore, the Inverter market in APAC is expected to garner significant business opportunities for the vendors during the forecast period.

              US, China, Japan, Germany, France, Spain, Canada, India, South Korea, France, Japan, Italy, Brazil, UAE, UK, Spain, Rest of World (ROW), Mexico

              • Rise in wind energy consumptionCountries worldwide are shifting their focus toward the use of renewable sources to produce power because of depleting conventional sources of energy and growing concerns about GHG emissions. Among all renewable sources of energy is the driving factor this market.
              • wind power is the most efficient source of power generation. It is also one of the most abundant sources of alternative energy. In 2020 is the driving factor this market.
              • China was the leading country in terms of cumulative installed wind power capacity is the driving factor this market.
              • followed by the US and Europe. Increased endeavors in these countries to tap the potential of wind energy bode well for the overall market growth. For instance is the driving factor this market.
              • in 2021 is the driving factor this market.
              • offshore wind installations accounted for about one-fifth of the gross annual wind installations in Europe. The size and scale of offshore wind installations in Europe continue to rise. 2021 the installed offshore wind capacity in the EU was 14.6 GW in 2021 and was set to increase by at least 25 times by 2030. Growing awareness about the benefits of wind energy is fueling the demand for wind turbine inverters because they can increase the rotational speed and energy output while ensuring a high rate of return for investors from wind projects. The demand for wind turbine inverters is increasing with a concomitant increase in the demand for wind power plants.Countries like Denmark is the driving factor this market.
              • Spain is the driving factor this market.
              • Germany is the driving factor this market.
              • and the UK produce over 10% of their power from wind energy. Moreover is the driving factor this market.
              • the rising cost of fossil fuels is making wind power an economical source of renewable energy. We expect the growth in wind energy consumption to propel the demand for wind turbine inverters during the forecast period is the driving factor this market.

              The Inverter market vendors should focus on grabbing business opportunities from the Motor drive segment as it accounted for the largest market share in the base year.