Sparkling Water Market Analysis, Size, and Forecast 2026-2030: North America (US, Canada, and Mexico), Europe (Germany, UK, and France), APAC (China, Japan, and India), Middle East and Africa (UAE, Saudi Arabia, and South Africa), South America (Brazil and Argentina), and Rest of World (ROW)

Sparkling Water Market Analysis, Size, and Forecast 2026-2030:
North America (US, Canada, and Mexico), Europe (Germany, UK, and France), APAC (China, Japan, and India), Middle East and Africa (UAE, Saudi Arabia, and South Africa), South America (Brazil and Argentina), and Rest of World (ROW)

Published: Mar 2026 293 Pages SKU: IRTNTR75248

Market Overview at a Glance

$35.15 B
Market Opportunity
11.8%
CAGR 2025 - 2030
43.1%
North America Growth
$18.41 B
Hypermarkets segment 2024

Sparkling Water Market Size 2026-2030

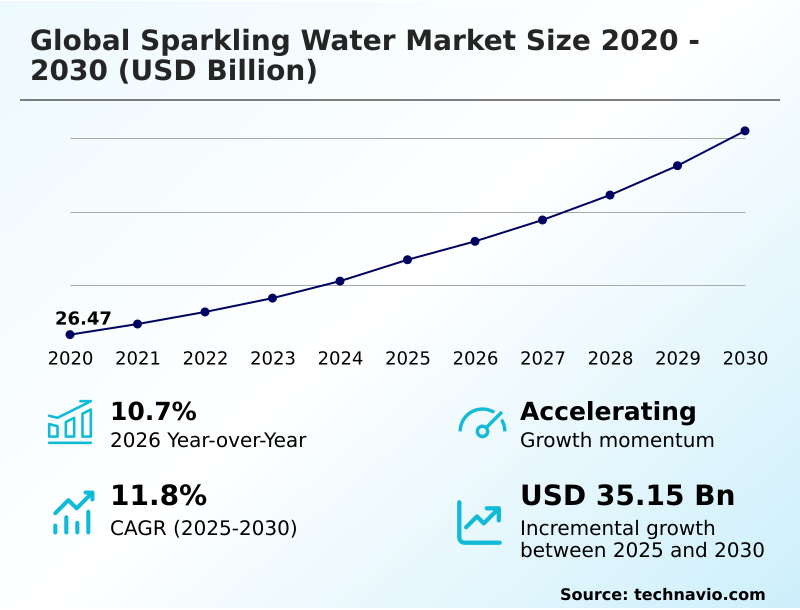
The sparkling water market size is valued to increase by USD 35.15 billion, at a CAGR of 11.8% from 2025 to 2030. Increasing consumer health consciousness levels will drive the sparkling water market.

Major Market Trends & Insights

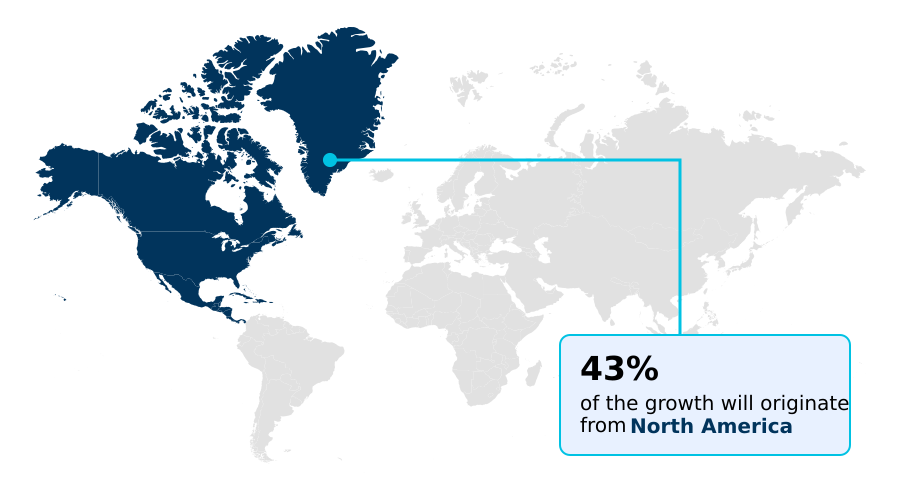
  • North America dominated the market and accounted for a 43.1% growth during the forecast period.
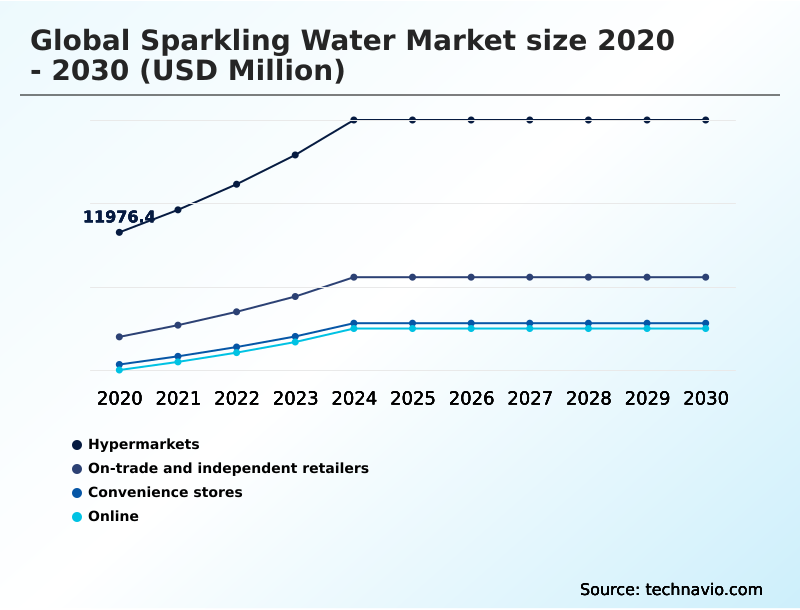
  • By Distribution Channel - Hypermarkets segment was valued at USD 18.41 billion in 2024
  • By Product - Unflavored sparkling water segment accounted for the largest market revenue share in 2024

Market Size & Forecast

  • Market Opportunities: USD 55.58 billion
  • Market Future Opportunities: USD 35.15 billion
  • CAGR from 2025 to 2030 : 11.8%

Market Summary

  • The Sparkling Water Market is defined by a significant consumer migration away from sugary soft drinks toward healthier hydration choices. This shift is fueling rapid innovation in product formulation, where clean label ingredient sourcing and the development of zero-calorie beverage formulation are paramount.
  • Key trends include the integration of functional ingredients, such as electrolyte-infused hydration and natural caffeine integration, to appeal to wellness-oriented consumers. Simultaneously, the industry is grappling with the need for more sustainable packaging solutions, driving investment in recycled PET bottling and recycled aluminum can manufacturing. A critical operational challenge involves managing volatile supply chains.
  • For instance, a firm might implement an AI-driven inventory management system to forecast regional demand for specific botanical flavor infusion products, ensuring efficient distribution from smart bottling plant automation facilities while maintaining cold chain integrity monitoring to preserve quality and effervescence retention technology across the logistics network. This strategic balancing of innovation, sustainability, and operational excellence characterizes the competitive landscape.

What will be the Size of the Sparkling Water Market during the forecast period?

Get Key Insights on Market Forecast (PDF) Request Free Sample

How is the Sparkling Water Market Segmented?

The sparkling water industry research report provides comprehensive data (region-wise segment analysis), with forecasts and estimates in "USD million" for the period 2026-2030, as well as historical data from 2020-2024 for the following segments.

  • Distribution channel
    • Hypermarkets
    • On-trade and independent retailers
    • Convenience stores
    • Online
  • Product
    • Unflavored sparkling water
    • Flavored sparkling water
  • Packaging
    • Plastic bottles
    • Cans
    • Glass bottles
  • Geography
    • North America
      • US
      • Canada
      • Mexico
    • Europe
      • Germany
      • UK
      • France
    • APAC
      • China
      • Japan
      • India
    • Middle East and Africa
      • UAE
      • Saudi Arabia
      • South Africa
    • South America
      • Brazil
      • Argentina
    • Rest of World (ROW)

By Distribution Channel Insights

The hypermarkets segment is estimated to witness significant growth during the forecast period.

Hypermarkets remain the dominant distribution channel, leveraging vast retail shelf space optimization and high consumer foot traffic to drive volume. These outlets facilitate direct comparison of various healthy hydration options, from private label to premium brands.

The successful execution of in-store promotions is critical, with data indicating that targeted campaigns can lift sales of new products by over 25%.

As the beverage premiumization trend continues, hypermarkets are adapting by expanding sections for artisanal beverage production and specialty drink market offerings, influencing the entire beverage distribution networks.

This channel's ability to offer bulk and multipack formats reinforces its importance for routine consumer purchases, solidifying its central role in the market.

Request Free Sample

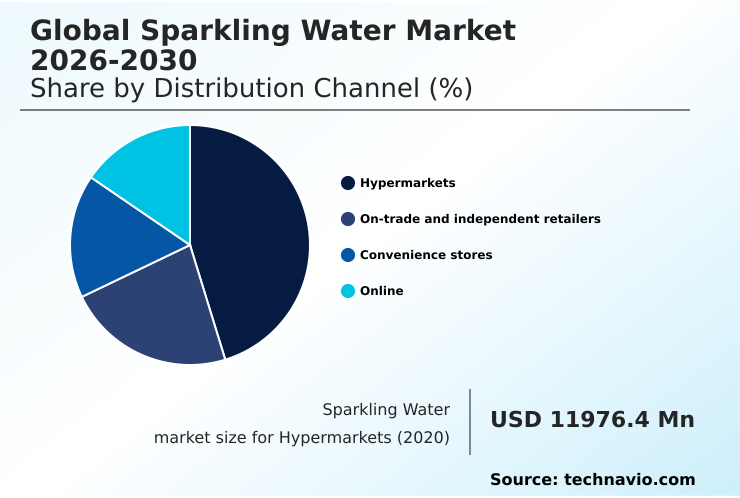
The Hypermarkets segment was valued at USD 18.41 billion in 2024 and showed a gradual increase during the forecast period.

Request Free Sample

Regional Analysis

North America is estimated to contribute 43.1% to the growth of the global market during the forecast period.Technavio’s analysts have elaborately explained the regional trends and drivers that shape the market during the forecast period.

See How Sparkling Water Market Demand is Rising in North America Request Free Sample

The market's geographic landscape is diverse, with North America leading innovation in on-the-go packaging design and contributing over 43% of the market's incremental growth.

This region's focus on a direct-to-consumer subscription models contrasts with Europe, where a deep-rooted tradition of premium water sourcing and artesian spring water sourcing underpins the market.

In Europe, the emphasis is on premium glass bottle production and mixology-grade mixer quality.

Meanwhile, the APAC region is expanding at a rate nearly a full percentage point higher than Europe, driven by urbanization and rising health awareness, creating demand for home carbonation device compatibility and lightweight bottle design to serve new consumer segments.

Market Dynamics

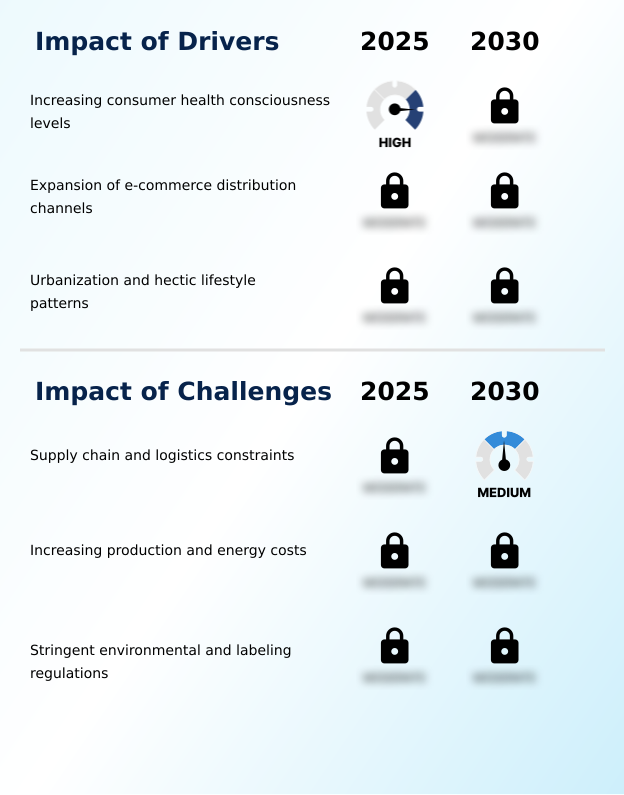
Our researchers analyzed the data with 2025 as the base year, along with the key drivers, trends, and challenges. A holistic analysis of drivers will help companies refine their marketing strategies to gain a competitive advantage.

  • The strategic landscape of the Global Sparkling Water Market 2026-2030 is heavily influenced by the impact of sugar tax on sparkling water, which has accelerated consumer trends in flavored sparkling water. This has pushed companies to innovate, leading to the growth of functional sparkling water beverages and a focus on the health benefits of unflavored sparkling water.
  • In response, sustainable packaging in the beverage industry has become a critical competitive differentiator, forcing a constant comparison of plastic vs aluminum packaging and bolstering recycling initiatives for beverage containers. The demand for premium non-alcoholic drinks is met with the use of botanical infusions in carbonated drinks, aligning with the clean label sparkling water market.
  • E-commerce strategies for beverage brands are becoming essential to manage the impact of online retail on water sales, especially for navigating supply chain challenges for water bottling. Companies that successfully adopt advanced distribution channels for craft beverages have seen their logistics efficiency improve by over 15% compared to legacy systems.
  • This is vital for capitalizing on rapidly changing flavor trends in the carbonated water market, the role of sparkling water in mixology, and managing the complex logistics of temperature-controlled beverage transport. This dynamic environment also creates private label opportunities in sparkling water, requiring unique marketing strategies for healthy hydration and innovations in beverage carbonation technology.

What are the key market drivers leading to the rise in the adoption of Sparkling Water Industry?

  • Increasing consumer health consciousness is a key driver for the market's growth.

  • The primary driver for the market is a global shift toward healthy hydration options, as consumers actively seek unsweetened beverage alternatives.
  • This mindful consumption trend is a direct response to rising health awareness, with sugar-free beverage choices becoming a default for many.
  • The demand for natural and organic ingredients and transparent ingredient labeling has pushed companies to reformulate products, removing artificial additives.
  • This pivot away from traditional soft drinks is significant, with markets that have implemented sugar taxes showing a 10% higher growth rate for low-calorie carbonated drinks.
  • This consumer-led movement supports the entire lifestyle beverage category, positioning sparkling water as a go-to for daily, guilt-free refreshment and post-workout recovery drinks.

What are the market trends shaping the Sparkling Water Industry?

  • A key market trend is the introduction of botanical infusions and exotic fruit profiles. This caters to consumers seeking sophisticated alternatives to traditional flavors.

  • Innovation in the market is accelerating, driven by consumer demand for sophisticated flavor profiles and holistic wellness products. The introduction of herbal and floral infusions, along with exotic fruit ingredients, is redefining the category beyond simple refreshment. This trend towards artisanal beverage production is supported by advanced natural mineral water carbonation techniques that preserve delicate tastes.
  • Functional benefits are also a key focus, with the incorporation of electrolytes and adaptogens to create wellness-focused drinks. This beverage premiumization trend is evident in both product formulation and on-the-go packaging design, with companies investing in R&D to meet the evolving preferences of the adult soft drink market.
  • New launches are seeing adoption rates nearly double that of simple line extensions.

What challenges does the Sparkling Water Industry face during its growth?

  • Supply chain and logistics constraints present a key challenge affecting industry growth.

  • Key challenges center on operational and logistical complexities that can impact profitability and market access. Volatile transportation costs, which have risen over 25% on some routes, directly affect margins for brands without localized beverage distribution networks. Ensuring cold chain integrity monitoring from production to retail is critical for maintaining quality but adds another layer of expense.
  • Furthermore, securing consistent supplies of environmentally friendly packaging materials, such as recycled aluminum and post-consumer resin, remains a significant hurdle. These supply chain vulnerabilities, coupled with the need for stringent sugar tax compliance strategy, require robust supply chain resilience planning and sophisticated, often AI-driven, inventory management systems to mitigate risks and maintain a competitive edge.

Exclusive Technavio Analysis on Customer Landscape

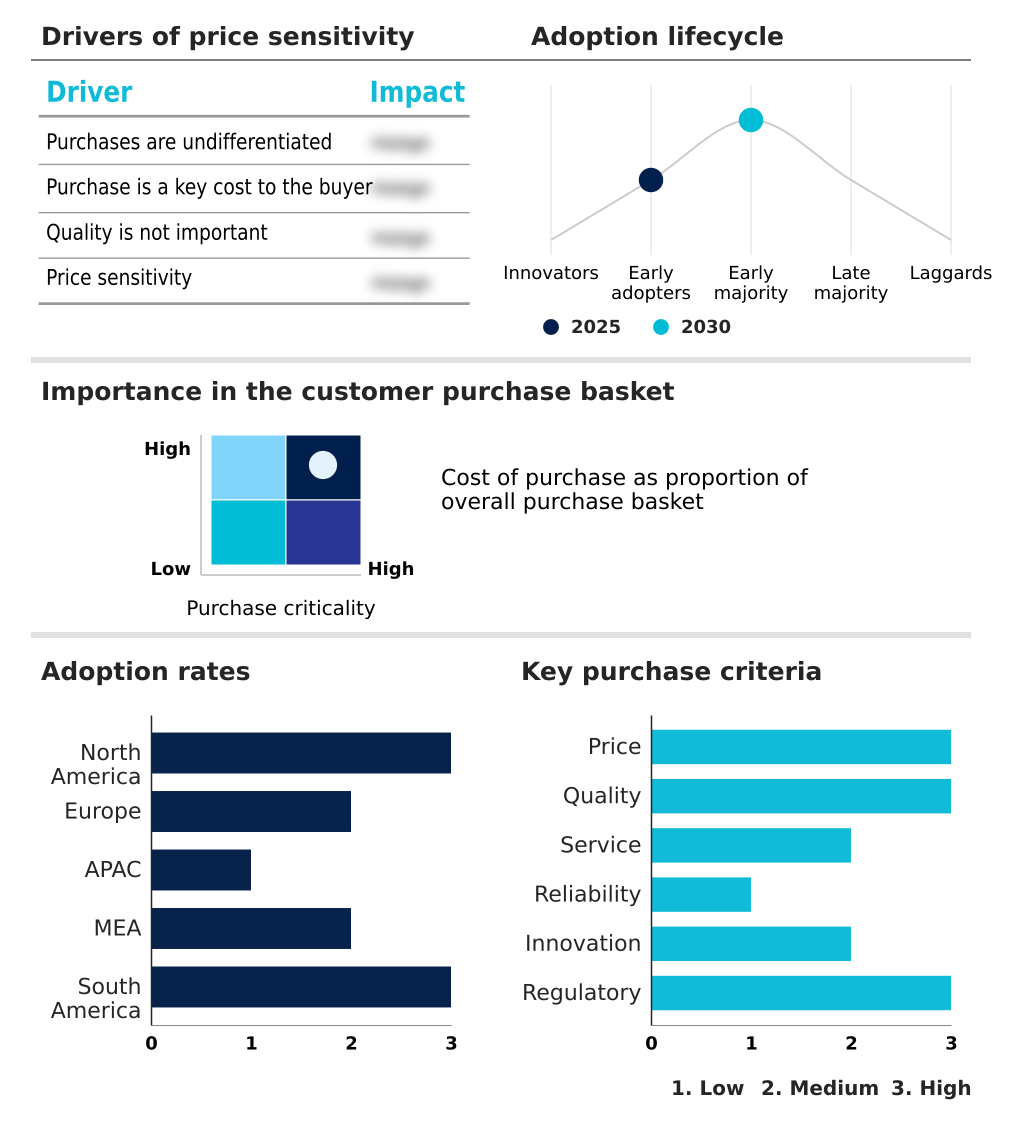
The sparkling water market forecasting report includes the adoption lifecycle of the market, covering from the innovator’s stage to the laggard’s stage. It focuses on adoption rates in different regions based on penetration. Furthermore, the sparkling water market report also includes key purchase criteria and drivers of price sensitivity to help companies evaluate and develop their market growth analysis strategies.

Customer Landscape of Sparkling Water Industry

Competitive Landscape

Companies are implementing various strategies, such as strategic alliances, sparkling water market forecast, partnerships, mergers and acquisitions, geographical expansion, and product/service launches, to enhance their presence in the industry.

Anheuser Busch InBev SA NV - Offers a range of sparkling water and seltzer products, targeting growing consumer demand for healthier, non-alcoholic beverage alternatives.

The industry research and growth report includes detailed analyses of the competitive landscape of the market and information about key companies, including:

  • Anheuser Busch InBev SA NV
  • Aqua Maestro Inc.
  • Big Watt Beverage Co.
  • Carpathian Springs SA
  • Danone SA
  • JAB Holding Co.
  • Keurig Dr Pepper Inc.
  • Klarbrunn Inc.
  • Mountain Valley Spring Co.
  • National Beverage Corp.
  • Nestle SA
  • PepsiCo Inc.
  • Polar Beverages
  • Primo Water Corp.
  • Rhodius Mineralquellen Co. KG
  • Talking Rain Beverage Co.
  • The Coca Cola Co.
  • Volay Water
  • VOSS of Norway AS
  • WakeWater Beverage Co.

Qualitative and quantitative analysis of companies has been conducted to help clients understand the wider business environment as well as the strengths and weaknesses of key industry players. Data is qualitatively analyzed to categorize companies as pure play, category-focused, industry-focused, and diversified; it is quantitatively analyzed to categorize companies as dominant, leading, strong, tentative, and weak.

Recent Development and News in Sparkling water market

  • In April 2025, Klarbrunn Inc. announced a new partnership with regional distributors in the United States to expand the availability of its naturally flavored sparkling water line in major metropolitan areas.
  • In February 2025, The Coca Cola Co. implemented a new high speed carbonation facility in Europe to enhance production efficiency and meet the rising demand for its sparkling water brands.
  • In February 2025, PepsiCo Inc. launched a new line of functional sparkling waters in the United States that are enriched with electrolytes and natural caffeine to cater to the needs of the active urban population.
  • In January 2025, Carpathian Springs SA introduced a new bottle design made from fifty percent recycled plastic to address environmental concerns while maintaining the functional benefits of the material.

Dive into Technavio’s robust research methodology, blending expert interviews, extensive data synthesis, and validated models for unparalleled Sparkling Water Market insights. See full methodology.

Market Scope
Page number 293
Base year 2025
Historic period 2020-2024
Forecast period 2026-2030
Growth momentum & CAGR Accelerate at a CAGR of 11.8%
Market growth 2026-2030 USD 35150.7 million
Market structure Fragmented
YoY growth 2025-2026(%) 10.7%
Key countries US, Canada, Mexico, Germany, UK, France, Italy, Spain, The Netherlands, China, Japan, India, South Korea, Australia, Indonesia, UAE, Saudi Arabia, South Africa, Turkey, Israel, Brazil, Argentina and Chile
Competitive landscape Leading Companies, Market Positioning of Companies, Competitive Strategies, and Industry Risks

Request Free Sample

Research Analyst Overview

  • The Global Sparkling Water Market 2026-2030 is characterized by intense innovation in both product and process. Strategic imperatives are driving firms toward functional beverage enrichment and clean label ingredient sourcing, utilizing technologies from natural fruit essence extraction to natural caffeine integration.
  • A key boardroom decision revolves around capital investment in sustainable packaging solutions, balancing the costs of recycled PET bottling and recycled aluminum can manufacturing against consumer demand for environmental stewardship. Firms that have adopted smart bottling plant automation report up to a 20% improvement in operational efficiency and effervescence retention technology, ensuring consistent bubble size control and mixology-grade mixer quality.
  • Success hinges on a holistic approach encompassing everything from artesian spring water sourcing and advanced water filtration technology to AI-driven inventory management and cold chain integrity monitoring. This requires mastering carbon dioxide infusion process, temperature-controlled logistics, and post-consumer resin integration to meet both regulatory and consumer expectations.

What are the Key Data Covered in this Sparkling Water Market Research and Growth Report?

  • What is the expected growth of the Sparkling Water Market between 2026 and 2030?

    • USD 35.15 billion, at a CAGR of 11.8%

  • What segmentation does the market report cover?

    • The report is segmented by Distribution Channel (Hypermarkets, On-trade and independent retailers, Convenience stores, and Online), Product (Unflavored sparkling water, and Flavored sparkling water), Packaging (Plastic bottles, Cans, and Glass bottles) and Geography (North America, Europe, APAC, Middle East and Africa, South America)

  • Which regions are analyzed in the report?

    • North America, Europe, APAC, Middle East and Africa and South America

  • What are the key growth drivers and market challenges?

    • Increasing consumer health consciousness levels, Supply chain and logistics constraints

  • Who are the major players in the Sparkling Water Market?

    • Anheuser Busch InBev SA NV, Aqua Maestro Inc., Big Watt Beverage Co., Carpathian Springs SA, Danone SA, JAB Holding Co., Keurig Dr Pepper Inc., Klarbrunn Inc., Mountain Valley Spring Co., National Beverage Corp., Nestle SA, PepsiCo Inc., Polar Beverages, Primo Water Corp., Rhodius Mineralquellen Co. KG, Talking Rain Beverage Co., The Coca Cola Co., Volay Water, VOSS of Norway AS and WakeWater Beverage Co.

Market Research Insights

  • The market's dynamics are shaped by a pronounced consumer shift, with data showing a consistent 5% annual decline in traditional soda consumption in several key markets. This has prompted a strategic pivot towards wellness-focused drinks, where brands focusing on this segment are seeing portfolio growth outperform legacy products by up to 15%.
  • The rise of e-commerce beverage sales has also been a transformative force, as direct-to-consumer models demonstrate a 20% higher customer retention rate compared to conventional retail channels. This digital transition is intensifying competition around sophisticated flavor profiles and the beverage premiumization trend, compelling companies to innovate beyond simple hydration.

We can help! Our analysts can customize this sparkling water market research report to meet your requirements.

Get in touch

1. Executive Summary

1.1 Market overview

Executive Summary - Chart on Market Overview
Executive Summary - Data Table on Market Overview
Executive Summary - Chart on Global Market Characteristics
Executive Summary - Chart on Market by Geography
Executive Summary - Chart on Market Segmentation by Distribution Channel
Executive Summary - Chart on Market Segmentation by Product
Executive Summary - Chart on Market Segmentation by Packaging
Executive Summary - Chart on Incremental Growth
Executive Summary - Data Table on Incremental Growth
Executive Summary - Chart on Company Market Positioning

2. Technavio Analysis

2.1 Analysis of price sensitivity, lifecycle, customer purchase basket, adoption rates, and purchase criteria

2.2 Criticality of inputs and Factors of differentiation

Chart on Overview on criticality of inputs and factors of differentiation

2.3 Factors of disruption

Chart on Overview on factors of disruption

2.4 Impact of drivers and challenges

Chart on Impact of drivers and challenges in 2025 and 2030

3. Market Landscape

3.1 Market ecosystem

Chart on Parent Market
Data Table on - Parent Market

3.2 Market characteristics

Chart on Market characteristics analysis

3.3 Value chain analysis

Chart on Value chain analysis

4. Market Sizing

4.1 Market definition

Data Table on Offerings of companies included in the market definition

4.2 Market segment analysis

Market segments

4.3 Market size 2025

4.4 Market outlook: Forecast for 2025-2030

Chart on Global - Market size and forecast 2025-2030 ($ million)
Data Table on Global - Market size and forecast 2025-2030 ($ million)
Chart on Global Market: Year-over-year growth 2025-2030 (%)
Data Table on Global Market: Year-over-year growth 2025-2030 (%)

5. Historic Market Size

5.1 Global Sparkling Water Market 2020 - 2024

Historic Market Size - Data Table on Global Sparkling Water Market 2020 - 2024 ($ million)

5.2 Distribution Channel segment analysis 2020 - 2024

Historic Market Size - Distribution Channel Segment 2020 - 2024 ($ million)

5.3 Product segment analysis 2020 - 2024

Historic Market Size - Product Segment 2020 - 2024 ($ million)

5.4 Packaging segment analysis 2020 - 2024

Historic Market Size - Packaging Segment 2020 - 2024 ($ million)

5.5 Geography segment analysis 2020 - 2024

Historic Market Size - Geography Segment 2020 - 2024 ($ million)

5.6 Country segment analysis 2020 - 2024

Historic Market Size - Country Segment 2020 - 2024 ($ million)

6. Qualitative Analysis

6.1 Impact of AI on Global Sparkling Water Market

6.2 Impact of Geopolitical Conflicts on Global Sparkling Water Market

7. Five Forces Analysis

7.1 Five forces summary

Five forces analysis - Comparison between 2025 and 2030

7.2 Bargaining power of buyers

Bargaining power of buyers - Impact of key factors 2025 and 2030

7.3 Bargaining power of suppliers

Bargaining power of suppliers - Impact of key factors in 2025 and 2030

7.4 Threat of new entrants

Threat of new entrants - Impact of key factors in 2025 and 2030

7.5 Threat of substitutes

Threat of substitutes - Impact of key factors in 2025 and 2030

7.6 Threat of rivalry

Threat of rivalry - Impact of key factors in 2025 and 2030

7.7 Market condition

Chart on Market condition - Five forces 2025 and 2030

8. Market Segmentation by Distribution Channel

8.1 Market segments

Chart on Distribution Channel - Market share 2025-2030 (%)
Data Table on Distribution Channel - Market share 2025-2030 (%)

8.2 Comparison by Distribution Channel

Chart on Comparison by Distribution Channel
Data Table on Comparison by Distribution Channel

8.3 Hypermarkets - Market size and forecast 2025-2030

Chart on Hypermarkets - Market size and forecast 2025-2030 ($ million)
Data Table on Hypermarkets - Market size and forecast 2025-2030 ($ million)
Chart on Hypermarkets - Year-over-year growth 2025-2030 (%)
Data Table on Hypermarkets - Year-over-year growth 2025-2030 (%)

8.4 On-trade and independent retailers - Market size and forecast 2025-2030

Chart on On-trade and independent retailers - Market size and forecast 2025-2030 ($ million)
Data Table on On-trade and independent retailers - Market size and forecast 2025-2030 ($ million)
Chart on On-trade and independent retailers - Year-over-year growth 2025-2030 (%)
Data Table on On-trade and independent retailers - Year-over-year growth 2025-2030 (%)

8.5 Convenience stores - Market size and forecast 2025-2030

Chart on Convenience stores - Market size and forecast 2025-2030 ($ million)
Data Table on Convenience stores - Market size and forecast 2025-2030 ($ million)
Chart on Convenience stores - Year-over-year growth 2025-2030 (%)
Data Table on Convenience stores - Year-over-year growth 2025-2030 (%)

8.6 Online - Market size and forecast 2025-2030

Chart on Online - Market size and forecast 2025-2030 ($ million)
Data Table on Online - Market size and forecast 2025-2030 ($ million)
Chart on Online - Year-over-year growth 2025-2030 (%)
Data Table on Online - Year-over-year growth 2025-2030 (%)

8.7 Market opportunity by Distribution Channel

Market opportunity by Distribution Channel ($ million)
Data Table on Market opportunity by Distribution Channel ($ million)

9. Market Segmentation by Product

9.1 Market segments

Chart on Product - Market share 2025-2030 (%)
Data Table on Product - Market share 2025-2030 (%)

9.2 Comparison by Product

Chart on Comparison by Product
Data Table on Comparison by Product

9.3 Unflavored sparkling water - Market size and forecast 2025-2030

Chart on Unflavored sparkling water - Market size and forecast 2025-2030 ($ million)
Data Table on Unflavored sparkling water - Market size and forecast 2025-2030 ($ million)
Chart on Unflavored sparkling water - Year-over-year growth 2025-2030 (%)
Data Table on Unflavored sparkling water - Year-over-year growth 2025-2030 (%)

9.4 Flavored sparkling water - Market size and forecast 2025-2030

Chart on Flavored sparkling water - Market size and forecast 2025-2030 ($ million)
Data Table on Flavored sparkling water - Market size and forecast 2025-2030 ($ million)
Chart on Flavored sparkling water - Year-over-year growth 2025-2030 (%)
Data Table on Flavored sparkling water - Year-over-year growth 2025-2030 (%)

9.5 Market opportunity by Product

Market opportunity by Product ($ million)
Data Table on Market opportunity by Product ($ million)

10. Market Segmentation by Packaging

10.1 Market segments

Chart on Packaging - Market share 2025-2030 (%)
Data Table on Packaging - Market share 2025-2030 (%)

10.2 Comparison by Packaging

Chart on Comparison by Packaging
Data Table on Comparison by Packaging

10.3 Plastic bottles - Market size and forecast 2025-2030

Chart on Plastic bottles - Market size and forecast 2025-2030 ($ million)
Data Table on Plastic bottles - Market size and forecast 2025-2030 ($ million)
Chart on Plastic bottles - Year-over-year growth 2025-2030 (%)
Data Table on Plastic bottles - Year-over-year growth 2025-2030 (%)

10.4 Cans - Market size and forecast 2025-2030

Chart on Cans - Market size and forecast 2025-2030 ($ million)
Data Table on Cans - Market size and forecast 2025-2030 ($ million)
Chart on Cans - Year-over-year growth 2025-2030 (%)
Data Table on Cans - Year-over-year growth 2025-2030 (%)

10.5 Glass bottles - Market size and forecast 2025-2030

Chart on Glass bottles - Market size and forecast 2025-2030 ($ million)
Data Table on Glass bottles - Market size and forecast 2025-2030 ($ million)
Chart on Glass bottles - Year-over-year growth 2025-2030 (%)
Data Table on Glass bottles - Year-over-year growth 2025-2030 (%)

10.6 Market opportunity by Packaging

Market opportunity by Packaging ($ million)
Data Table on Market opportunity by Packaging ($ million)

11. Customer Landscape

11.1 Customer landscape overview

Analysis of price sensitivity, lifecycle, customer purchase basket, adoption rates, and purchase criteria

12. Geographic Landscape

12.1 Geographic segmentation

Chart on Market share by geography 2025-2030 (%)
Data Table on Market share by geography 2025-2030 (%)

12.2 Geographic comparison

Chart on Geographic comparison
Data Table on Geographic comparison

12.3 North America - Market size and forecast 2025-2030

Chart on North America - Market size and forecast 2025-2030 ($ million)
Data Table on North America - Market size and forecast 2025-2030 ($ million)
Chart on North America - Year-over-year growth 2025-2030 (%)
Data Table on North America - Year-over-year growth 2025-2030 (%)
Chart on Regional Comparison - North America
Data Table on Regional Comparison - North America

12.3.1 US - Market size and forecast 2025-2030

Chart on US - Market size and forecast 2025-2030 ($ million)
Data Table on US - Market size and forecast 2025-2030 ($ million)
Chart on US - Year-over-year growth 2025-2030 (%)
Data Table on US - Year-over-year growth 2025-2030 (%)

12.3.2 Canada - Market size and forecast 2025-2030

Chart on Canada - Market size and forecast 2025-2030 ($ million)
Data Table on Canada - Market size and forecast 2025-2030 ($ million)
Chart on Canada - Year-over-year growth 2025-2030 (%)
Data Table on Canada - Year-over-year growth 2025-2030 (%)

12.3.3 Mexico - Market size and forecast 2025-2030

Chart on Mexico - Market size and forecast 2025-2030 ($ million)
Data Table on Mexico - Market size and forecast 2025-2030 ($ million)
Chart on Mexico - Year-over-year growth 2025-2030 (%)
Data Table on Mexico - Year-over-year growth 2025-2030 (%)

12.4 Europe - Market size and forecast 2025-2030

Chart on Europe - Market size and forecast 2025-2030 ($ million)
Data Table on Europe - Market size and forecast 2025-2030 ($ million)
Chart on Europe - Year-over-year growth 2025-2030 (%)
Data Table on Europe - Year-over-year growth 2025-2030 (%)
Chart on Regional Comparison - Europe
Data Table on Regional Comparison - Europe

12.4.1 Germany - Market size and forecast 2025-2030

Chart on Germany - Market size and forecast 2025-2030 ($ million)
Data Table on Germany - Market size and forecast 2025-2030 ($ million)
Chart on Germany - Year-over-year growth 2025-2030 (%)
Data Table on Germany - Year-over-year growth 2025-2030 (%)

12.4.2 UK - Market size and forecast 2025-2030

Chart on UK - Market size and forecast 2025-2030 ($ million)
Data Table on UK - Market size and forecast 2025-2030 ($ million)
Chart on UK - Year-over-year growth 2025-2030 (%)
Data Table on UK - Year-over-year growth 2025-2030 (%)

12.4.3 France - Market size and forecast 2025-2030

Chart on France - Market size and forecast 2025-2030 ($ million)
Data Table on France - Market size and forecast 2025-2030 ($ million)
Chart on France - Year-over-year growth 2025-2030 (%)
Data Table on France - Year-over-year growth 2025-2030 (%)

12.4.4 Italy - Market size and forecast 2025-2030

Chart on Italy - Market size and forecast 2025-2030 ($ million)
Data Table on Italy - Market size and forecast 2025-2030 ($ million)
Chart on Italy - Year-over-year growth 2025-2030 (%)
Data Table on Italy - Year-over-year growth 2025-2030 (%)

12.4.5 Spain - Market size and forecast 2025-2030

Chart on Spain - Market size and forecast 2025-2030 ($ million)
Data Table on Spain - Market size and forecast 2025-2030 ($ million)
Chart on Spain - Year-over-year growth 2025-2030 (%)
Data Table on Spain - Year-over-year growth 2025-2030 (%)

12.4.6 The Netherlands - Market size and forecast 2025-2030

Chart on The Netherlands - Market size and forecast 2025-2030 ($ million)
Data Table on The Netherlands - Market size and forecast 2025-2030 ($ million)
Chart on The Netherlands - Year-over-year growth 2025-2030 (%)
Data Table on The Netherlands - Year-over-year growth 2025-2030 (%)

12.5 APAC - Market size and forecast 2025-2030

Chart on APAC - Market size and forecast 2025-2030 ($ million)
Data Table on APAC - Market size and forecast 2025-2030 ($ million)
Chart on APAC - Year-over-year growth 2025-2030 (%)
Data Table on APAC - Year-over-year growth 2025-2030 (%)
Chart on Regional Comparison - APAC
Data Table on Regional Comparison - APAC

12.5.1 China - Market size and forecast 2025-2030

Chart on China - Market size and forecast 2025-2030 ($ million)
Data Table on China - Market size and forecast 2025-2030 ($ million)
Chart on China - Year-over-year growth 2025-2030 (%)
Data Table on China - Year-over-year growth 2025-2030 (%)

12.5.2 Japan - Market size and forecast 2025-2030

Chart on Japan - Market size and forecast 2025-2030 ($ million)
Data Table on Japan - Market size and forecast 2025-2030 ($ million)
Chart on Japan - Year-over-year growth 2025-2030 (%)
Data Table on Japan - Year-over-year growth 2025-2030 (%)

12.5.3 India - Market size and forecast 2025-2030

Chart on India - Market size and forecast 2025-2030 ($ million)
Data Table on India - Market size and forecast 2025-2030 ($ million)
Chart on India - Year-over-year growth 2025-2030 (%)
Data Table on India - Year-over-year growth 2025-2030 (%)

12.5.4 South Korea - Market size and forecast 2025-2030

Chart on South Korea - Market size and forecast 2025-2030 ($ million)
Data Table on South Korea - Market size and forecast 2025-2030 ($ million)
Chart on South Korea - Year-over-year growth 2025-2030 (%)
Data Table on South Korea - Year-over-year growth 2025-2030 (%)

12.5.5 Australia - Market size and forecast 2025-2030

Chart on Australia - Market size and forecast 2025-2030 ($ million)
Data Table on Australia - Market size and forecast 2025-2030 ($ million)
Chart on Australia - Year-over-year growth 2025-2030 (%)
Data Table on Australia - Year-over-year growth 2025-2030 (%)

12.5.6 Indonesia - Market size and forecast 2025-2030

Chart on Indonesia - Market size and forecast 2025-2030 ($ million)
Data Table on Indonesia - Market size and forecast 2025-2030 ($ million)
Chart on Indonesia - Year-over-year growth 2025-2030 (%)
Data Table on Indonesia - Year-over-year growth 2025-2030 (%)

12.6 Middle East and Africa - Market size and forecast 2025-2030

Chart on Middle East and Africa - Market size and forecast 2025-2030 ($ million)
Data Table on Middle East and Africa - Market size and forecast 2025-2030 ($ million)
Chart on Middle East and Africa - Year-over-year growth 2025-2030 (%)
Data Table on Middle East and Africa - Year-over-year growth 2025-2030 (%)
Chart on Regional Comparison - Middle East and Africa
Data Table on Regional Comparison - Middle East and Africa

12.6.1 UAE - Market size and forecast 2025-2030

Chart on UAE - Market size and forecast 2025-2030 ($ million)
Data Table on UAE - Market size and forecast 2025-2030 ($ million)
Chart on UAE - Year-over-year growth 2025-2030 (%)
Data Table on UAE - Year-over-year growth 2025-2030 (%)

12.6.2 Saudi Arabia - Market size and forecast 2025-2030

Chart on Saudi Arabia - Market size and forecast 2025-2030 ($ million)
Data Table on Saudi Arabia - Market size and forecast 2025-2030 ($ million)
Chart on Saudi Arabia - Year-over-year growth 2025-2030 (%)
Data Table on Saudi Arabia - Year-over-year growth 2025-2030 (%)

12.6.3 South Africa - Market size and forecast 2025-2030

Chart on South Africa - Market size and forecast 2025-2030 ($ million)
Data Table on South Africa - Market size and forecast 2025-2030 ($ million)
Chart on South Africa - Year-over-year growth 2025-2030 (%)
Data Table on South Africa - Year-over-year growth 2025-2030 (%)

12.6.4 Turkey - Market size and forecast 2025-2030

Chart on Turkey - Market size and forecast 2025-2030 ($ million)
Data Table on Turkey - Market size and forecast 2025-2030 ($ million)
Chart on Turkey - Year-over-year growth 2025-2030 (%)
Data Table on Turkey - Year-over-year growth 2025-2030 (%)

12.6.5 Israel - Market size and forecast 2025-2030

Chart on Israel - Market size and forecast 2025-2030 ($ million)
Data Table on Israel - Market size and forecast 2025-2030 ($ million)
Chart on Israel - Year-over-year growth 2025-2030 (%)
Data Table on Israel - Year-over-year growth 2025-2030 (%)

12.7 South America - Market size and forecast 2025-2030

Chart on South America - Market size and forecast 2025-2030 ($ million)
Data Table on South America - Market size and forecast 2025-2030 ($ million)
Chart on South America - Year-over-year growth 2025-2030 (%)
Data Table on South America - Year-over-year growth 2025-2030 (%)
Chart on Regional Comparison - South America
Data Table on Regional Comparison - South America

12.7.1 Brazil - Market size and forecast 2025-2030

Chart on Brazil - Market size and forecast 2025-2030 ($ million)
Data Table on Brazil - Market size and forecast 2025-2030 ($ million)
Chart on Brazil - Year-over-year growth 2025-2030 (%)
Data Table on Brazil - Year-over-year growth 2025-2030 (%)

12.7.2 Argentina - Market size and forecast 2025-2030

Chart on Argentina - Market size and forecast 2025-2030 ($ million)
Data Table on Argentina - Market size and forecast 2025-2030 ($ million)
Chart on Argentina - Year-over-year growth 2025-2030 (%)
Data Table on Argentina - Year-over-year growth 2025-2030 (%)

12.7.3 Chile - Market size and forecast 2025-2030

Chart on Chile - Market size and forecast 2025-2030 ($ million)
Data Table on Chile - Market size and forecast 2025-2030 ($ million)
Chart on Chile - Year-over-year growth 2025-2030 (%)
Data Table on Chile - Year-over-year growth 2025-2030 (%)

12.8 Market opportunity by geography

Market opportunity by geography ($ million)
Data Tables on Market opportunity by geography ($ million)

13. Drivers, Challenges, and Opportunity

13.1 Market drivers

Increasing consumer health consciousness levels
Expansion of e-commerce distribution channels
Urbanization and hectic lifestyle patterns

13.2 Market challenges

Supply chain and logistics constraints
Increasing production and energy costs
Stringent environmental and labeling regulations

13.3 Impact of drivers and challenges

Impact of drivers and challenges in 2025 and 2030

13.4 Market opportunities

Introduction of botanical infusions and exotic fruits
Expanding focus on sustainable and plastic free packaging
Increasing awareness for functional and wellness enhanced waters

14. Competitive Landscape

14.1 Overview

14.2

Overview on criticality of inputs and factors of differentiation

14.3 Landscape disruption

Overview on factors of disruption

14.4 Industry risks

Impact of key risks on business

15. Competitive Analysis

15.1 Companies profiled

Companies covered

15.2 Company ranking index

15.3 Market positioning of companies

Matrix on companies position and classification

15.4 Anheuser Busch InBev SA NV

Anheuser Busch InBev SA NV - Overview
Anheuser Busch InBev SA NV - Business segments
Anheuser Busch InBev SA NV - Key offerings
Anheuser Busch InBev SA NV - Segment focus
SWOT

15.5 Carpathian Springs SA

Carpathian Springs SA - Overview
Carpathian Springs SA - Product / Service
Carpathian Springs SA - Key offerings
SWOT

15.6 Danone SA

Danone SA - Overview
Danone SA - Business segments
Danone SA - Key news
Danone SA - Key offerings
Danone SA - Segment focus
SWOT

15.7 JAB Holding Co.

JAB Holding Co. - Overview
JAB Holding Co. - Product / Service
JAB Holding Co. - Key offerings
SWOT

15.8 Keurig Dr Pepper Inc.

Keurig Dr Pepper Inc. - Overview
Keurig Dr Pepper Inc. - Business segments
Keurig Dr Pepper Inc. - Key offerings
Keurig Dr Pepper Inc. - Segment focus
SWOT

15.9 Mountain Valley Spring Co.

Mountain Valley Spring Co. - Overview
Mountain Valley Spring Co. - Product / Service
Mountain Valley Spring Co. - Key offerings
SWOT

15.10 National Beverage Corp.

National Beverage Corp. - Overview
National Beverage Corp. - Product / Service
National Beverage Corp. - Key offerings
SWOT

15.11 Nestle SA

Nestle SA - Overview
Nestle SA - Business segments
Nestle SA - Key news
Nestle SA - Key offerings
Nestle SA - Segment focus
SWOT

15.12 PepsiCo Inc.

PepsiCo Inc. - Overview
PepsiCo Inc. - Business segments
PepsiCo Inc. - Key news
PepsiCo Inc. - Key offerings
PepsiCo Inc. - Segment focus
SWOT

15.13 Primo Water Corp.

Primo Water Corp. - Overview
Primo Water Corp. - Business segments
Primo Water Corp. - Key offerings
Primo Water Corp. - Segment focus
SWOT

15.14 Rhodius Mineralquellen Co. KG

Rhodius Mineralquellen Co. KG - Overview
Rhodius Mineralquellen Co. KG - Product / Service
Rhodius Mineralquellen Co. KG - Key offerings
SWOT

15.15 Talking Rain Beverage Co.

Talking Rain Beverage Co. - Overview
Talking Rain Beverage Co. - Product / Service
Talking Rain Beverage Co. - Key offerings
SWOT

15.16 The Coca Cola Co.

The Coca Cola Co. - Overview
The Coca Cola Co. - Business segments
The Coca Cola Co. - Key news
The Coca Cola Co. - Key offerings
The Coca Cola Co. - Segment focus
SWOT

15.17 Volay Water

Volay Water - Overview
Volay Water - Product / Service
Volay Water - Key offerings
SWOT

15.18 WakeWater Beverage Co.

WakeWater Beverage Co. - Overview
WakeWater Beverage Co. - Product / Service
WakeWater Beverage Co. - Key offerings
SWOT

16. Appendix

16.1 Scope of the report

Market definition
Objectives
Notes and caveats

16.2 Inclusions and exclusions checklist

Inclusions checklist
Exclusions checklist

16.3 Currency conversion rates for US$

16.4 Research methodology

16.5 Data procurement

Information sources

16.6 Data validation

16.7 Validation techniques employed for market sizing

16.8 Data synthesis

16.9 360 degree market analysis

16.10 List of abbreviations

Research Methodology

Technavio presents a detailed picture of the market by way of study, synthesis, and summation of data from multiple sources. The analysts have presented the various facets of the market with a particular focus on identifying the key industry influencers. The data thus presented is comprehensive, reliable, and the result of extensive research, both primary and secondary.

INFORMATION SOURCES

Primary sources

  • Manufacturers and suppliers
  • Channel partners
  • Industry experts
  • Strategic decision makers

Secondary sources

  • Industry journals and periodicals
  • Government data
  • Financial reports of key industry players
  • Historical data
  • Press releases

DATA ANALYSIS

Data Synthesis

  • Collation of data
  • Estimation of key figures
  • Analysis of derived insights

Data Validation

  • Triangulation with data models
  • Reference against proprietary databases
  • Corroboration with industry experts

REPORT WRITING

Qualitative

  • Market drivers
  • Market challenges
  • Market trends
  • Five forces analysis

Quantitative

  • Market size and forecast
  • Market segmentation
  • Geographical insights
  • Competitive landscape

Interested in this report?

Get your sample now to see our research methodology and insights!

Download Now

Frequently Asked Questions

Sparkling Water market growth will increase by USD 35150.7 million during 2026-2030.

The Sparkling Water market is expected to grow at a CAGR of 11.8% during 2026-2030.

Sparkling Water market is segmented by Distribution channel (Hypermarkets, On-trade and independent retailers, Convenience stores, Online) Product (Unflavored sparkling water, Flavored sparkling water) Packaging (Plastic bottles, Cans, Glass bottles)

Anheuser Busch InBev SA NV, Aqua Maestro Inc., Big Watt Beverage Co., Carpathian Springs SA, Danone SA, JAB Holding Co., Keurig Dr Pepper Inc., Klarbrunn Inc., Mountain Valley Spring Co., National Beverage Corp., Nestle SA, PepsiCo Inc., Polar Beverages, Primo Water Corp., Rhodius Mineralquellen Co. KG, Talking Rain Beverage Co., The Coca Cola Co., Volay Water, VOSS of Norway AS, WakeWater Beverage Co. are a few of the key vendors in the Sparkling Water market.

North America will register the highest growth rate of 43.1% among the other regions. Therefore, the Sparkling Water market in North America is expected to garner significant business opportunities for the vendors during the forecast period.

US, Canada, Mexico, Germany, UK, France, Italy, Spain, The Netherlands, China, Japan, India, South Korea, Australia, Indonesia, UAE, Saudi Arabia, South Africa, Turkey, Israel, Brazil, Argentina, Chile

  • Increasing consumer health consciousness levels is the driving factor this market.

The Sparkling Water market vendors should focus on grabbing business opportunities from the Distribution channel segment as it accounted for the largest market share in the base year.
RIA - Research AI Assistant
Ask RIA