Europe Sports Nutrition Market Size 2025-2029
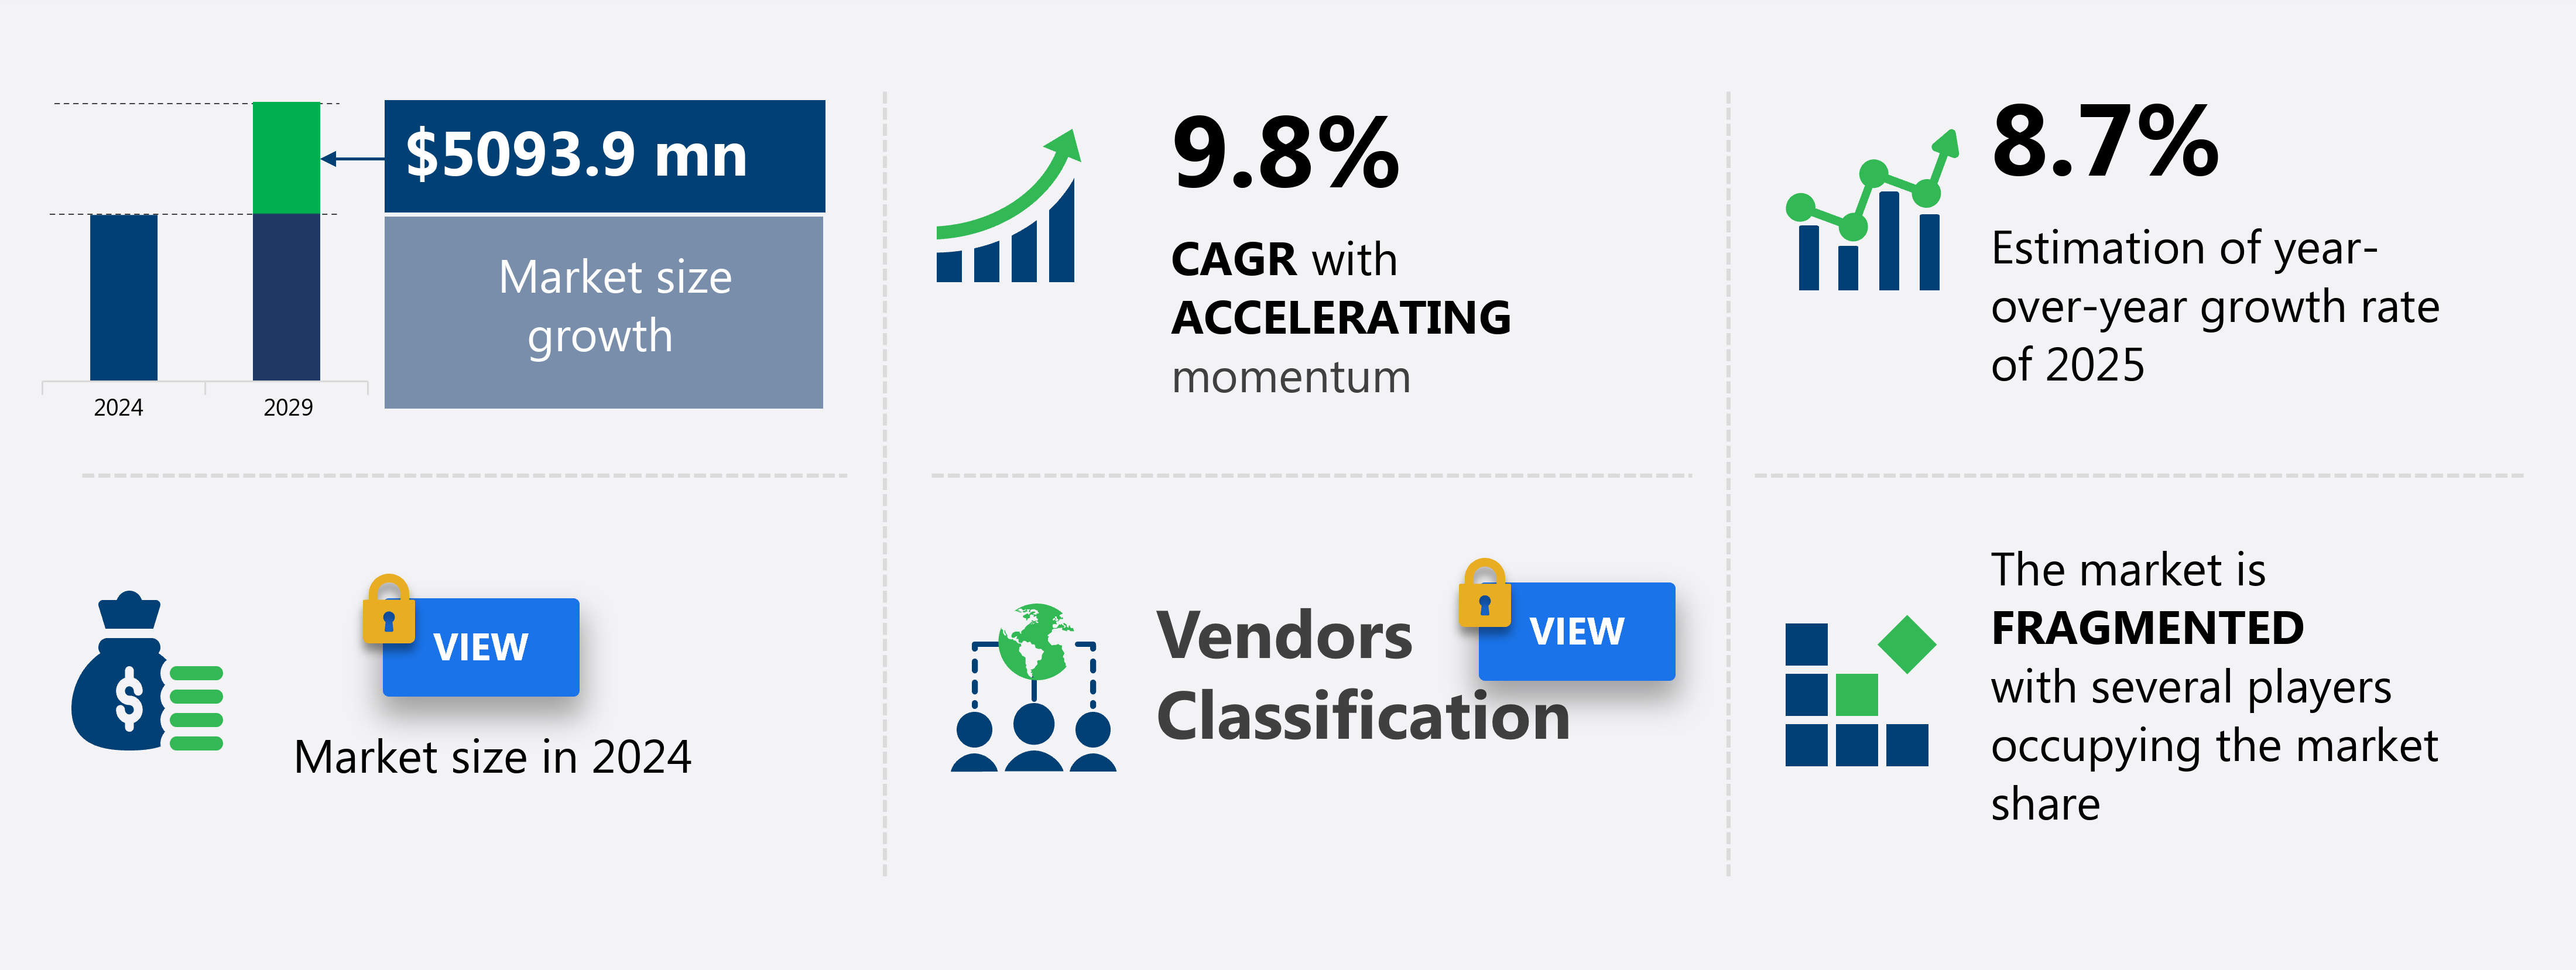
The Europe sports nutrition market size is forecast to increase by USD 5.09 billion at a CAGR of 9.8% between 2024 and 2029. The market is witnessing significant growth, driven by the rising fitness consciousness among consumers due to increasing lifestyle diseases. This trend is leading to a heightened demand for effective nutrition products that cater to various health and performance goals.
Market Size & Forecast
- Market Opportunities: USD 59.88 Billion
- Future Opportunities: USD 5.09 Billion
- CAGR (2024-2029): 9.8%
Advancements in sports nutrition technology are resulting in the development of innovative, science-backed products that offer enhanced health and wellness benefits to consumers. However, the market faces a substantial challenge from the proliferation of counterfeit sports nutrition products. These illegitimate offerings not only undermine the reputation of genuine brands but also pose a potential health risk to consumers due to their subpar quality and ineffective ingredients.
Companies must invest in robust anti-counterfeit measures and collaborate with regulatory bodies to safeguard consumer safety and maintain market integrity. By addressing these challenges and capitalizing on the growing demand for high-quality sports nutrition solutions, market participants can effectively position themselves for long-term success in the dynamic European market.
What will be the size of the Europe Sports Nutrition Market during the forecast period?
Explore in-depth regional segment analysis with market size data - historical 2019-2023 and forecasts 2025-2029 - in the full report.
Request Free Sample
- The European sports nutrition market continues to evolve, driven by consumer demand for products that enhance physical performance and promote overall health. Dosage guidelines for various nutrients, such as protein and creatine, are subject to ongoing research and refinement, influencing product development and labeling. Lactate threshold and optimal hydration are key areas of focus, with improved cognitive function and enhanced immune function also gaining traction. Safety standards and quality control measures are paramount in this market, ensuring the bioavailability and efficacy of ingredients. Retail sales are expected to grow by 5% annually, with distribution channels expanding to include online platforms and specialized stores.
- Product innovation is a significant factor, with companies exploring supplement interaction, ingredient combinations, and delivery systems to enhance mental performance and muscle strength gains. For instance, a recent study showed a 20% increase in power output and a 15% reduction in muscle soreness after supplementing with a specific amino acid blend. Consumer insights and personalized nutrition plans are increasingly important, leading to customized product offerings and improved recovery time. Endurance enhancement, increased bone density, reduced inflammation, joint health, stress management, and VO2 max improvement are other key applications.
How is this market segmented?
The market research report provides comprehensive data (region-wise segment analysis), with forecasts and estimates in "USD billion" for the period 2025-2029, as well as historical data from 2019-2023 for the following segments.
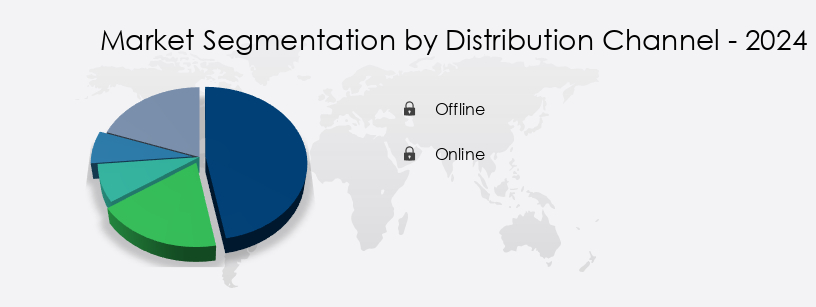
- Distribution Channel
- Offline
- Online
- Product
- Non-protein sports nutrition
- Protein powder
- Protein RTD
- Protein bar
- Type
- Pre-workout
- Energy boost
- Weight management
- Others
- Flavor
- Artificial
- Natural
- Product Type
- Sports drinks
- Sports food
- Sports supplements
- End-User
- Athletes
- Bodybuilders
- Recreational Users
- Lifestyle Users
- Geography
- Europe
- France
- Germany
- Spain
- UK
- Europe
By Distribution Channel Insights
The offline segment is estimated to witness significant growth during the forecast period.
In Europe, the sports nutrition market encompasses various product categories, including ergogenic aids, antioxidant supplementation, sports nutrition formulations, probiotic benefits, protein synthesis, and bone health supplements. These supplements cater to athletes and fitness enthusiasts seeking improved performance, recovery, and overall wellness. The European market adheres to stringent dietary supplement regulations, ensuring the safety and efficacy of these products. Protein supplements, such as whey protein isolate and casein, are popular choices due to their role in muscle hypertrophy and amino acid profile. Performance enhancing supplements, like creatine and beta-alanine, have gained traction for their benefits in body composition changes and muscle endurance.
Carbohydrate metabolism supplements aid in glycogen replenishment, while energy drinks provide quick energy through caffeine and sugar. The market for digestive health supplements, including probiotics and prebiotic fiber, has seen significant growth due to their role in gut microbiome influence and insulin sensitivity. Mineral absorption supplements, like calcium and magnesium, are essential for bone health, while omega-3 fatty acids and vitamin D supplementation contribute to hormone regulation and overall health. According to recent research, the European sports nutrition market is projected to grow by over 10% in the next few years, driven by consumer awareness, increasing health consciousness, and the availability of a wide range of products.
Supermarkets and hypermarkets have emerged as the most popular offline distribution channels, accounting for over 60% of sales due to their convenience, wide product selection, and competitive pricing.
The Offline segment was valued at USD billion in 2019 and showed a gradual increase during the forecast period.
Market Dynamics
Our researchers analyzed the data with 2024 as the base year, along with the key drivers, trends, and challenges. A holistic analysis of drivers will help companies refine their marketing strategies to gain a competitive advantage.
The European sports nutrition market is experiencing significant growth due to increasing awareness of the role of proper nutrition in enhancing athletic performance and promoting overall health among athletes. Key products driving this market include creatine, which has been shown to boost muscle power, and whey protein, effective in facilitating muscle growth. Beta-alanine supplementation is another popular choice, known to improve performance by reducing muscle fatigue. Branched-chain amino acids (BCAAs) play a crucial role in muscle protein synthesis, ensuring optimal muscle recovery. Carbohydrate intake is essential for endurance athletes, providing the necessary energy for prolonged physical activity. Caffeine, a widely used performance enhancer, can improve alertness and focus during workouts.
Electrolyte supplementation and hydration are vital for maintaining optimal body function, while antioxidants aid in exercise recovery by reducing oxidative stress. Probiotics and gut health are gaining attention in sports nutrition, as a healthy gut contributes to better nutrient absorption and overall wellbeing. Collagen peptides are another emerging trend, offering benefits for joint health improvement. Vitamin D, essential for bone health, and omega-3 fatty acids, known for their anti-inflammatory properties, are also popular choices among athletes. Product development in sports nutrition is focused on natural ingredients, consumer preference, and regulatory compliance. Nutrient timing strategies for muscle recovery and personalized sports nutrition plans are becoming increasingly important, with an emphasis on sustainable ingredients to cater to the evolving needs of European athletes. Sleep and stress management also play significant roles in athletic performance, making them crucial aspects of a comprehensive sports nutrition approach.
What are the Europe Sports Nutrition Market drivers leading to the rise in adoption of the Industry?
- The increasing consciousness regarding fitness, primarily driven by lifestyle conditions, serves as the primary market catalyst.
- The European sports nutrition market is experiencing significant growth due to the increasing health consciousness and participation in fitness activities. With the rise of lifestyle-related disorders like obesity, consumers are increasingly engaged in fitness regimes and sports participation as part of a healthy lifestyle. This trend is reflected in the proliferation of gyms and health clubs across Europe. The demand for energy boosters and performance enhancers is escalating to help individuals optimize their workouts and achieve desired results. According to market research, the European sports nutrition market is projected to grow by over 7% annually, underscoring its robust potential for businesses.
- For instance, sales of energy bars in Europe have increased by 15% in the past year, demonstrating the market's expanding consumer base and demand for performance-enhancing products.
What are the Europe Sports Nutrition Market trends shaping the Industry?
- Advances in sports nutrition products represent the current market trend. The development of innovative and effective nutritional solutions for athletes and fitness enthusiasts continues to gain momentum.
- The European sports nutrition market is experiencing significant growth, driven by increasing consumer awareness of health and wellness. Companies are investing heavily in research and development to introduce innovative products with improved health benefits. For instance, the use of microencapsulated seaweeds is gaining popularity due to their less aromatic nature and ability to replace salt, enhance flavor, and provide essential minerals like iodine. Another emerging trend is the fortification of food ingredients, such as vitamin D, probiotics, and glycerol, to cater to the evolving consumer demands. The market is expected to witness a robust expansion, with an estimated 15% of the European population projected to adopt sports nutrition products by 2025.
- This growth can be attributed to the rising prevalence of sedentary lifestyles, increasing participation in sports and fitness activities, and the growing awareness of the importance of maintaining optimal health.
How does Europe Sports Nutrition Market face challenges during its growth?
- The counterfeit product threat poses a significant challenge to the industry's growth, requiring vigilant measures to ensure authenticity and maintain consumer trust.
- The European sports nutrition market faces a significant challenge from counterfeit products, which pose a threat to both consumer safety and brand reputation. With a fragmented regulatory landscape, it is difficult to effectively monitor and control counterfeiting activities. These illicit products often bear false labeling and misrepresentations of legitimate brands, potentially leading to false claims and consumer dissatisfaction. The proliferation of counterfeit sports nutrition goods is a growing concern for industry players worldwide, as increasing demand fuels off-market production. According to a recent study, the European sports nutrition market is projected to grow by over 10% in the next five years.
- However, the presence of counterfeit products could hinder this growth trajectory and undermine the trust of consumers in the market. For instance, a report revealed that up to 15% of sports nutrition products sold online in Europe were found to be counterfeit. Companies must prioritize measures to combat counterfeiting, such as implementing robust supply chain controls and collaborating with regulatory authorities to ensure market integrity.
Exclusive Europe Sports Nutrition Market Customer Landscape
The market forecasting report includes the adoption lifecycle of the market, covering from the innovator's stage to the laggard's stage. It focuses on adoption rates in different regions based on penetration. Furthermore, the report also includes key purchase criteria and drivers of price sensitivity to help companies evaluate and develop their market growth analysis strategies.
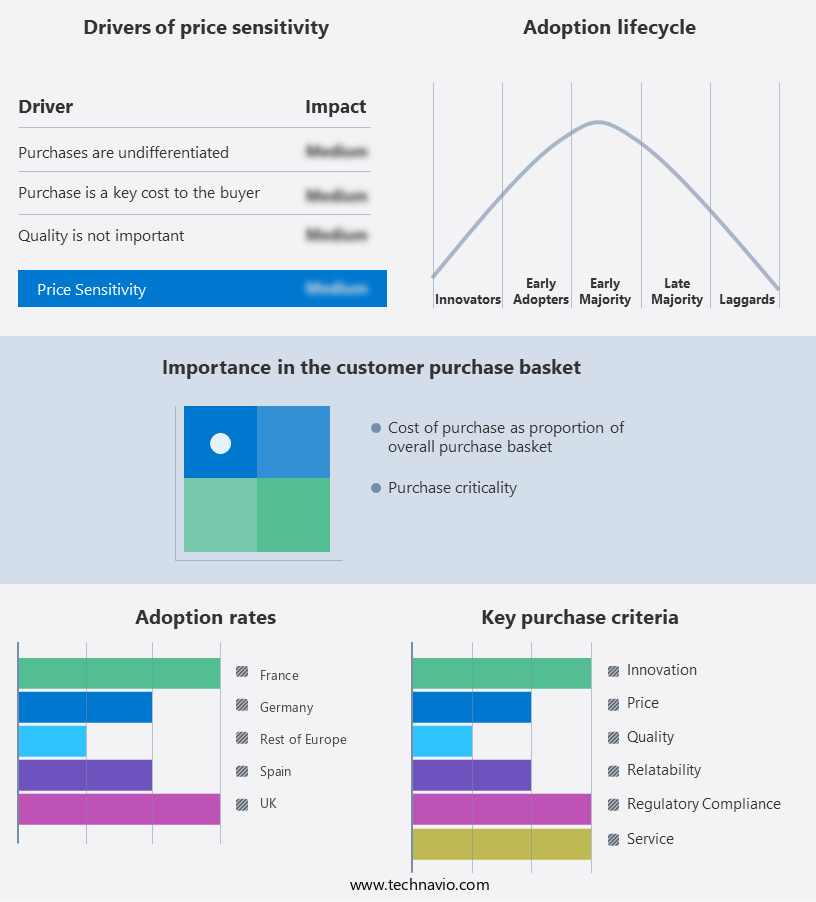
Customer Landscape
Key Companies & Market Insights
Companies are implementing various strategies, such as strategic alliances, market forecast partnerships, mergers and acquisitions, geographical expansion, and product/service launches, to enhance their presence in the market.
The market research and growth report includes detailed analyses of the competitive landscape of the market and information about key companies, including:
- Abbott Laboratories
- Ajinomoto Co. Inc.
- BellRing Brands Inc.
- Glanbia plc
- Grenade UK Ltd.
- Hormel Foods Corp.
- Iovate Health Sciences International Inc.
- Kruger GmbH and Co. KG
- Lonza Group Ltd.
- Mondelez International Inc.
- MusclePharm
- Nestle SA
- NUTREND D. S., a. s
- OTE Sports Ltd.
- PepsiCo Inc.
- Post Holdings Inc.
- TORQ Ltd.
- Tripoint GmbH
- Ultimate Nutrition Inc.
- Universal Nutrition
Qualitative and quantitative analysis of companies has been conducted to help clients understand the wider business environment as well as the strengths and weaknesses of key market players. Data is qualitatively analyzed to categorize companies as pure play, category-focused, industry-focused, and diversified; it is quantitatively analyzed to categorize companies as dominant, leading, strong, tentative, and weak.
Recent Development and News in Sports Nutrition Market In Europe
- In January 2024, German sports nutrition company, Myprotein, announced the launch of its plant-based protein range, expanding its product portfolio to cater to the growing demand for vegan and vegetarian alternatives (Myprotein Press Release).
- In March 2024, Danone and PepsiCo, two industry giants, entered into a strategic partnership to combine their respective nutrition and wellness businesses, creating a new entity valued at €12 billion (Bloomberg).
- In April 2025, Swedish food company, Oatly, raised €1.1 billion in a funding round led by BlackRock, further solidifying its position as a major player in the plant-based beverage market (Reuters).
- In May 2025, the European Commission approved the use of certain plant-based proteins, such as pea and rice proteins, in infant formula, marking a significant regulatory shift in the sports nutrition industry (European Commission Press Release).
Research Analyst Overview
The European sports nutrition market continues to evolve, driven by advancements in nutritional science and consumer demand for optimized performance and overall health. Ergogenic aids, such as antioxidant supplementation and sports nutrition formulations, are increasingly popular, with studies continually assessing their efficacy in enhancing athletic performance and recovery. Probiotic benefits, for instance, have been shown to improve gut health and enhance immune function, while protein synthesis plays a crucial role in muscle hypertrophy and bone health supplements support longevity. Energy drinks, featuring carbohydrate metabolism boosters and electrolyte balance enhancers, remain a significant market segment. For example, sales of energy drinks in Europe have grown by 11% in the past year, reaching a market size of €12.5 billion.
Protein supplements, including whey protein isolate and casein protein, are another essential component of sports nutrition, with their amino acid profiles playing a key role in muscle recovery and growth. Dietary supplement regulations ensure consumer safety, while nutritional timing strategies and weight management strategies cater to diverse consumer needs. Performance enhancing supplements, such as creatine and beta-alanine, continue to gain popularity, with benefits extending to insulin sensitivity, hormone regulation, and body composition changes. Collagen peptides, rich in mineral absorption and fat oxidation, contribute to joint health and overall well-being. Omega-3 fatty acids and vitamin D supplementation support heart health and immune function, while prebiotic fiber and probiotics influence the gut microbiome for optimal digestive health.
The European sports nutrition market is poised for continued growth, with industry expectations projecting a 6% annual expansion in the coming years. The ongoing unfolding of market activities and evolving patterns underscore the importance of staying informed and adapting to the ever-changing landscape.
Dive into Technavio's robust research methodology, blending expert interviews, extensive data synthesis, and validated models for unparalleled Sports Nutrition Market in Europe insights. See full methodology.
|
Market Scope |
|
|
Report Coverage |
Details |
|
Page number |
240 |
|
Base year |
2024 |
|
Historic period |
2019-2023 |
|
Forecast period |
2025-2029 |
|
Growth momentum & CAGR |
Accelerate at a CAGR of 9.8% |
|
Market growth 2025-2029 |
USD 5.09 billion |
|
Market structure |
Fragmented |
|
YoY growth 2024-2025(%) |
8.7 |
|
Competitive landscape |
Leading Companies, Market Positioning of Companies, Competitive Strategies, and Industry Risks |
What are the Key Data Covered in this Market Research Report?
- CAGR of the market during the forecast period
- Detailed information on factors that will drive the market growth and forecasting between 2025 and 2029
- Precise estimation of the size of the market and its contribution of the market in focus to the parent market
- Accurate predictions about upcoming market growth and trends and changes in consumer behaviour
- Growth of the market across Europe
- Thorough analysis of the market's competitive landscape and detailed information about companies
- Comprehensive analysis of factors that will challenge the growth of market companies
We can help! Our analysts can customize this market research report to meet your requirements Get in touch
 RIA -
RIA - 
