
Sports Sponsorship Market Size 2026-2030
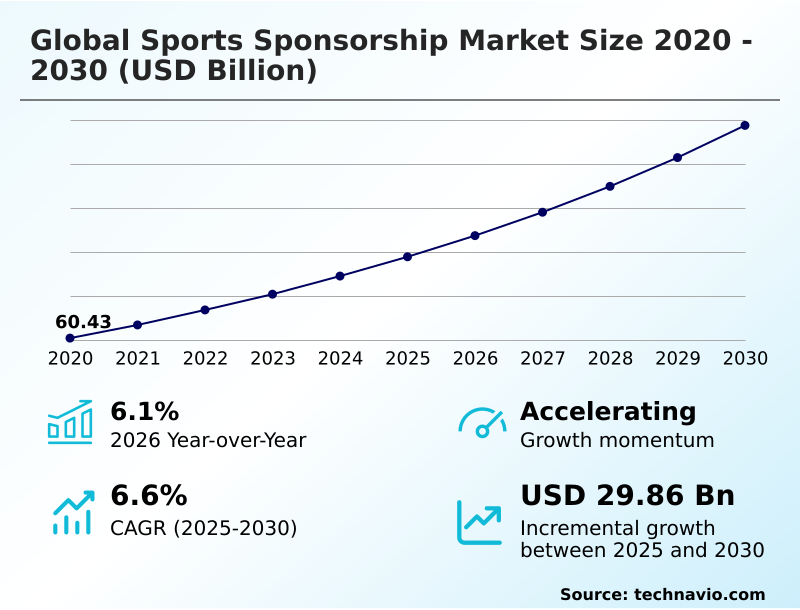
The sports sponsorship market size is valued to increase by USD 29.86 billion, at a CAGR of 6.6% from 2025 to 2030. Inclusion of programmatic digital and over-the-top streaming integration will drive the sports sponsorship market.
Major Market Trends & Insights
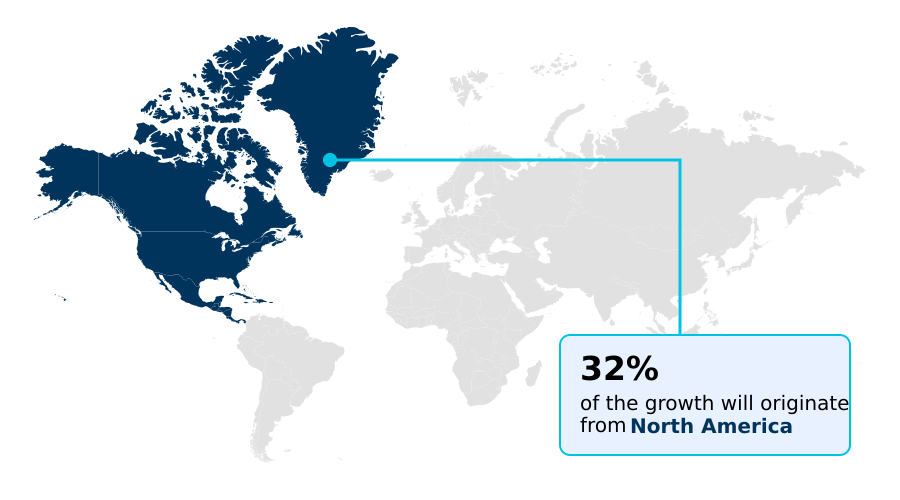
- North America dominated the market and accounted for a 31.8% growth during the forecast period.
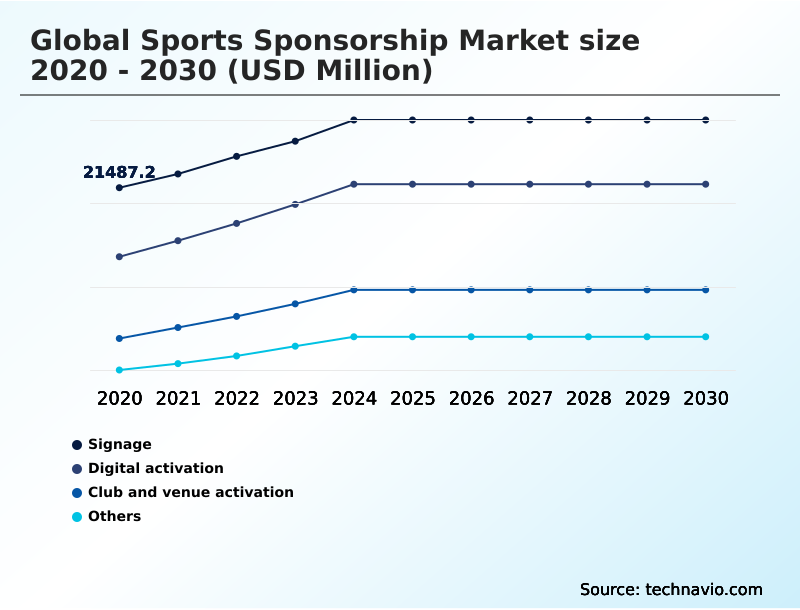
- By Type - Signage segment was valued at USD 25.78 billion in 2024
- By Application - Competition sponsorship segment accounted for the largest market revenue share in 2024
Market Size & Forecast
- Market Opportunities: USD 48.34 billion
- Market Future Opportunities: USD 29.86 billion
- CAGR from 2025 to 2030 : 6.6%
Market Summary
- The Sports Sponsorship Market is undergoing a significant transformation, moving from passive brand exposure to data-driven partnerships that prioritize direct fan engagement and measurable outcomes. This evolution is fueled by the integration of advanced technologies like AI and data analytics, enabling brands to execute hyper-personalized marketing campaigns.
- The proliferation of digital streaming platforms has opened new avenues for dynamic ad insertion and interactive content, allowing sponsors to connect with audiences in real-time. A key trend is the increasing valuation of women's professional sports, which offer unique opportunities to engage with affluent and socially conscious consumer segments.
- For instance, a consumer goods brand might leverage a sponsorship with a women's soccer league, using real-time social media sentiment analysis to tailor digital promotions, thereby linking brand visibility directly to e-commerce performance. However, the market faces challenges related to the complexity of measuring ROI across fragmented media channels and navigating evolving regulatory landscapes, particularly concerning gambling and cryptocurrency sponsorships.
- The emphasis is now on creating authentic, purpose-led partnerships that align with ESG principles, reflecting a broader shift toward building brand value through shared social and environmental goals rather than just commercial association.
What will be the Size of the Sports Sponsorship Market during the forecast period?
Get Key Insights on Market Forecast (PDF) Get Free Sample
How is the Sports Sponsorship Market Segmented?
The sports sponsorship industry research report provides comprehensive data (region-wise segment analysis), with forecasts and estimates in "USD million" for the period 2026-2030, as well as historical data from 2020-2024 for the following segments.
- Type
- Signage
- Digital activation
- Club and venue activation
- Others
- Application
- Competition sponsorship
- Training sponsorship
- Service type
- Official partnership
- Jersey and kit sponsorship
- Title sponsorship
- Naming rights
- Presenting sponsorship
- Geography
- North America
- US
- Canada
- Mexico
- Europe
- UK
- Germany
- France
- APAC
- China
- India
- Japan
- South America
- Brazil
- Argentina
- Middle East and Africa
- Saudi Arabia
- UAE
- South Africa
- Rest of World (ROW)
- North America
By Type Insights
The signage segment is estimated to witness significant growth during the forecast period.
The signage segment is undergoing a significant transformation, moving beyond static displays to dynamic, high-definition systems. This evolution incorporates programmatic digital advertising and digitally overlayed ads, enabling geotargeted sponsorship messages tailored for different global markets.
The use of real-time broadcast analytics and AI-driven adjustments, which react to game intensity, is becoming standard. These advanced sponsorship activation methods, which can improve brand recall by over 15%, are redefining asset valuation.
Moreover, the focus is shifting toward sustainable materials for physical installations to meet corporate responsibility goals.
The efficacy of these sponsorship portfolio management strategies is now measured through advanced computer vision, which calculates the precise duration and clarity of brand exposure, ensuring a higher return-on-investment measurement in sports marketing campaigns.
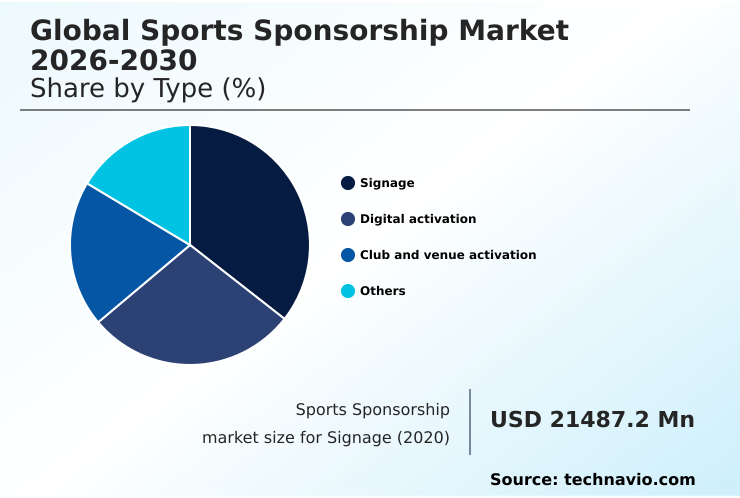
The Signage segment was valued at USD 25.78 billion in 2024 and showed a gradual increase during the forecast period.
Regional Analysis
North America is estimated to contribute 31.8% to the growth of the global market during the forecast period.Technavio’s analysts have elaborately explained the regional trends and drivers that shape the market during the forecast period.
See How Sports Sponsorship Market Demand is Rising in North America Get Free Sample
The global landscape is led by North America, which accounts for over 31% of the market's incremental growth, driven by a shift toward data-centric, experiential partnerships. In this region, geotargeted sponsorship activations have enhanced campaign efficiency by more than 20%.
Meanwhile, the APAC region is the fastest-growing market, fueled by expanding cricket leagues and massive digital media consumption. Europe distinguishes itself with a focus on purpose-led sustainability and deep technical collaborations.
Across all regions, the industrialization of women's sports and the rise of esports are creating new high-value inventory.
The integration of official partnership agreements with digital content integration is becoming a global standard, demanding sophisticated sponsorship valuation models and brand safety protocols to ensure success.
Market Dynamics
Our researchers analyzed the data with 2025 as the base year, along with the key drivers, trends, and challenges. A holistic analysis of drivers will help companies refine their marketing strategies to gain a competitive advantage.
- A comprehensive analysis of the sports sponsorship market requires a multi-faceted approach. Examining the Global Sports Sponsorship Market 2026-2030 by application shows a clear distinction between competition and training sponsorships, with the former commanding higher values. A breakdown of the Global Sports Sponsorship Market 2026-2030 by type highlights the rapid growth of digital activation relative to traditional signage.
- Similarly, an evaluation of the Global Sports Sponsorship Market 2026-2030 by service type reveals the premium placed on jersey and title sponsorships over other forms. Geographically, the Global Sports Sponsorship Market 2026-2030 by geography is led by North America, but APAC shows the most dynamic growth.
- Strategically, understanding technology's role in fan engagement is crucial for maximizing ROI in sports sponsorship. Stakeholders are focused on measuring digital activation in sports, as platforms leveraging athlete influencers for brands see engagement rates more than double those of legacy media. The future of esports sponsorship models and the valuation of women's sports sponsorship assets represent significant growth frontiers.
- Navigating sports betting sponsorship regulations and understanding the impact of OTT streaming on sponsorship are critical for risk management. Finally, implementing best practices for venue naming rights and understanding the legal frameworks for NIL deals are essential for long-term success.
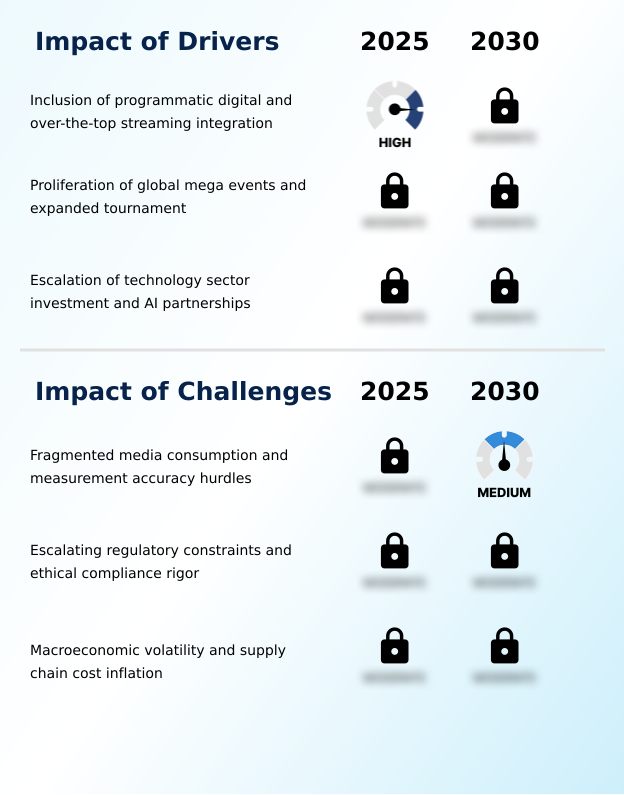
What are the key market drivers leading to the rise in the adoption of Sports Sponsorship Industry?
- The market's expansion is significantly propelled by the widespread integration of programmatic digital advertising and over-the-top streaming services within athletic broadcasting.
- Growth is primarily fueled by the proliferation of global mega-events and the rapid escalation of investment from the technology sector.
- The expansion of tournament formats provides sponsors with larger volumes of high-value inventory, while high-value hospitality packages and experiential marketing opportunities are on the rise.
- Technology firms are now key players, focusing on deep technical integration centered on AI and cloud infrastructure. This shift has led to a 15% annual increase in investment from AI and enterprise software providers in premium series.
- Furthermore, the institutionalization of programmatic digital and over-the-top streaming integration allows for hyper-targeted activations.
- This digital-first approach offers granular viewership data analytics and precise return-on-investment measurement, attracting a new wave of tech-native sponsors who demand quantifiable results from their sports league partnerships.
What are the market trends shaping the Sports Sponsorship Industry?
- A primary market trend is the industrialization of agentic AI fan engagement. This shift involves using autonomous digital agents to create hyper-personalized interactions with sports fans.
- The market is increasingly shaped by the industrialization of women's sports and a transition toward purpose-led sustainability. The valuation framework for women's sports is undergoing a fundamental reset, with commercial revenues growing at double-digit rates, significantly outperforming other segments in brand loyalty metrics.
- Simultaneously, corporate sponsors are demanding tangible commitments to environmental, social, and governance (ESG) standards, with green clauses in contracts becoming more common. This move toward circular sponsorships, where partners collaborate on mutual sustainability goals, has been shown to improve brand perception among socially conscious consumers by over 15%.
- These trends, including community sports sponsorship and title sponsorship deals, underscore a market shifting from passive association to active, value-driven partnerships.
What challenges does the Sports Sponsorship Industry face during its growth?
- A key challenge restraining industry growth is the fragmentation of media consumption, which complicates efforts to accurately measure sponsorship return on investment.
- The market faces significant hurdles from fragmented media consumption and escalating regulatory constraints. The migration of audiences to decentralized streaming and social platforms complicates accurate return-on-investment measurements, with sponsorship audit expenditures increasing by over 15% as firms struggle to reconcile disparate metrics. This lack of a unified cross-platform measurement standard challenges sponsorship ROI models.
- Simultaneously, tightening regulations on specific sponsorship categories, such as gambling and unhealthy foods, require rights holders to find ethically compliant partnerships in a competitive environment. These issues, coupled with macroeconomic volatility, create a complex landscape for sponsorship risk management, demanding more sophisticated and adaptable sponsorship negotiation tactics and digital activation strategies.
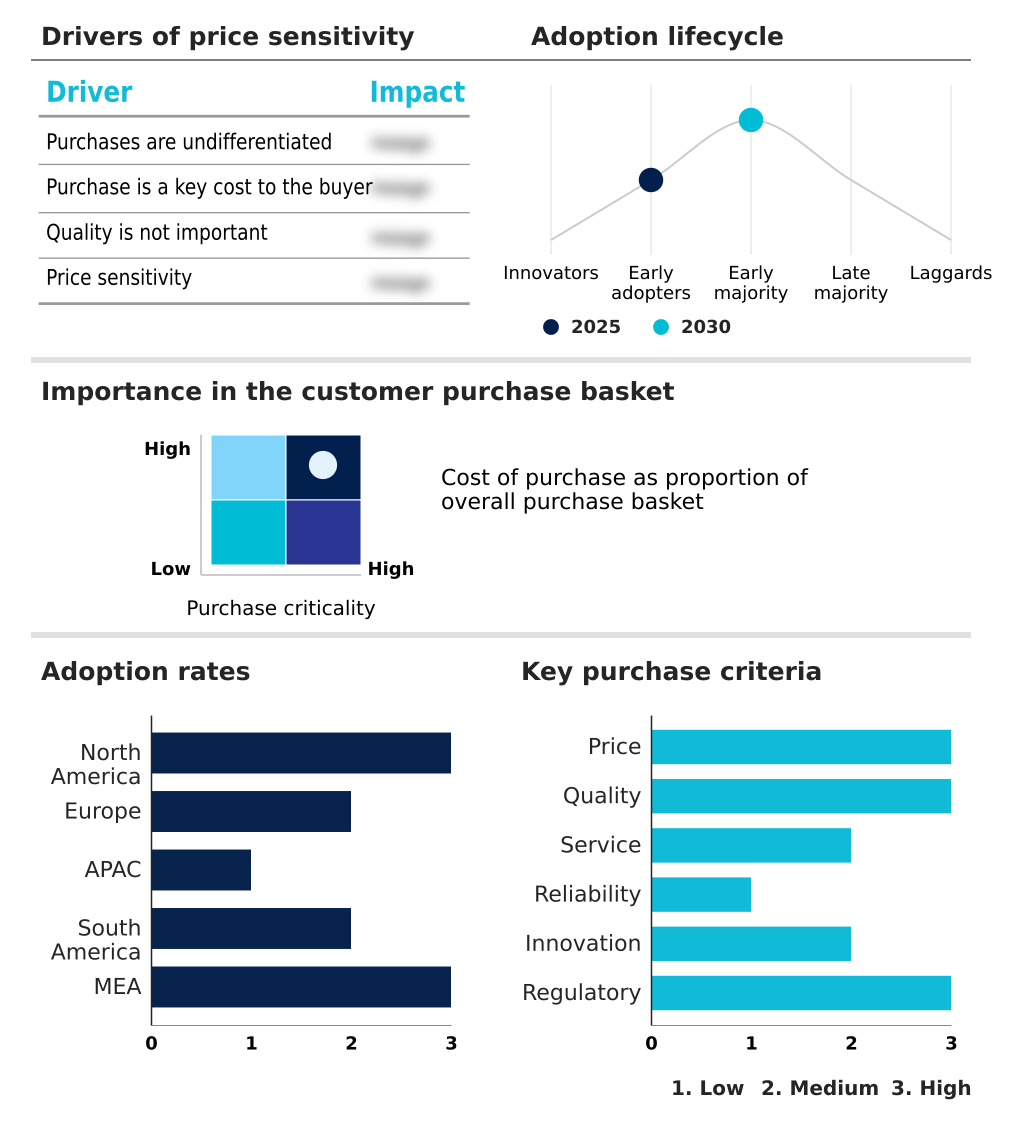
Exclusive Technavio Analysis on Customer Landscape
The sports sponsorship market forecasting report includes the adoption lifecycle of the market, covering from the innovator’s stage to the laggard’s stage. It focuses on adoption rates in different regions based on penetration. Furthermore, the sports sponsorship market report also includes key purchase criteria and drivers of price sensitivity to help companies evaluate and develop their market growth analysis strategies.
Customer Landscape of Sports Sponsorship Industry
Competitive Landscape
Companies are implementing various strategies, such as strategic alliances, sports sponsorship market forecast, partnerships, mergers and acquisitions, geographical expansion, and product/service launches, to enhance their presence in the industry.
Adidas AG - Offerings are centered on high-value football club sponsorships and strategic athlete endorsement programs designed to maximize brand equity and global market presence.
The industry research and growth report includes detailed analyses of the competitive landscape of the market and information about key companies, including:
- Adidas AG
- Anheuser Busch InBev SA NV
- DICKS Sporting Goods Inc.
- Electronic Arts Inc.
- Etihad Airways PJSC
- Go Sponsorship Ltd.
- Hero MotoCorp Ltd.
- Hugo Boss AG
- Chiliz Ltd.
- Hyundai Motor Co.
- MACRON SPA
- Nike Inc.
- PUMA SE
- Qatar Airways Group Q.C.S.C.
- Red Bull GmbH
- Renault SAS
- Rolex SA
- Samsung Electronics Co. Ltd.
- SGHC Limited
- The Coca Cola Co.
Qualitative and quantitative analysis of companies has been conducted to help clients understand the wider business environment as well as the strengths and weaknesses of key industry players. Data is qualitatively analyzed to categorize companies as pure play, category-focused, industry-focused, and diversified; it is quantitatively analyzed to categorize companies as dominant, leading, strong, tentative, and weak.
Recent Development and News in Sports sponsorship market
- In March, 2026, The Coca-Cola Co. announced a multiyear global partnership designating Sprite as the Official Global Soft Drink Partner for the National Basketball Association, WNBA, and NBA G League, focusing on co-creating new fan experiences.
- In January, 2026, Visa Inc. became a global sponsor for the inaugural FIFA Women's Champions Cup, presenting the Player of the Match and Player of the Tournament awards to enhance visibility in women's club football.
- In December, 2025, Toyota Motor Corp. secured a title sponsorship upgrade with the Haas F1 Team for the 2026 season, facilitating a technical collaboration focused on human capital development and advanced simulation infrastructure.
- In November, 2025, Globant expanded its agreement with FIFA to serve as a Tournament Supporter for the 2026 and 2027 World Cup events, specifically focusing on enhancing digital fan platforms and mobile applications.
Dive into Technavio’s robust research methodology, blending expert interviews, extensive data synthesis, and validated models for unparalleled Sports Sponsorship Market insights. See full methodology.
| Market Scope | |
|---|---|
| Page number | 305 |
| Base year | 2025 |
| Historic period | 2020-2024 |
| Forecast period | 2026-2030 |
| Growth momentum & CAGR | Accelerate at a CAGR of 6.6% |
| Market growth 2026-2030 | USD 29861.6 million |
| Market structure | Fragmented |
| YoY growth 2025-2026(%) | 6.1% |
| Key countries | US, Canada, Mexico, UK, Germany, France, Italy, Spain, The Netherlands, China, India, Japan, South Korea, Australia, Indonesia, Brazil, Argentina, Chile, Saudi Arabia, UAE, South Africa, Turkey and Israel |
| Competitive landscape | Leading Companies, Market Positioning of Companies, Competitive Strategies, and Industry Risks |
Research Analyst Overview
- The sports sponsorship market is evolving into a complex ecosystem where value is measured by deep fan engagement rather than simple visibility. The industrialization of agentic AI fan engagement is central to this shift, allowing for hyper-personalized fan engagement through autonomous digital agents. This requires advanced viewership data analytics and robust return-on-investment measurement frameworks.
- A key trend influencing boardroom decisions is the integration of purpose-led sustainability and circular sponsorships into partnership agreements. Organizations that align with strong ESG standards through ethically compliant partnerships and transparent community outreach targets have demonstrated a 20% lower risk of negative public sentiment. This focus on brand safety protocols is critical.
- The market is also defined by technological integration, including over-the-top streaming integration, programmatic digital advertising, and blockchain-based sports engagement. Success depends on sophisticated sponsorship portfolio management, leveraging tools like predictive fan analytics, gamified activations, and immersive augmented reality to create compelling, multi-platform campaigns with clear digital content integration and fan engagement metrics.
What are the Key Data Covered in this Sports Sponsorship Market Research and Growth Report?
-
What is the expected growth of the Sports Sponsorship Market between 2026 and 2030?
-
USD 29.86 billion, at a CAGR of 6.6%
-
-
What segmentation does the market report cover?
-
The report is segmented by Type (Signage, Digital activation, Club and venue activation, and Others), Application (Competition sponsorship, and Training sponsorship), Service Type (Official partnership, Jersey and kit sponsorship, Title sponsorship, Naming rights, and Presenting sponsorship) and Geography (North America, Europe, APAC, South America, Middle East and Africa)
-
-
Which regions are analyzed in the report?
-
North America, Europe, APAC, South America and Middle East and Africa
-
-
What are the key growth drivers and market challenges?
-
Inclusion of programmatic digital and over-the-top streaming integration, Fragmented media consumption and measurement accuracy hurdles
-
-
Who are the major players in the Sports Sponsorship Market?
-
Adidas AG, Anheuser Busch InBev SA NV, DICKS Sporting Goods Inc., Electronic Arts Inc., Etihad Airways PJSC, Go Sponsorship Ltd., Hero MotoCorp Ltd., Hugo Boss AG, Chiliz Ltd., Hyundai Motor Co., MACRON SPA, Nike Inc., PUMA SE, Qatar Airways Group Q.C.S.C., Red Bull GmbH, Renault SAS, Rolex SA, Samsung Electronics Co. Ltd., SGHC Limited and The Coca Cola Co.
-
Market Research Insights
- The market's dynamic nature is defined by a strategic shift from passive brand visibility to interactive, data-driven partnerships. Digital activation strategies now generate up to 35% higher fan engagement rates than traditional static advertising. The emphasis on high-value hospitality packages and measurable fan engagement platforms is reshaping sponsorship ROI models.
- These models, when incorporating social impact sponsorship metrics, show a 15% improvement in overall brand sentiment. As sports property monetization becomes more sophisticated through in-kind sponsorship agreements and detailed brand association metrics, the focus remains on leveraging sports league partnerships and managing sponsorship risk effectively.
We can help! Our analysts can customize this sports sponsorship market research report to meet your requirements.
 RIA -
RIA - 
