
Sports Trading Card Market Size 2026-2030
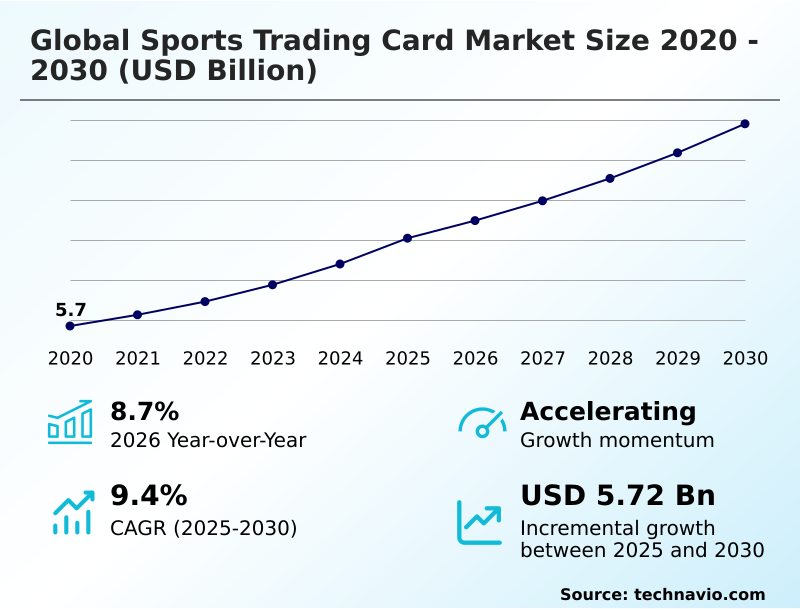
The sports trading card market size is valued to increase by USD 5.72 billion, at a CAGR of 9.4% from 2025 to 2030. Convergence of nostalgia and alternative investment will drive the sports trading card market.
Major Market Trends & Insights
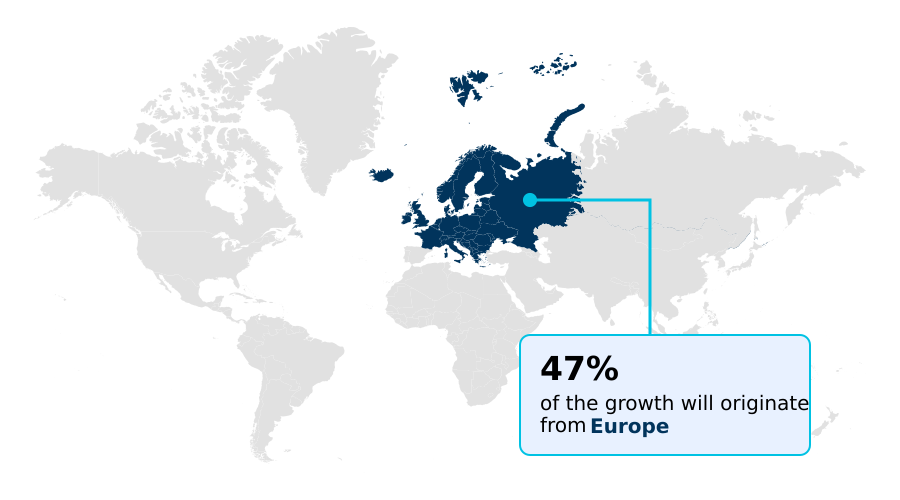
- Europe dominated the market and accounted for a 47.1% growth during the forecast period.
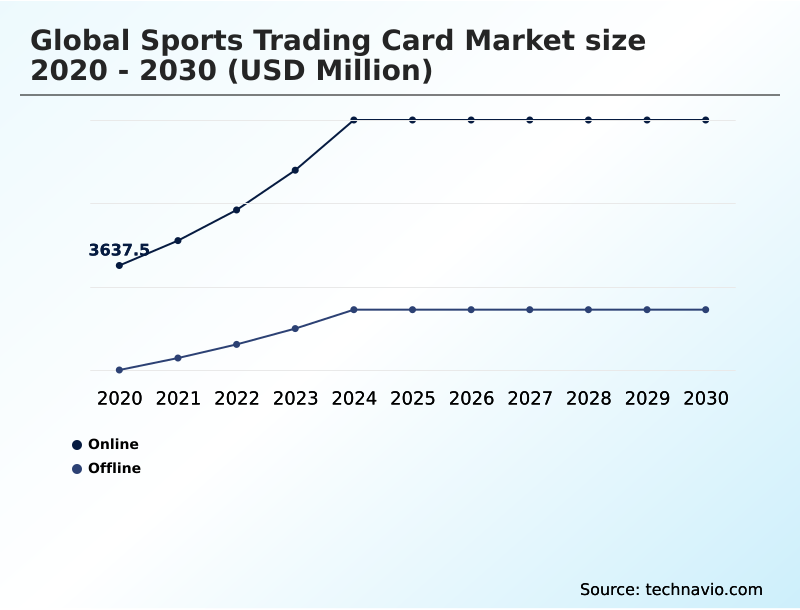
- By Distribution Channel - Online segment was valued at USD 5.83 billion in 2024
- By Product Type - Physical segment accounted for the largest market revenue share in 2024
Market Size & Forecast
- Market Opportunities: USD 10.10 billion
- Market Future Opportunities: USD 5.72 billion
- CAGR from 2025 to 2030 : 9.4%
Market Summary
- The sports trading card market is undergoing a significant transformation, evolving from a traditional hobby into a sophisticated alternative investment landscape. This shift is driven by a blend of enduring collector nostalgia and modern financial innovations. The ecosystem now encompasses licensed producers, advanced authentication and grading services, and global online exchange platforms that enhance liquidity and price discovery.
- A key dynamic is the increasing use of blockchain for creating non-fungible tokens (NFTs), which provides verifiable digital ownership and addresses concerns around authenticity. For businesses operating in this space, this evolution presents both opportunities and challenges. For instance, a distributor must now manage a bifurcated supply chain catering to both physical and digital asset classes.
- Optimizing inventory for such a hybrid model, where the value of a physical card can influence its digital counterpart and vice-versa, requires advanced analytics to forecast demand across vastly different consumer segments, from legacy collectors to crypto-native investors. The market's future will be shaped by how well stakeholders integrate these tangible and digital worlds.
What will be the Size of the Sports Trading Card Market during the forecast period?
Get Key Insights on Market Forecast (PDF) Get Free Sample
How is the Sports Trading Card Market Segmented?
The sports trading card industry research report provides comprehensive data (region-wise segment analysis), with forecasts and estimates in "USD million" for the period 2026-2030, as well as historical data from 2020-2024 for the following segments.
- Distribution channel
- Online
- Offline
- Product type
- Physical
- Digital
- Type
- Rookie cards
- Autographed cards
- Game-used memorabilia cards
- Parallel cards
- Application
- Basketball
- Association football
- American football
- Others
- Geography
- Europe
- Germany
- UK
- France
- North America
- US
- Canada
- Mexico
- APAC
- China
- Japan
- South Korea
- South America
- Brazil
- Argentina
- Middle East and Africa
- UAE
- Saudi Arabia
- South Africa
- Rest of World (ROW)
- Europe
By Distribution Channel Insights
The online segment is estimated to witness significant growth during the forecast period.
The online channel is a foundational segment, defined by dynamic e-commerce online marketplaces and specialized exchange platforms that provide unparalleled liquidity and price transparency.
These digital arenas facilitate secondary market transactions between a global sports card community, from casual collectors buying hobby boxes to online case breakers moving high volumes.
This environment fosters competitive, market-driven trading card values and enhances access to new sports card releases from licensed producers.
The infrastructure supports various transaction models, including the sports card auction format, with strategic market penetration in some verticals contributing as much as 47.1% to incremental growth. This channel's evolution continues to redefine collector engagement and market accessibility.
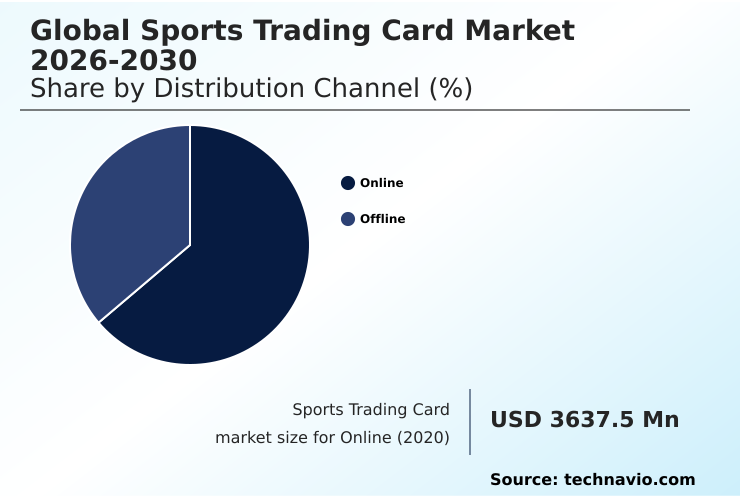
The Online segment was valued at USD 5.83 billion in 2024 and showed a gradual increase during the forecast period.
Regional Analysis
Europe is estimated to contribute 47.1% to the growth of the global market during the forecast period.Technavio’s analysts have elaborately explained the regional trends and drivers that shape the market during the forecast period.
See How Sports Trading Card Market Demand is Rising in Europe Get Free Sample
The geographic landscape is diverse, with distinct regional dynamics. North America remains a dominant force, characterized by a sophisticated tiered product ecosystem and high demand for ultra-premium releases.
Europe, contributing 47.1% of incremental growth, is primarily driven by soccer, with a fervent collector base. The APAC region is an emerging frontier, showing a growing appetite for basketball rookie cards and autographed cards.
In all regions, the market is influenced by adjacent entertainment sectors like collectible card games and fantasy sports. The advent of name, image, and likeness (NIL) deals is creating new opportunities, particularly in the US.
The market in Europe is expanding at a rate of 9.9%, slightly outpacing North America's 9.3% expansion rate, indicating shifting growth dynamics.
Market Dynamics
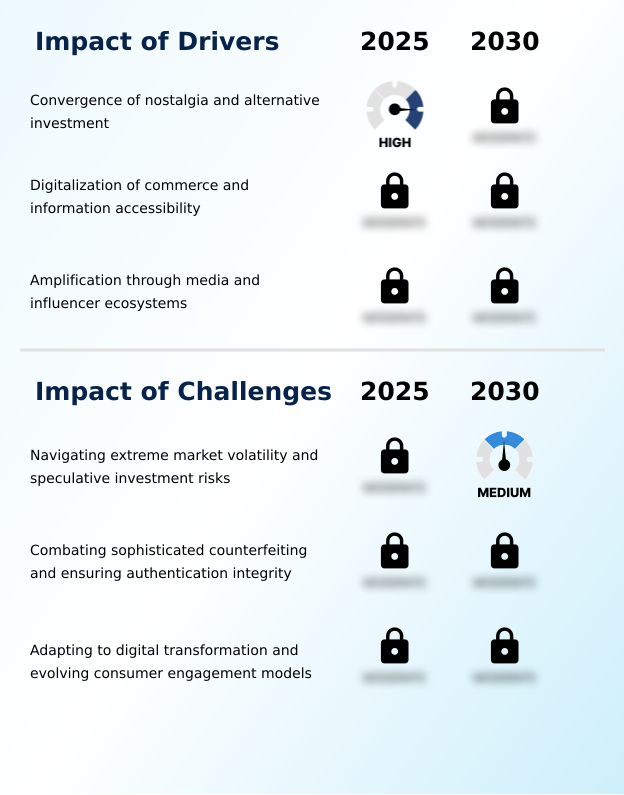
Our researchers analyzed the data with 2025 as the base year, along with the key drivers, trends, and challenges. A holistic analysis of drivers will help companies refine their marketing strategies to gain a competitive advantage.
- Navigating the future of the sports trading card market requires a nuanced understanding of its evolving dynamics. Valuing rookie cards for long-term investment remains a cornerstone, but investors must now also consider the impact of blockchain on sports card authenticity when comparing physical sports cards vs digital nfts.
- The risks of speculative investment in trading cards have intensified, making the role of third-party grading in sports card value more critical than ever. Investors must develop strategies for collecting autographed sports cards and investing in game-used memorabilia cards while understanding parallel cards and their rarity.
- Key growth of the basketball trading card segment, which outpaced the market's overall expansion by over 4%, highlights opportunities in specific verticals. Analyzing sports card market dynamics in european football reveals different consumer behaviors compared to the US.
- Addressing the challenges in the sports trading card industry involves understanding the drivers for the sports memorabilia market and exploring opportunities in the digital collectibles space. Furthermore, understanding how name image and likeness (nil) impacts college sports cards is crucial for anticipating new product lines.
- This includes evaluating the condition of vintage sports cards, knowing the difference between hobby boxes and retail packs, and following best practices for storing valuable trading cards while understanding the secondary market for sports cards and investing in fractional ownership of sports cards.
What are the key market drivers leading to the rise in the adoption of Sports Trading Card Industry?
- A primary driver for the market is the powerful convergence of nostalgic sentiment with the escalating recognition of collectibles as a legitimate alternative asset class.
- The market's expansion is propelled by the powerful convergence of the traditional collecting hobby with the recognition of cards as a legitimate alternative asset class.
- This dual force attracts a diverse cohort of participants, from those engaged in hobbyist pursuits to serious collector-investors seeking alternative investments. The sports collectibles market thrives on the tangible ownership and verifiable scarcity of physical sports memorabilia.
- A strong hero-centric narrative, amplified by media, drives demand for investment-grade cards. The entire ecosystem is built upon exclusive licensing agreements and the protection of intellectual property rights, which ensures product authenticity.
- Certain application segments driven by these factors have demonstrated over 15% higher year-over-year growth than adjacent categories, validating their market power.
What are the market trends shaping the Sports Trading Card Industry?
- The proliferation of fractional ownership models and asset securitization is a transformative trend, reshaping the financial architecture of the market.
- A transformative trend reshaping the financial architecture of the market is the proliferation of fractional ownership models, which facilitate the asset securitization of high-value cards. This development democratizes sports card investing, turning tangible collectibles into a more liquid collectible asset class. Simultaneously, the integration of blockchain technology to create non-fungible tokens (NFTs) and other digital collectibles is expanding the ecosystem.
- Advanced trading card technology like prismatic card technologies enhances the appeal of limited edition collectibles. Innovative sales strategies, such as the dutch auction format, have proven to increase engagement by over 20% compared to traditional sales. This convergence of finance and technology, evident in the growth of pan-european online marketplaces, is crucial for detailed sports card market analysis.
What challenges does the Sports Trading Card Industry face during its growth?
- A primary challenge confronting the market is navigating the unprecedented level of price volatility and the inherent risks of its transformation into a speculative investment vehicle.
- A primary challenge confronting the trading card industry is the extreme volatility associated with its transformation into a speculative investment vehicle. While third-party grading services provide standardized physical condition assessment and sports card authentication, the market for rare trading cards remains susceptible to speculative bubbles. Navigating this requires a deep understanding of both vintage sports cards and modern sports cards.
- The integrity of authentication and grading services is paramount, as a gem mint grade can increase an item's value exponentially. Ensuring the legitimacy of on-card autographs and identifying sophisticated alterations to short-printed variations are ongoing operational hurdles. In some regions, market fragmentation leads to price inconsistencies of up to 10% for comparable assets, complicating risk management for investors.
Exclusive Technavio Analysis on Customer Landscape
The sports trading card market forecasting report includes the adoption lifecycle of the market, covering from the innovator’s stage to the laggard’s stage. It focuses on adoption rates in different regions based on penetration. Furthermore, the sports trading card market report also includes key purchase criteria and drivers of price sensitivity to help companies evaluate and develop their market growth analysis strategies.
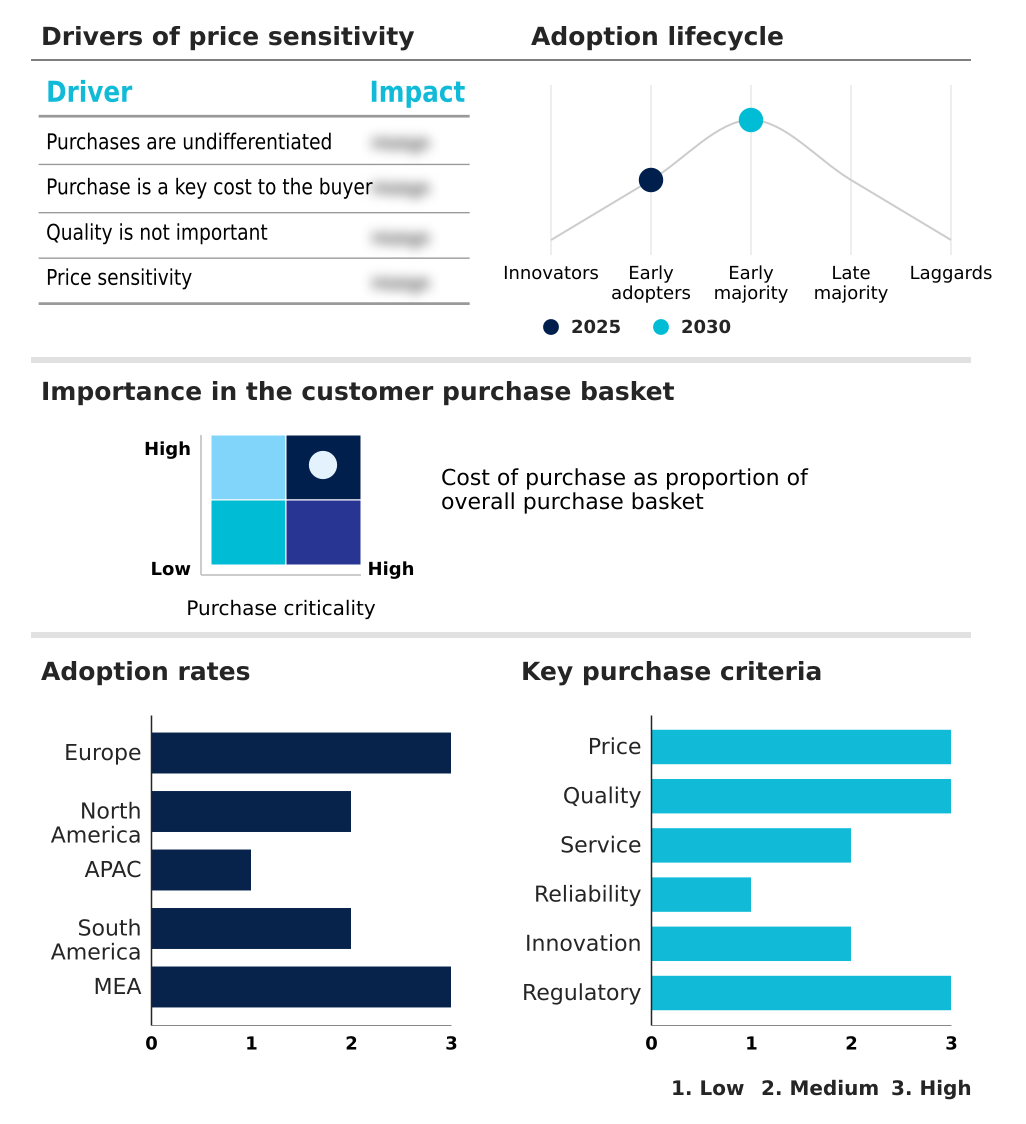
Customer Landscape of Sports Trading Card Industry
Competitive Landscape
Companies are implementing various strategies, such as strategic alliances, sports trading card market forecast, partnerships, mergers and acquisitions, geographical expansion, and product/service launches, to enhance their presence in the industry.
Choice Marketing Inc. - Delivers a diverse portfolio of licensed sports trading cards, including basketball, football, and soccer, featuring exclusive autographs and memorabilia sets for collectors and enthusiasts.
The industry research and growth report includes detailed analyses of the competitive landscape of the market and information about key companies, including:
- Choice Marketing Inc.
- Club Legacyz
- Cryptozoic Entertainment LLC
- Futera Ltd.
- Leaf Trading Cards LLC
- NETPRO Trading Cards LLC
- Panini America Inc.
- Rittenhouse Archives Ltd.
- Select Australia Pty Ltd
- The Upper Deck Co.
- Topps Co. Inc.
- TRISTAR Productions Inc.
- Wild Card Inc.
Qualitative and quantitative analysis of companies has been conducted to help clients understand the wider business environment as well as the strengths and weaknesses of key industry players. Data is qualitatively analyzed to categorize companies as pure play, category-focused, industry-focused, and diversified; it is quantitatively analyzed to categorize companies as dominant, leading, strong, tentative, and weak.
Recent Development and News in Sports trading card market
- In April 2025, The Upper Deck Co. announced it had secured a substantial strategic investment from private investment firm Shamrock Capital to expand product offerings and digital platforms.
- In March 2025, Topps Co. Inc. announced a strategic partnership with FanDuel to integrate physical and digital collecting with sports gaming experiences.
- In February 2025, Asmodee Group, a major European distributor of collectibles, filed for a listing on the Nasdaq Stockholm stock exchange to secure capital for network expansion.
- In December 2024, Topps Co. Inc. launched its 2025-26 Chrome Basketball sets utilizing an innovative Dutch auction format for sales, creating an interactive purchasing experience.
Dive into Technavio’s robust research methodology, blending expert interviews, extensive data synthesis, and validated models for unparalleled Sports Trading Card Market insights. See full methodology.
| Market Scope | |
|---|---|
| Page number | 301 |
| Base year | 2025 |
| Historic period | 2020-2024 |
| Forecast period | 2026-2030 |
| Growth momentum & CAGR | Accelerate at a CAGR of 9.4% |
| Market growth 2026-2030 | USD 5715.5 million |
| Market structure | Concentrated |
| YoY growth 2025-2026(%) | 8.7% |
| Key countries | Germany, UK, France, Italy, Spain, The Netherlands, US, Canada, Mexico, China, Japan, South Korea, Australia, India, Indonesia, Brazil, Argentina, Chile, UAE, Saudi Arabia, South Africa, Turkey and Israel |
| Competitive landscape | Leading Companies, Market Positioning of Companies, Competitive Strategies, and Industry Risks |
Research Analyst Overview
- The sports trading card market is a complex ecosystem defined by the convergence of collecting and high-stakes investment. Its foundation rests on exclusive licensing agreements and the management of intellectual property rights, which grant licensed producers the ability to create desirable products.
- The value chain includes sophisticated authentication and grading services that perform physical condition assessment, with a gem mint grade from third-party grading services being the pinnacle of value. The market features a tiered product ecosystem with products ranging from retail-specific configurations to ultra-premium releases and hobby boxes.
- Key assets include rookie cards, autographed cards, game-used memorabilia cards, and increasingly intricate parallel cards and short-printed variations featuring on-card autographs. The market has evolved into a speculative investment vehicle where assets are traded on online marketplaces and exchange platforms with high price transparency.
- This has given rise to innovative fractional ownership models and asset securitization of a high-value tangible asset.
- The industry's overall expansion, which saw year-over-year growth of 8.7%, is fueled by a strong hero-centric narrative and a new class of collector-investors, with new technologies like non-fungible tokens (NFTs) on the blockchain and prismatic card technologies reshaping what constitutes tangible ownership and verifiable scarcity.
What are the Key Data Covered in this Sports Trading Card Market Research and Growth Report?
-
What is the expected growth of the Sports Trading Card Market between 2026 and 2030?
-
USD 5.72 billion, at a CAGR of 9.4%
-
-
What segmentation does the market report cover?
-
The report is segmented by Distribution Channel (Online, and Offline), Product Type (Physical, and Digital), Type (Rookie cards, Autographed cards, Game-used memorabilia cards, and Parallel cards), Application (Basketball, Association football, American football, and Others) and Geography (Europe, North America, APAC, South America, Middle East and Africa)
-
-
Which regions are analyzed in the report?
-
Europe, North America, APAC, South America and Middle East and Africa
-
-
What are the key growth drivers and market challenges?
-
Convergence of nostalgia and alternative investment, Navigating extreme market volatility and speculative investment risks
-
-
Who are the major players in the Sports Trading Card Market?
-
Choice Marketing Inc., Club Legacyz, Cryptozoic Entertainment LLC, Futera Ltd., Leaf Trading Cards LLC, NETPRO Trading Cards LLC, Panini America Inc., Rittenhouse Archives Ltd., Select Australia Pty Ltd, The Upper Deck Co., Topps Co. Inc., TRISTAR Productions Inc. and Wild Card Inc.
-
Market Research Insights
- The sports trading card market is characterized by dynamic shifts in consumer behavior and investment strategies. The rise of digital collectibles and online card trading has created a more accessible and liquid environment, with the adoption rate for digital formats outpacing physical products by nearly 5% in the last fiscal period.
- This transition impacts the entire value chain, from sports card authentication to the management of a diverse sports card portfolio. Strategic alignment with high-growth regional demand can boost market penetration by up to 47%, compared to a baseline of 29% in more mature territories.
- As the collecting hobby intersects with alternative investments, understanding these evolving metrics is critical for stakeholders navigating the complexities of the modern sports collectibles market.
We can help! Our analysts can customize this sports trading card market research report to meet your requirements.
 RIA -
RIA - 
