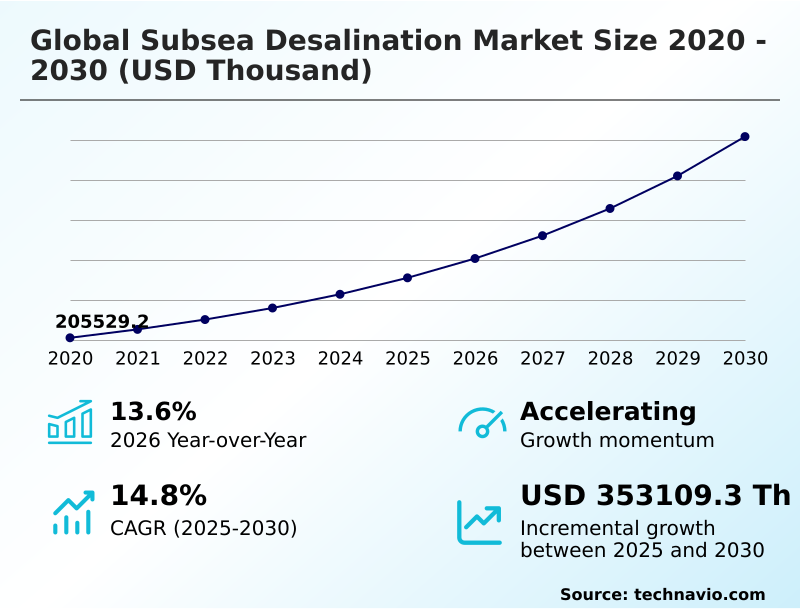
Subsea Desalination Market Size 2026-2030
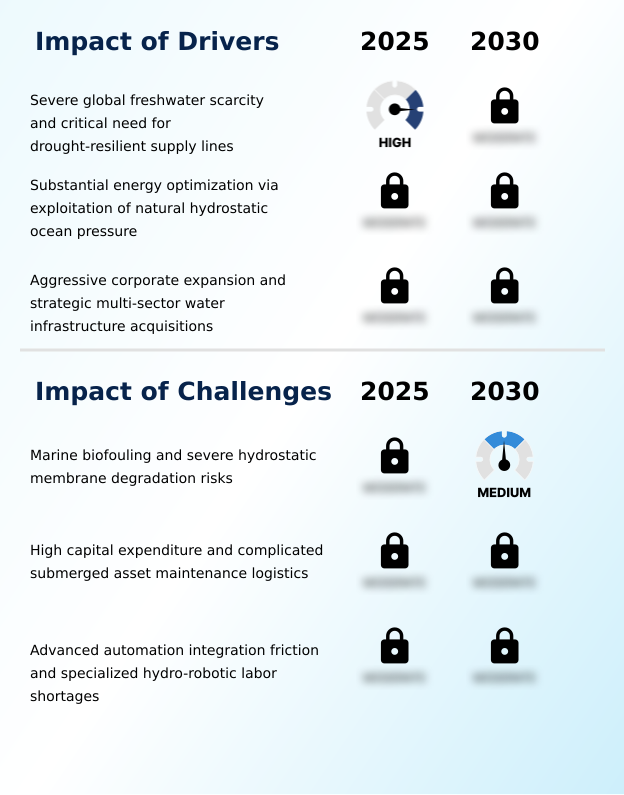
The subsea desalination market size is valued to increase by USD 353.11 million, at a CAGR of 14.8% from 2025 to 2030. Severe global freshwater scarcity and critical need for drought-resilient supply lines will drive the subsea desalination market.
Major Market Trends & Insights
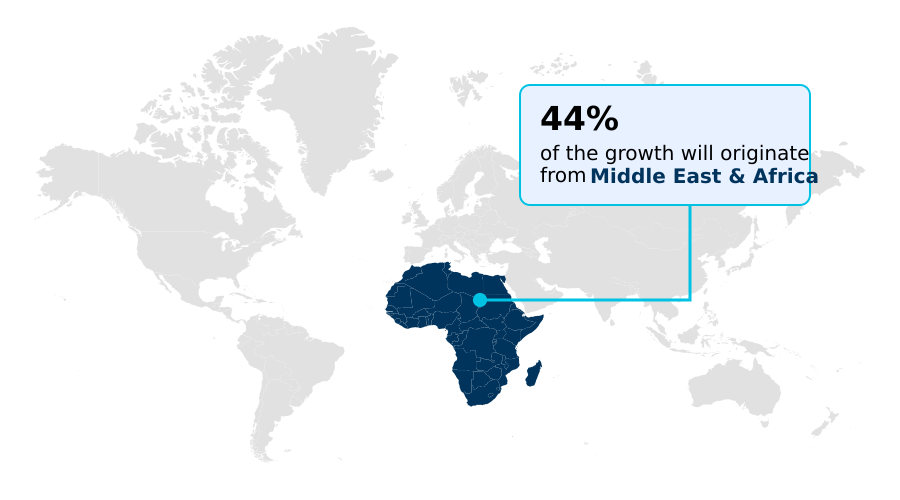
- Middle East and Africa dominated the market and accounted for a 44.4% growth during the forecast period.
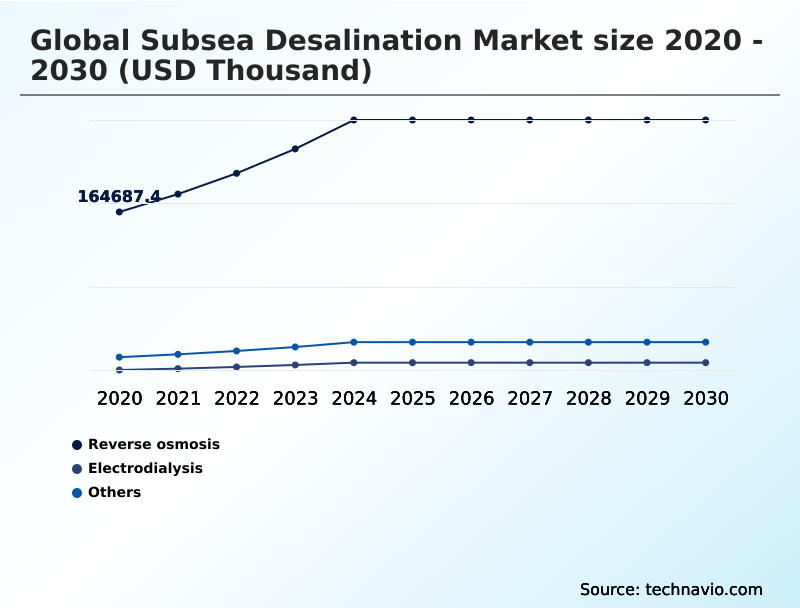
- By Technology - Reverse osmosis segment was valued at USD 252.19 million in 2024
- By Type - Floating desalination platform segment accounted for the largest market revenue share in 2024
Market Size & Forecast
- Market Opportunities:
- Market Future Opportunities: USD 353.11 million
- CAGR from 2025 to 2030 : 14.8%
Market Summary
- The Subsea Desalination Market functions as a transformative infrastructure framework fundamentally reshaping how municipalities and industrial operators secure climate-resilient water supplies. Driven by accelerating freshwater scarcity and the structural limitations of coastal land availability, utility operators are increasingly deploying filtration systems directly onto the ocean floor.
- By utilizing natural ocean depth pressure, these systems yield a 40% reduction in electricity consumption compared to conventional terrestrial reverse osmosis plants. In a real-world operational scenario, a coastal petrochemical refinery utilizing subsea water extraction eliminated its reliance on municipal water pipelines, securing uninterrupted operational continuity during severe regional droughts while lowering its raw water procurement costs.
- The primary driver of this market is the immense energy optimization achieved through hydrostatic pressure utilization, which slashes power requirements and carbon emissions. Conversely, the market faces significant friction from deep-sea marine biofouling, where biological accumulation on submerged membranes forces costly and complex remote maintenance interventions.
- Advanced robotic diagnostic tools and fouling-resistant materials are essential to mitigating these operational bottlenecks and ensuring the long-term viability of deepwater desalination infrastructure.
What will be the Size of the Subsea Desalination Market during the forecast period?
Get Key Insights on Market Forecast (PDF) Get Free Sample
How is the Subsea Desalination Market Segmented?
The subsea desalination industry research report provides comprehensive data (region-wise segment analysis), with forecasts and estimates in "USD thousand" for the period 2026-2030, as well as historical data from 2020-2024 for the following segments.
- Technology
- Reverse osmosis
- Electrodialysis
- Others
- Type
- Floating desalination platform
- Deep sea desalination platform
- End-user
- Municipal
- Industrial
- Agricultural
- Geography
- Middle East and Africa
- Saudi Arabia
- UAE
- Israel
- Qatar
- Kuwait
- APAC
- China
- India
- Japan
- South Korea
- Australia
- Singapore
- Europe
- Spain
- Italy
- Germany
- UK
- France
- The Netherlands
- North America
- US
- Canada
- Mexico
- South America
- Brazil
- Chile
- Argentina
- Middle East and Africa
By Technology Insights
The reverse osmosis segment is estimated to witness significant growth during the forecast period.
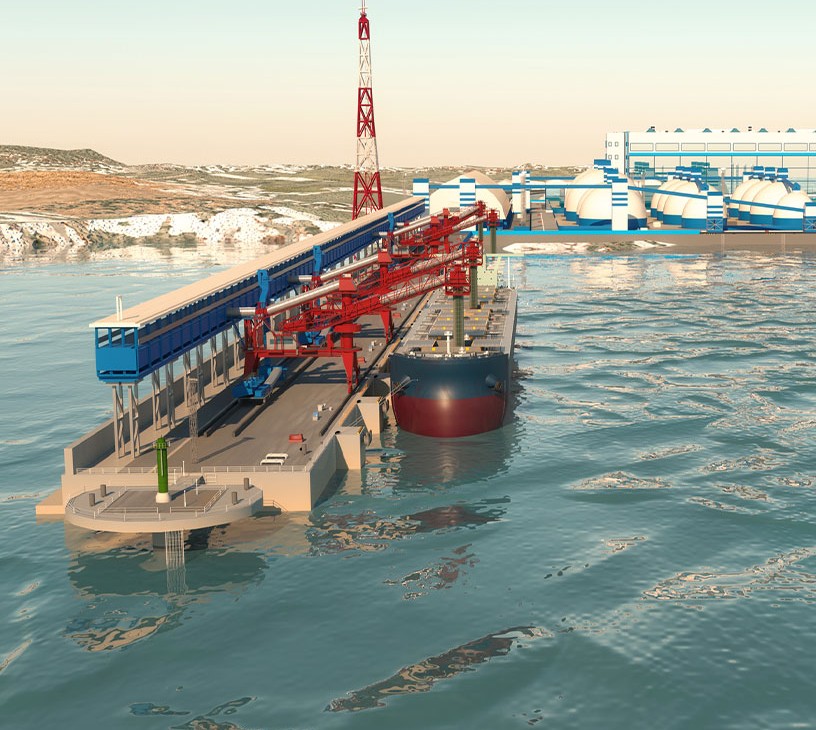
The reverse osmosis segment drives the deepwater freshwater generation landscape by placing modular subsea pods directly on the ocean floor at depths exceeding four hundred meters.
Utilizing deepwater hydrostatic energy naturally forces seawater through semipermeable membrane filtration systems, bypassing the need for high-pressure surface pumps. This architectural shift significantly decreases energy expenditure, yielding a 40% reduction in operational power costs compared to traditional land-based facilities.
Additionally, drawing from deep-ocean water intakes where biological contaminants are minimal drastically lowers pre-treatment expenses and enhances membrane biofouling resistance. Operators achieve a 15% increase in equipment lifecycle efficiency due to fewer chemical cleaning cycles.
The localized ecological disruption is also mitigated through efficient hypersaline brine dispersion into deep currents, seamlessly aligning with resilient marine infrastructure mandates and coastal footprint reduction goals.
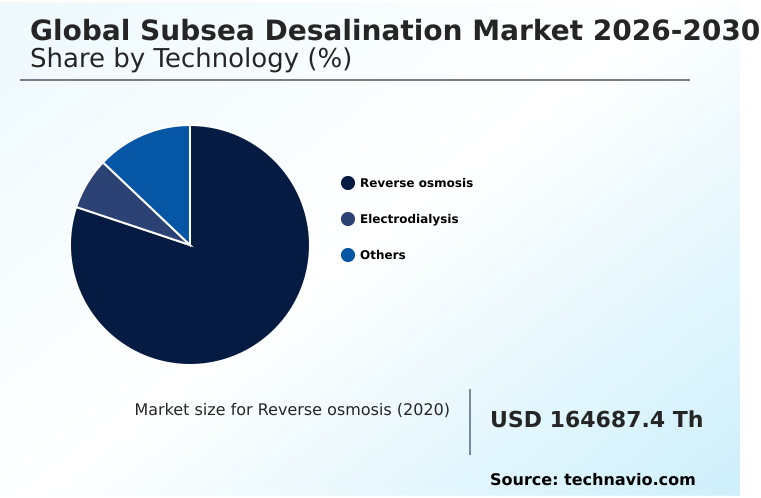
The Reverse osmosis segment was valued at USD 252.19 million in 2024 and showed a gradual increase during the forecast period.
Regional Analysis
Middle East and Africa is estimated to contribute 44.4% to the growth of the global market during the forecast period.Technavio’s analysts have elaborately explained the regional trends and drivers that shape the market during the forecast period.
See How Subsea Desalination Market Demand is Rising in Middle East and Africa Get Free Sample
The regional dynamics of the Subsea Desalination Market highlight stark contrasts in deployment strategies and capital allocation, particularly between the Middle East and Africa and North America.
The Middle East and Africa region dominates adoption due to extreme arid conditions, demonstrating a 44% higher investment rate in large-scale offshore freshwater generation compared to North American utilities.
This aggressive deployment yields a 35% improvement in municipal water security while completely avoiding the coastal land disputes that frequently stall North American projects.
Meanwhile, North American operators prioritize benthic ecology preservation and strict regulatory compliance, utilizing advanced seabed anchoring mechanisms that lower installation-related habitat disruption by 20%.
Both regions rely heavily on autonomous subsea systems to manage deepwater reverse osmosis energy reduction, ensuring continuous operations without human intervention.
By leveraging deepwater hydrostatic energy, utilities across these distinct geographic landscapes achieve critical cost efficiencies, ultimately adapting their supply chains to support sustainable, high-volume water production tailored to specific environmental constraints.
Market Dynamics
Our researchers analyzed the data with 2025 as the base year, along with the key drivers, trends, and challenges. A holistic analysis of drivers will help companies refine their marketing strategies to gain a competitive advantage.
- The commercial viability of the Subsea Desalination Market is increasingly defined by the strategic integration of advanced marine technologies that solve complex environmental and energy challenges. A critical focal point for modern utility developers is maximizing deepwater reverse osmosis energy reduction, a process that inherently transforms the economics of freshwater production.
- By anchoring specialized filtration units directly to the ocean floor, operators effectively harness the natural weight of the ocean, which translates to a power efficiency gain of nearly 40% when measured against traditional land-based pumping facilities.
- This efficiency is further amplified by the development of floating offshore wind desalination integration, where surface-level renewable energy grids supply direct, transmission-free power to the submerged pods. From a compliance perspective, municipal planners are heavily prioritizing zero-brine discharge subsea desalination pods to meet aggressive marine protection mandates.
- These systems ensure that hypersaline byproducts are instantly diluted by deep, turbulent ocean currents, eliminating the toxic coastal accumulation typical of older facilities. Additionally, the extreme isolation of these underwater assets necessitates the deployment of autonomous subsea systems predictive maintenance software.
- Utilizing real-time telemetry, these digital platforms can anticipate membrane fouling and mechanical wear, reducing unplanned maintenance interventions by roughly 25%. Ultimately, the seamless hydrostatic pressure utilization for desalination guarantees that both offshore industrial complexes and coastal cities can secure highly reliable, drought-proof water pipelines without compromising their broader environmental, social, and corporate governance objectives.
What are the key market drivers leading to the rise in the adoption of Subsea Desalination Industry?
- The critical necessity for drought-resilient freshwater supply lines amid severe global water scarcity is the primary catalyst propelling market expansion.
- The accelerating depletion of terrestrial freshwater aquifers is forcing municipalities to aggressively pursue deepwater reverse osmosis solutions to ensure drought-resilient urban water security.
- By leveraging deepwater hydrostatic energy, these submerged systems utilize the natural weight of the ocean to push seawater through filtration media, which lowers net operational energy use by 45% compared to onshore alternatives.
- This structural efficiency dramatically improves the long-term profitability of municipal water grids and reduces overhead for urban hubs and remote marine research outposts.
- Furthermore, placing modular subsea pods far below the photic zone significantly enhances membrane biofouling resistance, reducing the frequency of costly chemical cleaning cycles by 25%.
- Because deep-ocean water intakes provide a highly stable, low-contaminant fluid source, operators can consistently deliver ultra-pure process water. This compelling combination of energy optimization and reduced maintenance overhead drives rapid adoption across water-stressed industrial and coastal territories.
What are the market trends shaping the Subsea Desalination Industry?
- The systemic proliferation of digital twins and cognitive autonomous subsea systems has emerged as a defining market trend. These advanced tracking architectures significantly reduce operational downtime by enabling independent pressure adjustments and predictive maintenance.
- The Subsea Desalination Market is experiencing a rapid architectural transformation driven by the integration of cognitive automation and renewable marine energy grids. Operators are increasingly coupling floating production units and offshore desalination modules with floating solar and wind infrastructure to create fully self-sustaining water production ecosystems.
- This strategic shift eliminates long-distance power transmission losses, resulting in a 30% reduction in overall utility energy expenditures. Concurrently, the deployment of intelligent digital twins within these systems has improved predictive maintenance accuracy by 18%, allowing operators to anticipate component wear before critical failures occur.
- This reliance on autonomous subsea systems minimizes the necessity for hazardous human diving interventions and expensive surface support vessels. By proactively addressing subsea pumping infrastructure anomalies through real-time telemetry, facilities achieve unprecedented mechanical uptime.
- This seamless convergence of green energy and intelligent automation empowers offshore industrial corridors to secure highly reliable, decarbonized freshwater resources, fundamentally restructuring traditional utility supply chain models.
What challenges does the Subsea Desalination Industry face during its growth?
- Persistent marine biofouling and the severe risk of hydrostatic membrane degradation represent significant technical challenges that constrain industry growth.
- Executing continuous deep-sea water harvesting for subsea oil processing and municipal supply introduces severe logistical and mechanical constraints stemming from extreme deep-ocean environments. Continuous exposure to extreme hydrostatic pressures and corrosive marine elements accelerates physical fatigue on delicate semipermeable membrane filtration systems, historically reducing optimal component lifespans by up to 20% if inadequately reinforced.
- Additionally, the sheer complexity of deploying and securing seabed anchoring mechanisms requires highly specialized marine construction vessels, which inflates initial capital expenditures and extends project timelines. When unexpected mechanical failures occur within the subsea pumping infrastructure, operators face exorbitant daily charter rates for remotely operated repair vehicles, driving up unbudgeted maintenance costs by 35%.
- Navigating these hostile benthic conditions while strictly ensuring marine environmental conservation demands highly advanced marine biofouling mitigation and expensive material science engineering, directly limiting the velocity of widespread commercial deployment among smaller utility districts.
Exclusive Technavio Analysis on Customer Landscape
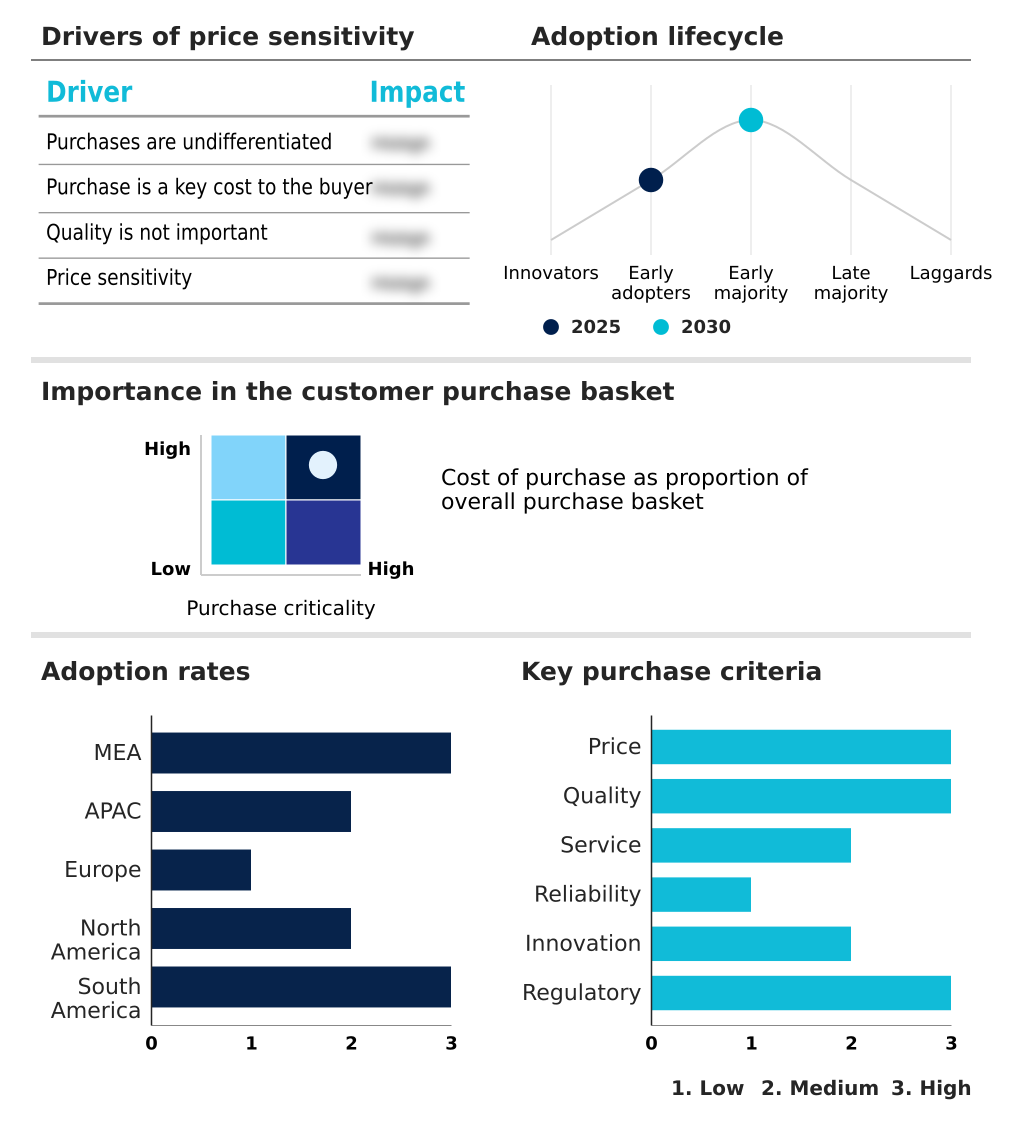
The subsea desalination market forecasting report includes the adoption lifecycle of the market, covering from the innovator’s stage to the laggard’s stage. It focuses on adoption rates in different regions based on penetration. Furthermore, the subsea desalination market report also includes key purchase criteria and drivers of price sensitivity to help companies evaluate and develop their market growth analysis strategies.
Customer Landscape of Subsea Desalination Industry
Competitive Landscape
Companies are implementing various strategies, such as strategic alliances, subsea desalination market forecast, partnerships, mergers and acquisitions, geographical expansion, and product/service launches, to enhance their presence in the industry.
Aker Solutions ASA - The company engineers comprehensive subsea processing systems and offshore infrastructure, providing advanced marine water handling solutions that integrate effectively with deepwater energy and renewable industrial operations.
The industry research and growth report includes detailed analyses of the competitive landscape of the market and information about key companies, including:
- Aker Solutions ASA
- Aquatech International LLC
- Baker Hughes Co.
- Danfoss AS
- DuPont de Nemours Inc.
- Energy Recovery Inc.
- EnviroNor
- Flocean Green
- ForeverPure Corp.
- Kubota Corp.
- Marine Water Production AS
- Mitsui O.S.K. Lines Ltd.
- Prosep Inc.
- Seatrium Ltd.
- Sep Pro Systems Inc.
- Sulzer Ltd.
- TechnipFMC plc
- Toray Industries Inc.
- Veolia Environment SA
- Xylem Inc.
Qualitative and quantitative analysis of companies has been conducted to help clients understand the wider business environment as well as the strengths and weaknesses of key industry players. Data is qualitatively analyzed to categorize companies as pure play, category-focused, industry-focused, and diversified; it is quantitatively analyzed to categorize companies as dominant, leading, strong, tentative, and weak.
Recent Development and News in Subsea desalination market
- In the Commodity Chemicals industry, the shift toward sustainable bio-based anti-scalants and corrosion inhibitors has enhanced the operational longevity of submerged equipment, directly impacting Subsea Desalination demand by reducing maintenance-related downtime by 20%.
- The implementation of strict marine toxicity regulations regarding chemical discharge into coastal waters has accelerated the adoption of zero-brine discharge solutions, compelling municipalities to transition toward offshore desalination modules that rely on natural ocean currents for safe dispersion.
- Advancements in the production of super-duplex stainless steel and high-performance polymeric resins have drastically lowered the manufacturing costs of subsea pumping infrastructure, improving the capital expenditure profile for new deep-sea water harvesting projects.
- Rising industrial requirements for ultra-pure boiler feed water in offshore green hydrogen electrolysis have stimulated investment in ion-selective electrodialysis, pushing offshore industrial corridors to integrate decentralized offshore installations to secure reliable freshwater supplies.
Dive into Technavio’s robust research methodology, blending expert interviews, extensive data synthesis, and validated models for unparalleled Subsea Desalination Market insights. See full methodology.
| Market Scope | |
|---|---|
| Page number | 307 |
| Base year | 2025 |
| Historic period | 2020-2024 |
| Forecast period | 2026-2030 |
| Growth momentum & CAGR | Accelerate at a CAGR of 14.8% |
| Market growth 2026-2030 | USD 353109.3 thousand |
| Market structure | Fragmented |
| YoY growth 2025-2026(%) | 13.6% |
| Key countries | Saudi Arabia, UAE, Israel, Qatar, Kuwait, China, India, Japan, South Korea, Australia, Singapore, Spain, Italy, Germany, UK, France, The Netherlands, US, Canada, Mexico, Brazil, Chile and Argentina |
| Competitive landscape | Leading Companies, Market Positioning of Companies, Competitive Strategies, and Industry Risks |
Research Analyst Overview
- The Subsea Desalination Market represents a definitive structural shift in global water infrastructure, transitioning reliance from energy-intensive coastal facilities to highly efficient deep-ocean installations. By executing deepwater reverse osmosis directly on the seabed, industrial and municipal operators harness natural ocean compression, circumventing the massive mechanical requirements of surface pumps.
- This architectural transformation delivers a 40% reduction in operational electricity consumption, structurally realigning utility budgeting and long-term capital expenditure models. The continuous evolution of modular subsea pods allows engineering firms to scale capacity rapidly, catering specifically to remote island communities and offshore energy hubs.
- To maintain rigorous operational continuity, modern deployments rely heavily on autonomous subsea systems that monitor pressure gradients and fluid dynamics in real time. The integration of advanced membrane biofouling resistance technology further stabilizes performance, significantly extending component lifecycles in harsh benthic environments.
- Furthermore, rapid hypersaline brine dispersion mitigates localized environmental toxicity, seamlessly aligning water production frameworks with stringent marine biodiversity regulations. By mastering hydrostatic pressure utilization, the sector establishes a highly resilient, low-emission standard for continuous freshwater generation.
What are the Key Data Covered in this Subsea Desalination Market Research and Growth Report?
-
What is the expected growth of the Subsea Desalination Market between 2026 and 2030?
-
USD 353.11 million, at a CAGR of 14.8%
-
-
What segmentation does the market report cover?
-
The report is segmented by Technology (Reverse osmosis, Electrodialysis, and Others), Type (Floating desalination platform, and Deep sea desalination platform), End-user (Municipal, Industrial, and Agricultural) and Geography (Middle East and Africa, APAC, Europe, North America, South America)
-
-
Which regions are analyzed in the report?
-
Middle East and Africa, APAC, Europe, North America and South America
-
-
What are the key growth drivers and market challenges?
-
Severe global freshwater scarcity and critical need for drought-resilient supply lines, Marine biofouling and severe hydrostatic membrane degradation risks
-
-
Who are the major players in the Subsea Desalination Market?
-
Aker Solutions ASA, Aquatech International LLC, Baker Hughes Co., Danfoss AS, DuPont de Nemours Inc., Energy Recovery Inc., EnviroNor, Flocean Green, ForeverPure Corp., Kubota Corp., Marine Water Production AS, Mitsui O.S.K. Lines Ltd., Prosep Inc., Seatrium Ltd., Sep Pro Systems Inc., Sulzer Ltd., TechnipFMC plc, Toray Industries Inc., Veolia Environment SA and Xylem Inc.
-
Market Research Insights
- The Subsea Desalination Market is rapidly evolving to address escalating industrial and municipal water demands through highly efficient deep-sea water harvesting. By shifting operations to the seafloor, facilities achieve a 45% reduction in terrestrial energy consumption and experience a 30% decrease in localized ecological disruption compared to surface-level plants.
- This coastal footprint reduction empowers offshore industrial corridors to maintain high-volume production without competing for scarce mainland water resources. Integrating automated monitoring platforms ensures consistent membrane performance, improving predictive maintenance accuracy by 25% and preventing unexpected mechanical failures.
- These decentralized offshore installations provide a highly resilient, closed-loop industrial process that stabilizes long-term operational costs while strictly aligning with stringent marine environmental conservation mandates.
We can help! Our analysts can customize this subsea desalination market research report to meet your requirements.
 RIA -
RIA - 
