Subsea Umbilicals, Risers, And Flow Lines (SURF) Market Analysis APAC, Europe, North America, Middle East and Africa, South America - China, US, Russia, United Arab Emirates, Canada - Size and Forecast 2024-2028

Subsea Umbilicals, Risers, And Flow Lines (SURF) Market Analysis APAC, Europe, North America, Middle East and Africa, South America - China, US, Russia, United Arab Emirates, Canada - Size and Forecast 2024-2028

Published: Aug 2024 182 Pages SKU: IRTNTR43338

Market Overview at a Glance

$4.9 B
Market Opportunity
9.53%
CAGR
8.24
YoY growth 2023-2024(%)

Subsea Umbilicals, Risers, And Flow Lines Market Size 2024-2028

The subsea umbilicals, risers, and flow lines (SURF) market size is forecast to increase by USD 4.9 billion, at a CAGR of 9.53% between 2023 and 2028. The growth of the market is fueled by several factors, including the adoption of new exploration policies, increased energy demand, and declining exploration and production costs in deepwater and ultra-deepwater oil and gas projects. These dynamics encourage further investment and development in the sector, driving exploration activities and bolstering production capabilities. Additionally, technological advancements play a crucial role in enhancing operational efficiencies and reducing costs, contributing to the overall growth and sustainability of the oil and gas industry.

What will be the size of the Market During the Forecast Period?

Subsea Umbilicals, Risers, And Flow Lines (Surf) Market Size

To learn more about this report, View Report Sample

Vital components like umbilicals, risers, and flowlines ensure efficient transportation of produced fluids from subsea wells to processing systems and ultimately to surface systems. This sector also prioritizes energy-efficient solutions and processing plants to cater to the needs of energy production in deep seas. With a focus on both crude oil and gas extraction, SURF technologies contribute significantly to the development of subsea projects and the overall oil and gas production sector.

Market Dynamics and Customer Landscape

The subsea production system plays a pivotal role in subsea oil and gas production, especially in challenging environments like mature fields and deepwater locations. These systems efficiently manage oil reserves through advanced processing systems and flowlines that transport resources from the subsea well to the surface. Floating rigs are often used to access these reserves, accommodating varying water depths. A top-down approach combined with a bottom-up approach ensures comprehensive analysis and management of the subsea infrastructure. The integration of Marine Ports & Services is crucial for supporting these operations, facilitating the transfer of materials and equipment. Effective subsea production systems contribute to optimized extraction processes and extended field life, making them indispensable for the sustainable development of subsea oil and gas production.

Moreover, the market is driven by the demand for surface systems, subsea production systems, and processing systems to handle produced fluids and unprocessed fluids from subsea wells. Particularly in deep and ultra-deep water depths, crude oil producers, especially in regions like Alaska, seek to exploit proved natural gas reserves, measured in trillion cubic feet (Tcf). As offshore oil and gas production projects increasingly target deep-sea developments, capital-intensive techniques and digital technologies enable efficient drilling operations. This market also involves the deployment of high-end deep-water electro-hydraulic umbilicals and steel tube umbilicals, supported by engineering, procurement, construction, and installation services. Energy-efficient solutions, processing plants, and subsea projects are integral components driving growth in the SURF market, catering to the needs of oil and gas production in deep seas.

Key Market Driver

The increase in energy demand is notably driving the Subsea Umbilicals, Risers, and Flow Lines Market growth. Any nation's ability to produce an abundance of energy determines how rapidly it can grow economically. Reliable and affordable energy promotes the expansion of numerous industries, including the production of electricity, ensures increased trade, and enhances transportation for the benefit of the country. Global energy demand has risen as a result of the rising world population and economic development, particularly in Asia.

Moreover, the majority of nations that produce oil do not have many additional capacities. Oil companies will, therefore, need to explore and drill greenfield wells in new and existing oil fields in order to satisfy the high fuel demand. The demand for oilfield equipment like SURF will rise as a result of these new drilling projects, and SURF manufacturers will have tremendous growth potential to boost their profitability. During the forecast period, these factors are anticipated to fuel the global SURF market's expansion, shaping Market forecasting and influencing market research and growth.

Significant Market Trends

The emergence of next-generation automated drilling rigs is an emerging trend in the Subsea Umbilicals, Risers, and Flow Lines Market. Capital investment in exploration activities has decreased due to the recent decline in crude oil prices. The profit margins of upstream companies are continuing to contract due to the drop in crude oil prices, which necessitates increased operational efficiency. The upstream oil and gas industry is using digital technology as a key tool to boost operational efficiency and profit margins. Using sensors in drilling equipment and tools as part of digitalization will present new business opportunities for suppliers of downhole drilling tools. Digitalization will make it easier to record a large amount of data, compare it to data from other fields and drilling rigs, access historical data, and make wise decisions.

Moreover, workers on offshore rigs face significant safety risks, and mistakes could result in fatal accidents and environmental catastrophes. Human error is to blame for the majority of accidents on offshore rigs. As a result, rig operators are introducing automated rigs as a means of ensuring the safety of the workers. The use of sensors in drilling rigs and related apparatus is called rig automation. In order to make informed decisions, vast amounts of data can be gathered and compared with the data from other fields and rigs. The global oil and gas market will benefit from the growing adoption of automation in offshore drilling rigs because it will make the offshore drilling process more accessible. Hence, such factors are expected to drive the growth of the global SURF market during the forecast period, influencing market growth and forecasting in the Subsea Equipment Market and the Offshore Oil and Gas Market.

Major Market Challenge

Environmental problems in the offshore oil and gas industry are major challenges impeding the subsea umbilicals, risers, and flow lines market growth. Expanded offshore drilling raises the possibility of oil spills, which could ruin beaches and the coastline and harm people who live, work, and visit there, as well as vital habitats for wildlife and flora. Acid rain, a heightened greenhouse effect, and tainted drinking water are a few examples of environmental effects. Rarely, the oil and gas sector may also be a factor in ecosystem collapse and the decline of biodiversity.

In addition, drilling operations, oil spills and leaks are the leading causes of water pollution. For instance, the Deepwater Horizon oil spill in 2010 damaged the northern Gulf of Mexico ecosystem on a large scale. Many aquatic creatures, including plankton, invertebrates, fish, birds, and sea mammals, suffered damage from the 3.19 million barrels of oil that leaked into the ocean. The disaster's oil severely accelerated land erosion along hundreds of miles of the US coastline surrounding the Gulf of Mexico. Environmental activists had doubts about the future of offshore drilling and its overall effects on the environment after the massive oil spill. Hence, offshore drilling is facing challenges due to the environmental impact of oil leakage. Such factors are expected to hinder the growth of the global SURF market during the forecast period.

Key Market Customer Landscape

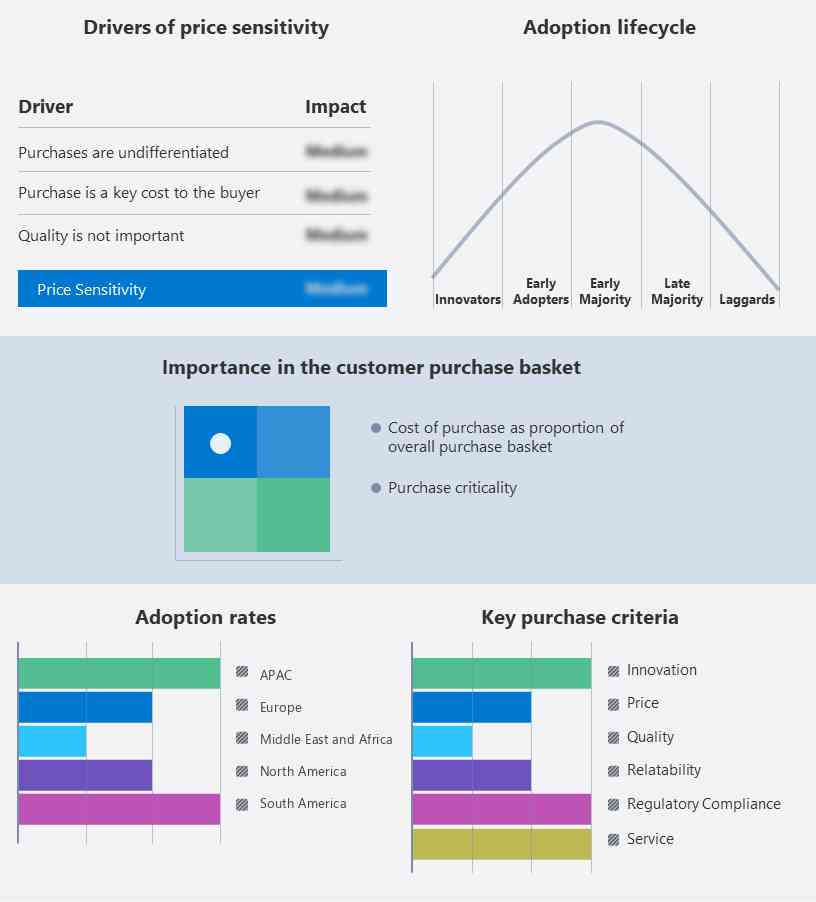
The report includes the adoption lifecycle of the market, covering from the innovator's stage to the laggard's stage. It focuses on adoption rates in different regions based on penetration. Furthermore, the report also includes key purchase criteria and drivers of price sensitivity to help companies evaluate and develop their growth strategies.

Subsea Umbilicals, Risers, and Flow Lines (SURF) Market Share by Geography

Customer Landscape

Who are the Major Market Companies?

Companies are implementing various strategies, such as strategic alliances, partnerships, mergers and acquisitions, geographical expansion, and product/service launches, to enhance their presence in the market.

ABB Ltd. - The key offerings of the company include subsea umbilicals, risers, and flow line solutions such as long step-out systems, direct electrical heating systems, subsea transformers, and subsea power substations.

The report also includes detailed analyses of the competitive landscape of the market and information about 15 market companies, including:

  • Aker Solutions ASA
  • Baker Hughes Co.
  • Bureau Veritas SA
  • Dril Quip Inc.
  • FIRST Exploration and Petroleum Development Co. Ltd.
  • Havfram
  • McDermott International Ltd.
  • Nexans SA
  • NOV Inc.
  • Oceaneering International Inc.
  • Parker Hannifin Corp.
  • Prysmian Spa
  • SAIPEM SpA
  • Schlumberger Ltd.
  • Subsea 7 SA

Qualitative and quantitative analysis of companies has been conducted to help clients understand the wider business environment as well as the strengths and weaknesses of key market players. Data is qualitatively analyzed to categorize companies as pure play, category-focused, industry-focused, and diversified; it is quantitatively analyzed to categorize companies as dominant, leading, strong, tentative, and weak.

Market Segmentation

By Product

The market share growth by the flowlines segment will be significant during the forecast period. Flexible or rigid pipes that are used to transport lift gas, petrochemicals, injection water, and chemicals are known as flow lines. Flow lines can be made using a single pipe or a group of pipes bundled inside a carrier pipe. When pigging is necessary, flow lines are connected by valves and crossover spools that are set up to allow the circulation of pigs.

Subsea Umbilicals, Risers, And Flow Lines (Surf) Market Size

Get a glance at the market contribution of various segments View the PDF Sample

The flowlines segment was valued at USD 3.60 billion in 2018 and continued to grow until 2022High temperatures and pressures are present when subsea flow lines are in operation. Technical difficulties arise due to these circumstances, such as providing pipe with a high material grade. Additionally, high temperatures can cause pipeline corrosion and a reduction in yield strength. Due to the high fluid temperature and high internal pressure that increase as a result of the restrained flow line, flow lines exposed to high pressure and high-temperature conditions produce an effective axial compressive force. Operators are restarting their stalled offshore projects as a result of the consistently rising demand for oil and gas. In addition, drilling operations have been simplified, and crude prices are expected to be close to USD 30 per barrel in April 2020, which forced exploration companies to take calculated risks and invest in offshore drilling. This will drive offshore development, resulting in higher demand for flow lines during the forecast period.

Which are the Key Regions for the Market?

Subsea Umbilicals, Risers, And Flow Lines (Surf) Market Share by Geography

For more insights on the market share of various regions Download PDF Sample now!

APAC is estimated to contribute 35% to the growth of the global market during the forecast period. Technavio's analysts have elaborately explained the regional trends and drivers that shape the market during the forecast period. Oil is in high demand in APAC due to the region's growing consumption in nations like China, Japan, India, South Korea, and Indonesia. Pressure to supply the rising demand has been exerted on these nations and the rest of the world. This necessitates expanding exploration efforts in the area, which will fuel the SURF market during the forecast period. Moreover, the expansion of deep-water and ultra-deepwater oil and gas projects in China and a few South-Eastern Asian nations is the major factor driving the SURF market in APAC. According to the IEA, the Stated Policies Scenario, which simulates the effects of the current policy frameworks and the current policy intentions, predicts that the oil demand in APAC will increase from 32 million barrels per day (MBPD) in 2018 to 38 MBPD by 2030. The market in APAC is expanding due to the high potential energy demand and strong government support in nations like China, India, and Indonesia. Additionally, there are more deep-water and ultra-deepwater projects being developed off the coast of China. Hence, such factors are expected to drive the growth of the market during the forecast period.

Segment Overview

The market research report provides comprehensive data (region wise segment analysis), with forecasts and estimates in "USD Billion" for the period 2024 to 2028, as well as historical data from 2018 to 2022 for the following segments.

  • Product Outlook
    • Flowlines
    • Umbilicals
    • Risers
  • Type Outlook
    • Shallow water
    • Deep water
    • Ultra deep water
  • Region Outlook
    • North America
      • The U.S.
      • Canada
    • Europe
      • The U.K.
      • Germany
      • France
      • Rest of Europe
    • APAC
      • China
      • India
    • Middle East & Africa
      • Saudi Arabia
      • South Africa
      • Rest of the Middle East & Africa
    • South America
      • Chile
      • Brazil
      • Argentina

Market Analyst Overview

In the SURF industry, subsea umbilicals, risers, and flowlines (SURF) are crucial for efficient subsea production systems. These subsea systems facilitate the transportation of unprocessed fluid from deep water explorations to surface processing systems. The industry, characterized by capital intensive techniques, involves managing unconventional sources and unexplored subsea reserves in areas like the southern Barents Sea. FPSO units and riser pipelines play vital roles in oil and gas exploration and offshore environments. Oil and gas automation and oilfield service automation enhance drilling efficiencies and new build capital expenditure. Electric power and telecommunications are critical for the Umbilical Termination Structure (UTS) and overall subsea production systems (SPS). Environmental conditions, climate change, and geopolitical influence affect the economic impact and supply chain. Companies like SkyQuest leverage risk analysis and competitive rivalry to navigate legal scenarios, demographic changes, and trade & economic policies. Their product portfolio and region coverage are shaped by social & ethnic concerns, total revenue growth, and product launches.

Market Scope

Report Coverage

Details

Page number

182

Base year

2023

Historic period

2018 - 2022

Forecast period

2024-2028

Growth momentum & CAGR

Accelerate at a CAGR of 9.53%

Market growth 2024-2028

USD 4.9 billion

Market structure

Fragmented

YoY growth 2023-2024(%)

8.24

Regional analysis

APAC, Europe, North America, Middle East and Africa, and South America

Performing market contribution

APAC at 35%

Key countries

China, US, Russia, United Arab Emirates, and Canada

Competitive landscape

Leading Companies, Market Positioning of Companies, Competitive Strategies, and Industry Risks

Key companies profiled

ABB Ltd., Aker Solutions ASA, ArcelorMittal SA, Baker Hughes Co., Bureau Veritas SA, Dril Quip Inc., FIRST Exploration and Petroleum Development Co. Ltd., Havfram, Kongsberg Gruppen ASA, McDermott International Ltd., Nexans SA, NOV Inc., Oceaneering International Inc., Parker Hannifin Corp., Prysmian Spa, Saipem S.p.A., Schlumberger Ltd., Subsea 7 SA, TechnipFMC plc, and Vallourec SA

Market dynamics

Parent market analysis, Market forecasting growth inducers and obstacles, Fast-growing and slow-growing segment analysis, Market growth and Forecasting, COVID-19 impact and recovery analysis and future consumer dynamics, Market condition analysis for forecast period

Customization purview

If our market report has not included the data that you are looking for, you can reach out to our analysts and get segments customized.

View the PDF sample

What are the Key Data Covered in this Market Forecast Report?

  • CAGR of the market during the forecast period
  • Detailed information on factors that will drive the market growth and forecasting of the market between 2024 and 2028
  • Precise estimation of the market size and its contribution to the parent market
  • Accurate predictions about upcoming market trends and analysis and changes in consumer behavior
  • Growth of the market across Europe, North America, APAC, South America, and Middle East and Africa
  • Thorough market growth analysis of the market's competitive landscape and detailed information about companies
  • Comprehensive market analysis and report on the factors that will challenge the market research and growth of market companies.

We can help! Our analysts can customize this market research report to meet your requirements. Get in touch

1 Executive Summary

  • 1.1 Market overview
    • Executive Summary - Chart on Market Overview
    • Executive Summary - Data Table on Market Overview
    • Executive Summary - Chart on Global Market Characteristics
    • Executive Summary - Chart on Market by Geography
    • Executive Summary - Chart on Market Segmentation by Product
    • Executive Summary - Chart on Market Segmentation by Type
    • Executive Summary - Chart on Incremental Growth
    • Executive Summary - Data Table on Incremental Growth
    • Executive Summary - Chart on Company Market Positioning

2 Market Landscape

  • 2.1 Market ecosystem
    • Parent Market
    • Data Table on - Parent Market
  • 2.2 Market characteristics
    • Market characteristics analysis
  • 2.3 Value chain analysis
    • Value Chain Analysis

3 Market Sizing

  • 3.1 Market definition
    • Offerings of companies included in the market definition
  • 3.2 Market segment analysis
    • Market segments
  • 3.3 Market size 2023
    • 3.4 Market outlook: Forecast for 2023-2028
      • Chart on Global - Market size and forecast 2023-2028 ($ billion)
      • Data Table on Global - Market size and forecast 2023-2028 ($ billion)
      • Chart on Global Market: Year-over-year growth 2023-2028 (%)
      • Data Table on Global Market: Year-over-year growth 2023-2028 (%)

    4 Historic Market Size

    • 4.1 Global Subsea Umbilicals, Risers, And Flow Lines (Surf) Market 2018 - 2022
      • Historic Market Size - Data Table on Global Subsea Umbilicals, Risers, And Flow Lines (Surf) Market 2018 - 2022 ($ billion)
    • 4.2 Product segment analysis 2018 - 2022
      • Historic Market Size - Product Segment 2018 - 2022 ($ billion)
    • 4.3 Type segment analysis 2018 - 2022
      • Historic Market Size - Type Segment 2018 - 2022 ($ billion)
    • 4.4 Geography segment analysis 2018 - 2022
      • Historic Market Size - Geography Segment 2018 - 2022 ($ billion)
    • 4.5 Country segment analysis 2018 - 2022
      • Historic Market Size - Country Segment 2018 - 2022 ($ billion)

    5 Five Forces Analysis

    • 5.1 Five forces summary
      • Five forces analysis - Comparison between 2023 and 2028
    • 5.2 Bargaining power of buyers
      • Bargaining power of buyers - Impact of key factors 2023 and 2028
    • 5.3 Bargaining power of suppliers
      • Bargaining power of suppliers - Impact of key factors in 2023 and 2028
    • 5.4 Threat of new entrants
      • Threat of new entrants - Impact of key factors in 2023 and 2028
    • 5.5 Threat of substitutes
      • Threat of substitutes - Impact of key factors in 2023 and 2028
    • 5.6 Threat of rivalry
      • Threat of rivalry - Impact of key factors in 2023 and 2028
    • 5.7 Market condition
      • Chart on Market condition - Five forces 2023 and 2028

    6 Market Segmentation by Product

    • 6.1 Market segments
      • Chart on Product - Market share 2023-2028 (%)
      • Data Table on Product - Market share 2023-2028 (%)
    • 6.2 Comparison by Product
      • Chart on Comparison by Product
      • Data Table on Comparison by Product
    • 6.3 Flowlines - Market size and forecast 2023-2028
      • Chart on Flowlines - Market size and forecast 2023-2028 ($ billion)
      • Data Table on Flowlines - Market size and forecast 2023-2028 ($ billion)
      • Chart on Flowlines - Year-over-year growth 2023-2028 (%)
      • Data Table on Flowlines - Year-over-year growth 2023-2028 (%)
    • 6.4 Umbilicals - Market size and forecast 2023-2028
      • Chart on Umbilicals - Market size and forecast 2023-2028 ($ billion)
      • Data Table on Umbilicals - Market size and forecast 2023-2028 ($ billion)
      • Chart on Umbilicals - Year-over-year growth 2023-2028 (%)
      • Data Table on Umbilicals - Year-over-year growth 2023-2028 (%)
    • 6.5 Risers - Market size and forecast 2023-2028
      • Chart on Risers - Market size and forecast 2023-2028 ($ billion)
      • Data Table on Risers - Market size and forecast 2023-2028 ($ billion)
      • Chart on Risers - Year-over-year growth 2023-2028 (%)
      • Data Table on Risers - Year-over-year growth 2023-2028 (%)
    • 6.6 Market opportunity by Product
      • Market opportunity by Product ($ billion)
      • Data Table on Market opportunity by Product ($ billion)

    7 Market Segmentation by Type

    • 7.1 Market segments
      • Chart on Type - Market share 2023-2028 (%)
      • Data Table on Type - Market share 2023-2028 (%)
    • 7.2 Comparison by Type
      • Chart on Comparison by Type
      • Data Table on Comparison by Type
    • 7.3 Shallow water - Market size and forecast 2023-2028
      • Chart on Shallow water - Market size and forecast 2023-2028 ($ billion)
      • Data Table on Shallow water - Market size and forecast 2023-2028 ($ billion)
      • Chart on Shallow water - Year-over-year growth 2023-2028 (%)
      • Data Table on Shallow water - Year-over-year growth 2023-2028 (%)
    • 7.4 Deep water - Market size and forecast 2023-2028
      • Chart on Deep water - Market size and forecast 2023-2028 ($ billion)
      • Data Table on Deep water - Market size and forecast 2023-2028 ($ billion)
      • Chart on Deep water - Year-over-year growth 2023-2028 (%)
      • Data Table on Deep water - Year-over-year growth 2023-2028 (%)
    • 7.5 Ultra deep water - Market size and forecast 2023-2028
      • Chart on Ultra deep water - Market size and forecast 2023-2028 ($ billion)
      • Data Table on Ultra deep water - Market size and forecast 2023-2028 ($ billion)
      • Chart on Ultra deep water - Year-over-year growth 2023-2028 (%)
      • Data Table on Ultra deep water - Year-over-year growth 2023-2028 (%)
    • 7.6 Market opportunity by Type
      • Market opportunity by Type ($ billion)
      • Data Table on Market opportunity by Type ($ billion)

    8 Customer Landscape

    • 8.1 Customer landscape overview
      • Analysis of price sensitivity, lifecycle, customer purchase basket, adoption rates, and purchase criteria

    9 Geographic Landscape

    • 9.1 Geographic segmentation
      • Chart on Market share by geography 2023-2028 (%)
      • Data Table on Market share by geography 2023-2028 (%)
    • 9.2 Geographic comparison
      • Chart on Geographic comparison
      • Data Table on Geographic comparison
    • 9.3 APAC - Market size and forecast 2023-2028
      • Chart on APAC - Market size and forecast 2023-2028 ($ billion)
      • Data Table on APAC - Market size and forecast 2023-2028 ($ billion)
      • Chart on APAC - Year-over-year growth 2023-2028 (%)
      • Data Table on APAC - Year-over-year growth 2023-2028 (%)
    • 9.4 Europe - Market size and forecast 2023-2028
      • Chart on Europe - Market size and forecast 2023-2028 ($ billion)
      • Data Table on Europe - Market size and forecast 2023-2028 ($ billion)
      • Chart on Europe - Year-over-year growth 2023-2028 (%)
      • Data Table on Europe - Year-over-year growth 2023-2028 (%)
    • 9.5 North America - Market size and forecast 2023-2028
      • Chart on North America - Market size and forecast 2023-2028 ($ billion)
      • Data Table on North America - Market size and forecast 2023-2028 ($ billion)
      • Chart on North America - Year-over-year growth 2023-2028 (%)
      • Data Table on North America - Year-over-year growth 2023-2028 (%)
    • 9.6 Middle East and Africa - Market size and forecast 2023-2028
      • Chart on Middle East and Africa - Market size and forecast 2023-2028 ($ billion)
      • Data Table on Middle East and Africa - Market size and forecast 2023-2028 ($ billion)
      • Chart on Middle East and Africa - Year-over-year growth 2023-2028 (%)
      • Data Table on Middle East and Africa - Year-over-year growth 2023-2028 (%)
    • 9.7 South America - Market size and forecast 2023-2028
      • Chart on South America - Market size and forecast 2023-2028 ($ billion)
      • Data Table on South America - Market size and forecast 2023-2028 ($ billion)
      • Chart on South America - Year-over-year growth 2023-2028 (%)
      • Data Table on South America - Year-over-year growth 2023-2028 (%)
    • 9.8 China - Market size and forecast 2023-2028
      • Chart on China - Market size and forecast 2023-2028 ($ billion)
      • Data Table on China - Market size and forecast 2023-2028 ($ billion)
      • Chart on China - Year-over-year growth 2023-2028 (%)
      • Data Table on China - Year-over-year growth 2023-2028 (%)
    • 9.9 US - Market size and forecast 2023-2028
      • Chart on US - Market size and forecast 2023-2028 ($ billion)
      • Data Table on US - Market size and forecast 2023-2028 ($ billion)
      • Chart on US - Year-over-year growth 2023-2028 (%)
      • Data Table on US - Year-over-year growth 2023-2028 (%)
    • 9.10 Russia - Market size and forecast 2023-2028
      • Chart on Russia - Market size and forecast 2023-2028 ($ billion)
      • Data Table on Russia - Market size and forecast 2023-2028 ($ billion)
      • Chart on Russia - Year-over-year growth 2023-2028 (%)
      • Data Table on Russia - Year-over-year growth 2023-2028 (%)
    • 9.11 United Arab Emirates - Market size and forecast 2023-2028
      • Chart on United Arab Emirates - Market size and forecast 2023-2028 ($ billion)
      • Data Table on United Arab Emirates - Market size and forecast 2023-2028 ($ billion)
      • Chart on United Arab Emirates - Year-over-year growth 2023-2028 (%)
      • Data Table on United Arab Emirates - Year-over-year growth 2023-2028 (%)
    • 9.12 Canada - Market size and forecast 2023-2028
      • Chart on Canada - Market size and forecast 2023-2028 ($ billion)
      • Data Table on Canada - Market size and forecast 2023-2028 ($ billion)
      • Chart on Canada - Year-over-year growth 2023-2028 (%)
      • Data Table on Canada - Year-over-year growth 2023-2028 (%)
    • 9.13 Market opportunity by geography
      • Market opportunity by geography ($ billion)
      • Data Tables on Market opportunity by geography ($ billion)

    10 Drivers, Challenges, and Opportunity/Restraints

    • 10.1 Market drivers
      • 10.2 Market challenges
        • 10.3 Impact of drivers and challenges
          • Impact of drivers and challenges in 2023 and 2028
        • 10.4 Market opportunities/restraints

          11 Competitive Landscape

          • 11.1 Overview
            • 11.2 Competitive Landscape
              • Overview on criticality of inputs and factors of differentiation
            • 11.3 Landscape disruption
              • Overview on factors of disruption
            • 11.4 Industry risks
              • Impact of key risks on business

            12 Competitive Analysis

            • 12.1 Companies profiled
              • Companies covered
            • 12.2 Market positioning of companies
              • Matrix on companies position and classification
            • 12.3 ABB Ltd.
              • ABB Ltd. - Overview
              • ABB Ltd. - Business segments
              • ABB Ltd. - Key news
              • ABB Ltd. - Key offerings
              • ABB Ltd. - Segment focus
            • 12.4 Aker Solutions ASA
              • Aker Solutions ASA - Overview
              • Aker Solutions ASA - Business segments
              • Aker Solutions ASA - Key news
              • Aker Solutions ASA - Key offerings
              • Aker Solutions ASA - Segment focus
            • 12.5 ArcelorMittal SA
              • ArcelorMittal SA - Overview
              • ArcelorMittal SA - Business segments
              • ArcelorMittal SA - Key news
              • ArcelorMittal SA - Key offerings
              • ArcelorMittal SA - Segment focus
            • 12.6 Baker Hughes Co.
              • Baker Hughes Co. - Overview
              • Baker Hughes Co. - Business segments
              • Baker Hughes Co. - Key news
              • Baker Hughes Co. - Key offerings
              • Baker Hughes Co. - Segment focus
            • 12.7 Dril Quip Inc.
              • Dril Quip Inc. - Overview
              • Dril Quip Inc. - Business segments
              • Dril Quip Inc. - Key news
              • Dril Quip Inc. - Key offerings
              • Dril Quip Inc. - Segment focus
            • 12.8 Havfram
              • Havfram - Overview
              • Havfram - Product / Service
              • Havfram - Key offerings
            • 12.9 Kongsberg Gruppen ASA
              • Kongsberg Gruppen ASA - Overview
              • Kongsberg Gruppen ASA - Business segments
              • Kongsberg Gruppen ASA - Key news
              • Kongsberg Gruppen ASA - Key offerings
              • Kongsberg Gruppen ASA - Segment focus
            • 12.10 McDermott International Ltd.
              • McDermott International Ltd. - Overview
              • McDermott International Ltd. - Product / Service
              • McDermott International Ltd. - Key offerings
            • 12.11 Nexans SA
              • Nexans SA - Overview
              • Nexans SA - Business segments
              • Nexans SA - Key news
              • Nexans SA - Key offerings
              • Nexans SA - Segment focus
            • 12.12 NOV Inc.
              • NOV Inc. - Overview
              • NOV Inc. - Business segments
              • NOV Inc. - Key news
              • NOV Inc. - Key offerings
              • NOV Inc. - Segment focus
            • 12.13 Oceaneering International Inc.
              • Oceaneering International Inc. - Overview
              • Oceaneering International Inc. - Product / Service
              • Oceaneering International Inc. - Key offerings
            • 12.14 Prysmian Spa
              • Prysmian Spa - Overview
              • Prysmian Spa - Business segments
              • Prysmian Spa - Key news
              • Prysmian Spa - Key offerings
              • Prysmian Spa - Segment focus
            • 12.15 Saipem S.p.A.
              • Saipem S.p.A. - Overview
              • Saipem S.p.A. - Business segments
              • Saipem S.p.A. - Key offerings
              • Saipem S.p.A. - Segment focus
            • 12.16 Schlumberger Ltd.
              • Schlumberger Ltd. - Overview
              • Schlumberger Ltd. - Business segments
              • Schlumberger Ltd. - Key news
              • Schlumberger Ltd. - Key offerings
              • Schlumberger Ltd. - Segment focus
            • 12.17 TechnipFMC plc
              • TechnipFMC plc - Overview
              • TechnipFMC plc - Business segments
              • TechnipFMC plc - Key news
              • TechnipFMC plc - Key offerings
              • TechnipFMC plc - Segment focus

            13 Appendix

            • 13.1 Scope of the report
              • 13.2 Inclusions and exclusions checklist
                • Inclusions checklist
                • Exclusions checklist
              • 13.3 Currency conversion rates for US$
                • Currency conversion rates for US$
              • 13.4 Research methodology
                • Research methodology
              • 13.5 Data procurement
                • Information sources
              • 13.6 Data validation
                • Data validation
              • 13.7 Validation techniques employed for market sizing
                • Validation techniques employed for market sizing
              • 13.8 Data synthesis
                • Data synthesis
              • 13.9 360 degree market analysis
                • 360 degree market analysis
              • 13.10 List of abbreviations
                • List of abbreviations

              Research Methodology

              Technavio presents a detailed picture of the market by way of study, synthesis, and summation of data from multiple sources. The analysts have presented the various facets of the market with a particular focus on identifying the key industry influencers. The data thus presented is comprehensive, reliable, and the result of extensive research, both primary and secondary.

              INFORMATION SOURCES

              Primary sources

              • Manufacturers and suppliers
              • Channel partners
              • Industry experts
              • Strategic decision makers

              Secondary sources

              • Industry journals and periodicals
              • Government data
              • Financial reports of key industry players
              • Historical data
              • Press releases

              DATA ANALYSIS

              Data Synthesis

              • Collation of data
              • Estimation of key figures
              • Analysis of derived insights

              Data Validation

              • Triangulation with data models
              • Reference against proprietary databases
              • Corroboration with industry experts

              REPORT WRITING

              Qualitative

              • Market drivers
              • Market challenges
              • Market trends
              • Five forces analysis

              Quantitative

              • Market size and forecast
              • Market segmentation
              • Geographical insights
              • Competitive landscape

              Interested in this report?

              Get your sample now to see our research methodology and insights!

              Download Now

              Frequently Asked Questions

              Subsea Umbilicals, Risers, And Flow Lines (Surf) market growth will increase by $ 4.9 bn during 2024-2028.

              The Subsea Umbilicals, Risers, And Flow Lines (Surf) market is expected to grow at a CAGR of 9.53% during 2024-2028.

              Subsea Umbilicals, Risers, And Flow Lines (Surf) market is segmented by Product( Flowlines, Umbilicals, Risers) Type( Shallow water, Deep water, Ultra deep water, MEA, South America)

              ABB Ltd., Aker Solutions ASA, ArcelorMittal SA, Baker Hughes Co., Bureau Veritas SA, Dril Quip Inc., FIRST Exploration and Petroleum Development Co. Ltd., Havfram, Kongsberg Gruppen ASA, McDermott International Ltd., Nexans SA, NOV Inc., Oceaneering International Inc., Parker Hannifin Corp., Prysmian Spa, Saipem S.p.A., Schlumberger Ltd., Subsea 7 SA, TechnipFMC plc, Vallourec SA are a few of the key vendors in the Subsea Umbilicals, Risers, And Flow Lines (Surf) market.

              APAC will register the highest growth rate of 35% among the other regions. Therefore, the Subsea Umbilicals, Risers, And Flow Lines (Surf) market in APAC is expected to garner significant business opportunities for the vendors during the forecast period.

              China, US, Russia, United Arab Emirates, Canada

              • Rise in new exploration policiesIn a move to attract companies to explore oil and gas fields is the driving factor this market.
              • countries such as India is the driving factor this market.
              • Brazil is the driving factor this market.
              • and Israel is the driving factor this market.
              • have made noteworthy changes to their existing oil and gas exploration policies. To encourage the influx of investments in the oil and gas industry is the driving factor this market.
              • the federal government of Brazil announced a change in its policies. The existing Brazilian policy requires several goods and services produced in the country to be hired or contracted. In some cases is the driving factor this market.
              • over 90% of rigs is the driving factor this market.
              • machines is the driving factor this market.
              • and services used by the industry had to be acquired in Brazil. Companies failing to comply with these laws were penalized. However is the driving factor this market.
              • according to the new policy is the driving factor this market.
              • the minimum local content requirement has been significantly reduced is the driving factor this market.
              • which now stands at 50% for exploration and onshore development. For offshore development projects of over 100 meters depth is the driving factor this market.
              • local content should be 18% for exploration is the driving factor this market.
              • 25% for good construction is the driving factor this market.
              • and 40% for collection and disposal systems. Since the new percentages are significantly lower than the older ones is the driving factor this market.
              • it becomes easy for oil and gas companies to operate in the country. A similar move is in plans in India is the driving factor this market.
              • which has delayed the country's New Exploration Licensing Policy (NELP) - X round is the driving factor this market.
              • modified the existing exploration policy and introduced the Hydrocarbon Exploration and Licensing Policy (HELP) in March 2016. Under this policy numerous changes have been made to existing policies. A single license for conventional and unconventional hydrocarbon exploration is the driving factor this market.
              • a decrease in royalty values is the driving factor this market.
              • and a change in fiscal regime to revenue-sharing contracts are a few of the major changes. HELP is still in the formulation stage and is expected to be rolled out shortly. These policy changes are anticipated to attract new investments from global players and drive the global SURF market. To attract E and P companies to explore their oil and gas fields is the driving factor this market.
              • nations such as Brazil is the driving factor this market.
              • India is the driving factor this market.
              • and Israel have made significant changes to their oil and gas exploration policies. To encourage investments in the oil and gas industry is the driving factor this market.
              • many countries have amended their exploration policies. For instance is the driving factor this market.
              • in India is the driving factor this market.
              • in 2018 is the driving factor this market.
              • the previous New Exploration Licensing Policy (NELP) was changed to the Hydrocarbon Exploration and Licensing Policy (HELP) is the driving factor this market.
              • which promises marketing freedom and pricing according to the goal of 10% less reliance on hydrocarbon imports. Similarly is the driving factor this market.
              • six new mining possibilities from Saudi Arabia were presented at the Future Minerals Forum 2023 (FMF 2023) held from January 10 to January 12 at the King Abdulaziz International Conference Center in Riyadh. The HELP brought the open acreage licensing policy is the driving factor this market.
              • which offers freedom for oil and gas exploration companies to choose the areas they want to explore. Such factors are expected to drive the growth of the global SURF market during the forecast period. is the driving factor this market.

              The Subsea Umbilicals, Risers, And Flow Lines (Surf) market vendors should focus on grabbing business opportunities from the Flowlines segment as it accounted for the largest market share in the base year.