Sustainable Animal Nutrition And Feed Additives Market Size and Growth Forecast 2026-2030
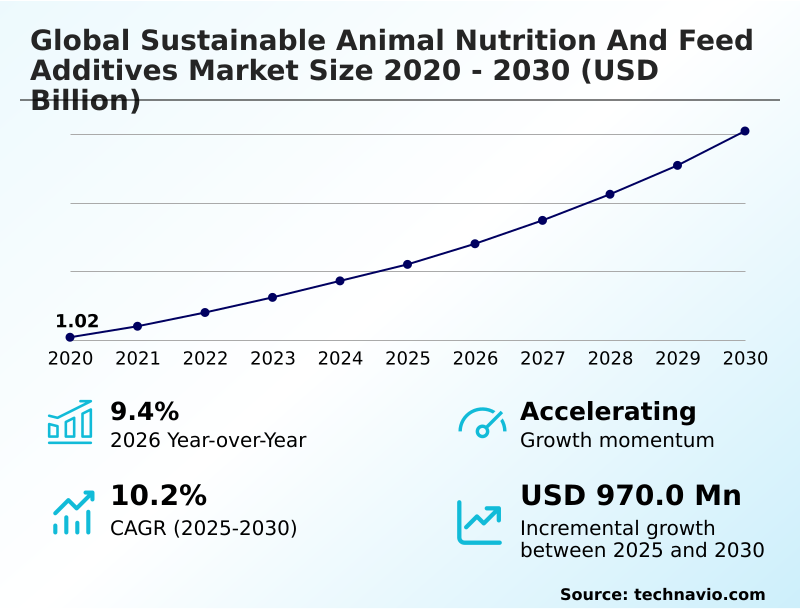
The Sustainable Animal Nutrition And Feed Additives Market size was valued at USD 1.55 billion in 2025 growing at a CAGR of 10.2% during the forecast period 2026-2030.
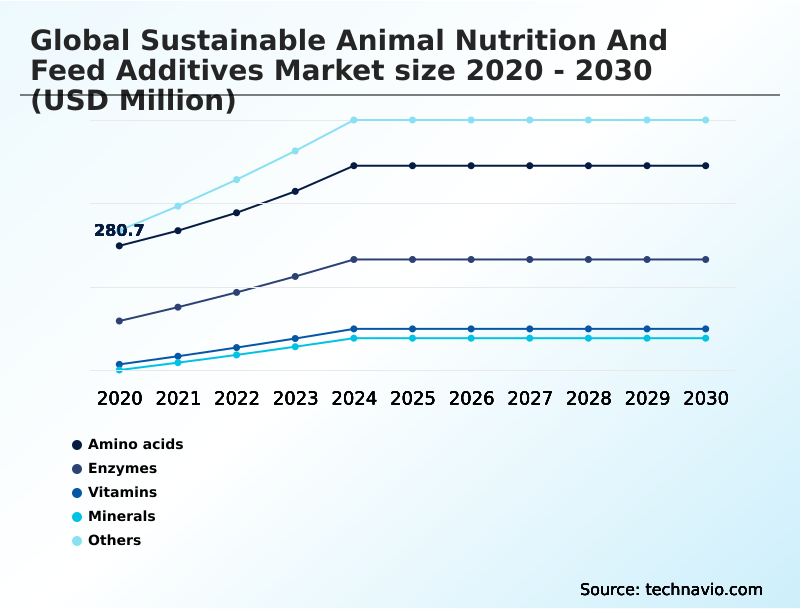
APAC accounts for 42.6% of incremental growth during the forecast period. The Amino acids segment by Product was valued at USD 383.2 million in 2024, while the Poultry segment holds the largest revenue share by Application.
The market is projected to grow by USD 1.51 billion from 2020 to 2030, with USD 970 million of the growth expected during the forecast period of 2025 to 2030.
Get Key Insights on Market Forecast (PDF) Request Free Sample
Sustainable Animal Nutrition And Feed Additives Market Overview
The sustainable animal nutrition and feed additives market is defined by a critical need to enhance livestock efficiency while meeting stringent environmental targets. A primary focus is enteric methane mitigation, with innovations in rumen fermentation modifiers gaining prominence. This shift is complemented by the integration of precision livestock farming, which optimizes feed conversion ratios and supports antibiotic-free production. For instance, a large-scale swine facility implementing precision feeding systems with encapsulated feed additives and gut microbiome stabilizers can reduce nitrogen excretion by over 20%, ensuring compliance with EPA nutrient management regulations while improving herd health. This data-driven sustainability, fueled by advanced nutritional interventions, is becoming a prerequisite for market access, especially as the industry moves toward a circular feed economy. The market's 9.4% year-over-year growth reflects the escalating demand for solutions that reconcile high-yield protein production with ecological responsibility.
Drivers, Trends, and Challenges in the Sustainable Animal Nutrition And Feed Additives Market
The global sustainable animal nutrition and feed additives market is evolving beyond simple nutrient supply to become a critical tool for environmental compliance and operational efficiency. The cost-benefit analysis of phytogenic feed additives is now a central part of procurement decisions, driven by their potential to support antibiotic-free production.
Concurrently, the role of enzymes in the circular feed economy is expanding, enabling the use of diverse food industry co-products and reducing reliance on traditional grains. However, this trend introduces technical challenges in upcycled feed ingredient safety, demanding rigorous quality control to mitigate risks like mycotoxins.
The impact of precision nutrition on livestock emissions is significant; for example, a dairy cooperative deploying a methane-reduction program under the EU's Common Agricultural Policy might use 3-nitrooxypropanol and digital tracking to verify a 30% cut in enteric methane, a figure substantially higher than reductions seen from basic dietary adjustments.
Navigating the complex regulatory pathways for methane-reducing feed additives remains a hurdle, yet the effectiveness of probiotics in antibiotic-free swine production demonstrates the viability of these advanced nutritional strategies in achieving both economic and ecological goals.
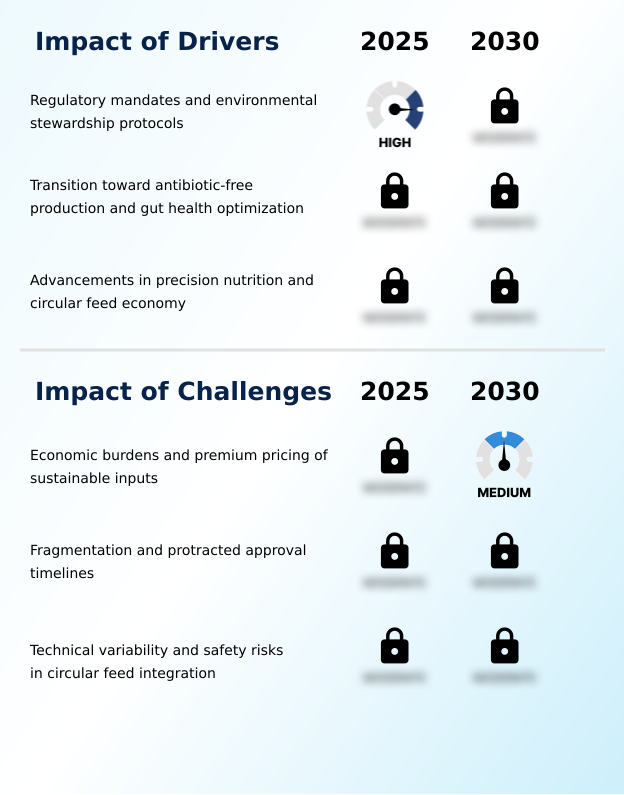
Primary Growth Driver: Regulatory mandates and environmental stewardship protocols are key drivers of the market, compelling the adoption of sustainable nutritional solutions.
Market expansion is heavily driven by stringent environmental stewardship protocols, particularly in regions like Europe under the Farm to Fork strategy, which mandate reductions in nitrogen and phosphorus runoff. This creates strong demand for nutrient bioavailability enhancers and specialized enzymes.
Simultaneously, the global movement toward antibiotic-free production, propelled by antimicrobial resistance concerns, has accelerated the uptake of gut microbiome stabilizers and phytogenic feed additives.
A third major driver is the integration of digital technologies for data-driven sustainability, allowing for optimized feed formulations and waste reduction.
With APAC contributing 42.6% of incremental growth, these drivers are crucial for modernizing livestock operations on a global scale to meet both production targets and sustainability goals.
Emerging Market Trend: The adoption of artificial intelligence and precision feeding systems represents a significant upcoming trend in the market. This shift enables data-driven nutritional management for optimized livestock performance and resource efficiency.
Key trends are reshaping production, led by the diversification into alternative protein sources like insect meal and single-cell protein sources, which lessens reliance on traditional soy and fishmeal. This supports the move toward a circular feed economy, addressing both resource scarcity and consumer demand for transparent sourcing.
The adoption of precision livestock farming, using AI and IoT to monitor biological growth curves, allows for the precise delivery of nutrients, significantly improving the feed conversion ratio. In ruminants, the strategic focus on enteric methane mitigation through additives like 3-nitrooxypropanol is intensifying, driven by the need to reduce the sector's greenhouse gas intensity.
These trends collectively push the industry toward more efficient, transparent, and environmentally responsible practices.
Key Industry Challenge: Economic burdens and the premium pricing of sustainable inputs represent a key challenge affecting industry growth and adoption rates among producers.
A primary challenge is the high cost of sustainable inputs, with premium pricing for innovations like seaweed-derived compounds and bio-based amino acids creating financial barriers for producers with thin margins.
This economic pressure is compounded by the fragmentation of global regulations, where a lack of a harmonized framework under bodies like the European Food Safety Authority (EFSA) leads to protracted and costly approval timelines for novel additives.
Furthermore, the integration of upcycled protein sources into the circular feed economy introduces technical variability and safety risks, requiring significant investment in quality control to manage inconsistencies and potential contaminants, thereby constraining widespread adoption and impacting the stability of supply chains.
Explore Full Market Dynamics Analysis Request Free Sample
Sustainable Animal Nutrition And Feed Additives Market Segmentation
The sustainable animal nutrition and feed additives industry research report provides comprehensive data including region-wise segment analysis, with forecasts and analysis for the period 2026-2030, as well as historical data from 2020-2024 for the following segments.
Product Segment Analysis
The amino acids segment is estimated to witness significant growth during the forecast period.
The amino acids segment, representing a significant portion of the market, is foundational to sustainable practices.
Strategic application of essential amino acids allows for diets with reduced crude protein, which is vital for minimizing nitrogen and phosphorus runoff and helping producers meet standards like the EU Common Agricultural Policy.
This approach, supported by nutrient bioavailability enhancers, facilitates a move away from carbon-intensive protein sources. By using bio-based amino acids, producers can precisely match dietary intake to livestock needs, optimizing growth while reducing the ecological footprint.
This shift toward fermentation technologies to produce these vital nutrients not only improves the efficacy of antibiotic-free production but also aligns with the broader goals of a circular feed economy.
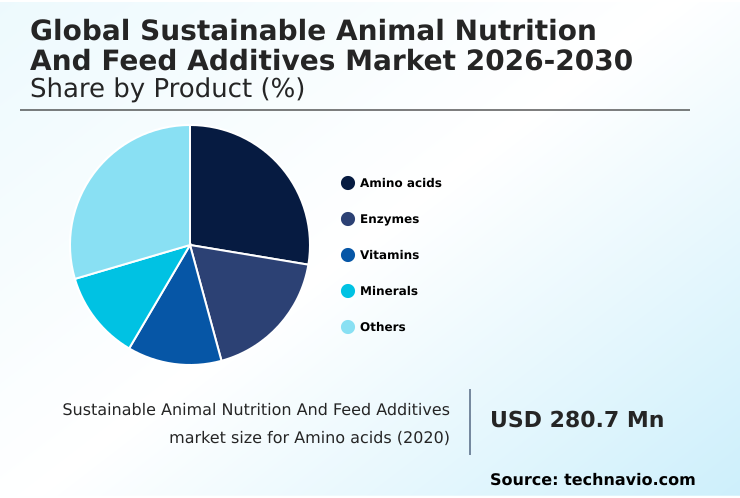
The Amino acids segment was valued at USD 383.2 million in 2024 and showed a gradual increase during the forecast period.
Sustainable Animal Nutrition And Feed Additives Market by Region: APAC Leads with 42.6% Growth Share
APAC is estimated to contribute 42.6% to the growth of the global market during the forecast period.
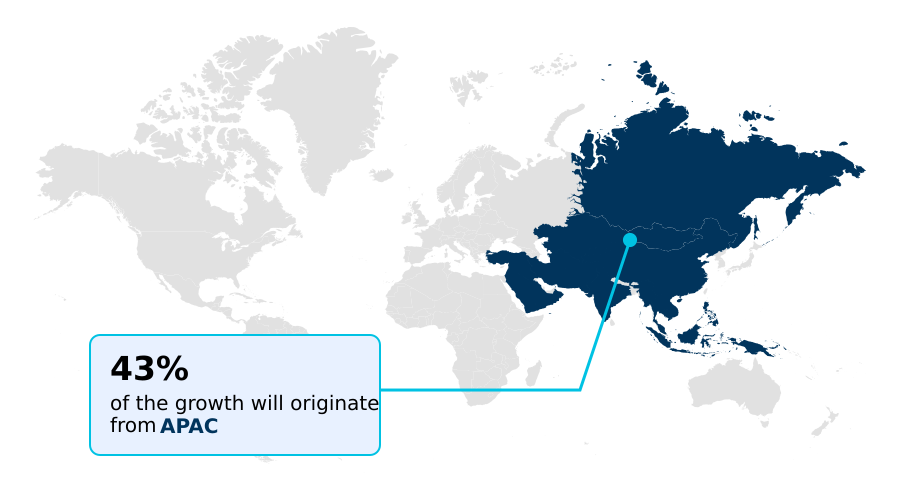
The geographic landscape is led by APAC, which accounts for 42.6% of the market's incremental growth, driven by modernization in countries like China and India. The region's focus on food security and scaling up sustainable aquaculture feeds propels demand.
Europe, contributing 23.63% to market growth, operates under strict environmental stewardship protocols, mandating advanced nutritional interventions to manage nitrogen and phosphorus runoff.
In North America, which holds a 22.02% share of the opportunity, the adoption of data-driven sustainability and precision livestock farming is widespread, with a focus on optimizing the feed conversion ratio.
These regional priorities highlight a global trend toward reconciling livestock productivity with environmental accountability through specialized additives.
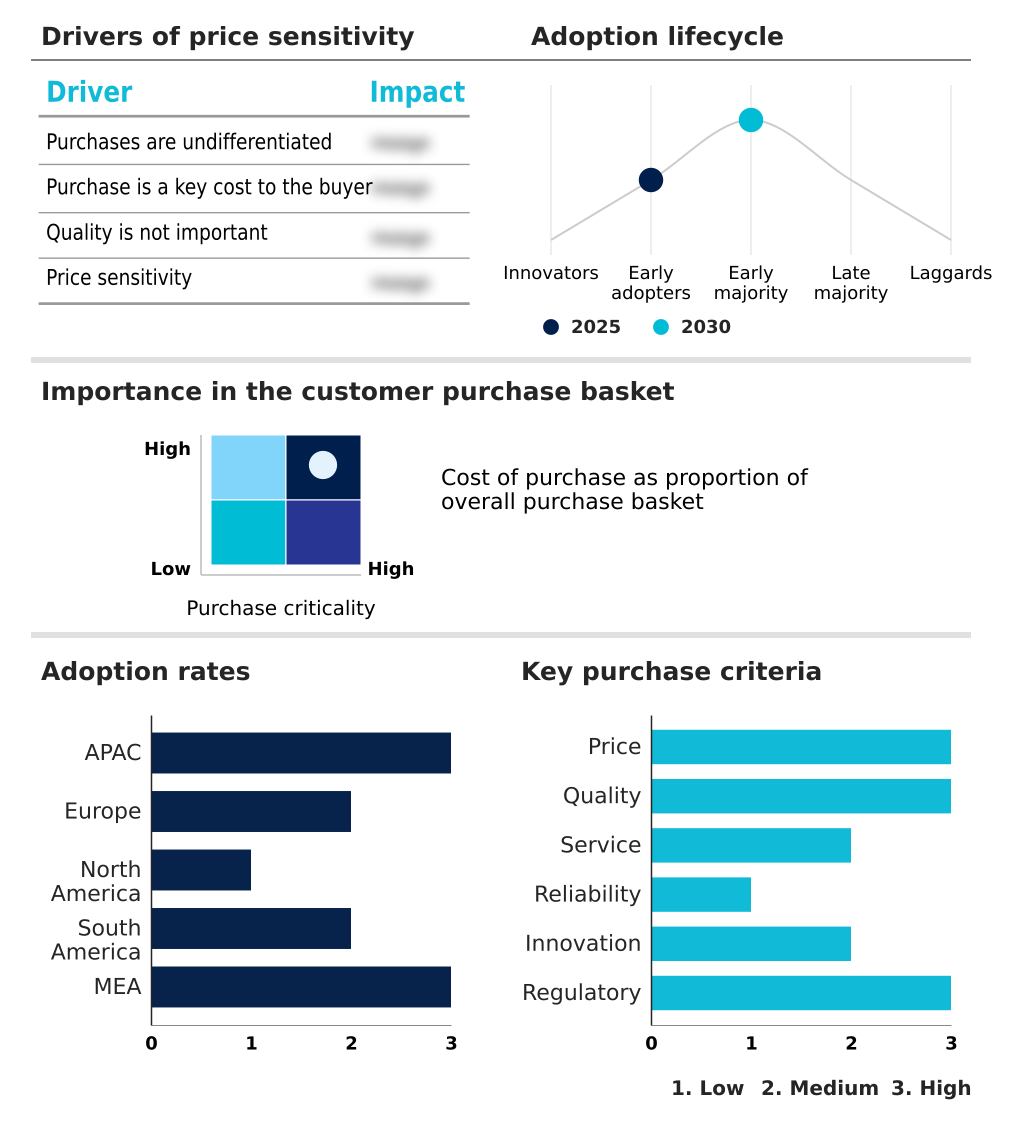
Customer Landscape Analysis for the Sustainable Animal Nutrition And Feed Additives Market
The sustainable animal nutrition and feed additives market forecasting report includes the adoption lifecycle of the market, covering from the innovator’s stage to the laggard’s stage. It focuses on adoption rates in different regions based on penetration. Furthermore, the sustainable animal nutrition and feed additives market report also includes key purchase criteria and drivers of price sensitivity to help companies evaluate and develop their market growth analysis strategies.
Competitive Landscape of the Sustainable Animal Nutrition And Feed Additives Market
Companies are implementing various strategies, such as strategic alliances, partnerships, mergers and acquisitions, geographical expansion, and product/service launches, to enhance their presence in the sustainable animal nutrition and feed additives market industry.
AB Agri Ltd. - Offers sustainable animal nutrition solutions, including compound feed and nutritional premixes, designed to enhance livestock and poultry production efficiency.
The industry research and growth report includes detailed analyses of the competitive landscape of the market and information about key companies, including:
- AB Agri Ltd.
- Adisseo France SAS
- Alltech Inc.
- Archer Daniels Midland Co.
- Berg Schmidt Animal Nutrition GmbH
- Cargill Inc.
- De Heus Voeders BV
- DSM Firmenich AG
- Elanco Animal Health Inc.
- Evonik Industries AG
- International Flavors Inc.
- Kemin Industries Inc.
- Lallemand Inc.
- Novonesis Group
- Novus International Inc.
- Nuscience Belgium NV
- Nutreco N.V.
- Phibro Animal Health Corp.
- Phytobiotics Futterzusatzstoffe GmbH
- Zinpro Corp.
Qualitative and quantitative analysis of companies has been conducted to help clients understand the wider business environment as well as the strengths and weaknesses of key industry players. Data is qualitatively analyzed to categorize companies as pure play, category-focused, industry-focused, and diversified; it is quantitatively analyzed to categorize companies as dominant, leading, strong, tentative, and weak.
Recent Developments in the Sustainable Animal Nutrition And Feed Additives Market
- In May 2025, Cargill introduced a cloud-based nutrition management platform that utilizes predictive analytics to synchronize feed additive inclusion rates with the biological growth curves of broiler chickens, aiming for environmental and economic gains.
- In September 2025, ADM announced the completion of a large-scale facility expansion for producing high-performance insect proteins intended for use in sustainable aquaculture feeds, underscoring the commercialization of alternative proteins.
- In October 2025, dsm-firmenich entered a strategic partnership with a global dairy cooperative to deploy a methane-reduction program using advanced feed supplements and digital tools to certify the milk's carbon footprint.
- In June 2025, the Ministry of Agriculture in Brazil implemented a nationwide ban on several classes of antimicrobial growth promoters in the poultry and swine sectors to align with international food safety standards.
Research Analyst Overview: Sustainable Animal Nutrition And Feed Additives Market
A definitive shift away from antibiotic growth promoters is compelling a strategic pivot in R&D investment, directly influencing boardroom decisions on capital allocation. The market's 9.4% year-over-year growth is not just from volume but from the higher value of innovative solutions like phytogenic feed additives and microbial feed supplements.
A key boardroom consideration is whether to fund internal development of mycotoxin detoxifiers or acquire a biotech startup with patented rumen fermentation modifiers for enteric methane mitigation. This decision is intensified by regulatory pressures, such as the Global Trade Organization's carbon-adjustment tariff, which penalizes high-footprint inputs.
Consequently, investments in bio-based amino acids and phytase enzyme technology are no longer just for performance but are critical for risk management and securing market access. The focus is on creating a portfolio of encapsulated feed additives and synbiotic feed solutions that deliver measurable sustainability outcomes, ensuring resilience against future compliance demands and supply chain disruptions.
Dive into Technavio’s robust research methodology, blending expert interviews, extensive data synthesis, and validated models for unparalleled Sustainable Animal Nutrition And Feed Additives Market insights. See full methodology.
| Market Scope | |
|---|---|
| Page number | 316 |
| Base year | 2025 |
| Historic period | 2020-2024 |
| Forecast period | 2026-2030 |
| Growth momentum & CAGR | Accelerate at a CAGR of 10.2% |
| Market growth 2026-2030 | USD 970.0 million |
| Market structure | Fragmented |
| YoY growth 2025-2026(%) | 9.4% |
| Key countries | China, India, Japan, Vietnam, Australia, Thailand, Germany, Spain, France, The Netherlands, Italy, UK, US, Canada, Mexico, Brazil, Argentina, Chile, South Africa, Saudi Arabia, Egypt, Turkey and UAE |
| Competitive landscape | Leading Companies, Market Positioning of Companies, Competitive Strategies, and Industry Risks |
Sustainable Animal Nutrition And Feed Additives Market: Key Questions Answered in This Report
-
What is the expected growth of the Sustainable Animal Nutrition And Feed Additives Market between 2026 and 2030?
-
The Sustainable Animal Nutrition And Feed Additives Market is expected to grow by USD 970 million during 2026-2030, registering a CAGR of 10.2%. Year-over-year growth in 2026 is estimated at 9.4%%. This acceleration is shaped by regulatory mandates and environmental stewardship protocols, which is intensifying demand across multiple end-use verticals covered in the report.
-
-
What segmentation does the market report cover?
-
The report is segmented by Product (Amino acids, Enzymes, Vitamins, Minerals, and Others), Application (Poultry, Swine, Ruminants, Aquaculture, and Others), Form Factor (Dry, and Liquid) and Geography (APAC, Europe, North America, South America, Middle East and Africa). Among these, the Amino acids segment is estimated to witness significant growth during the forecast period, driven by rising adoption across key application areas. Each segment includes detailed qualitative and quantitative analysis, along with historical data from 2020-2024 and forecasts through 2030 with year-over-year growth rates.
-
-
Which regions are analyzed in the report?
-
The report covers APAC, Europe, North America, South America and Middle East and Africa. APAC is estimated to contribute 42.6% to market growth during the forecast period. Country-level analysis includes China, India, Japan, Vietnam, Australia, Thailand, Germany, Spain, France, The Netherlands, Italy, UK, US, Canada, Mexico, Brazil, Argentina, Chile, South Africa, Saudi Arabia, Egypt, Turkey and UAE, with dedicated market size tables and year-over-year growth for each.
-
-
What are the key growth drivers and market challenges?
-
The primary driver is regulatory mandates and environmental stewardship protocols, which is accelerating investment and industry demand. The main challenge is economic burdens and premium pricing of sustainable inputs, creating operational barriers for key market participants. The report quantifies the impact of each driver and challenge across 2026 and 2030 with comparative analysis.
-
-
Who are the major players in the Sustainable Animal Nutrition And Feed Additives Market?
-
Key vendors include AB Agri Ltd., Adisseo France SAS, Alltech Inc., Archer Daniels Midland Co., Berg Schmidt Animal Nutrition GmbH, Cargill Inc., De Heus Voeders BV, DSM Firmenich AG, Elanco Animal Health Inc., Evonik Industries AG, International Flavors Inc., Kemin Industries Inc., Lallemand Inc., Novonesis Group, Novus International Inc., Nuscience Belgium NV, Nutreco N.V., Phibro Animal Health Corp., Phytobiotics Futterzusatzstoffe GmbH and Zinpro Corp.. The report provides qualitative and quantitative analysis categorizing companies as dominant, leading, strong, tentative, and weak based on their market positioning. Company profiles include business segment analysis, SWOT assessment, key offerings, and recent strategic developments.
-
Sustainable Animal Nutrition And Feed Additives Market Research Insights
Market dynamics are increasingly shaped by regulatory frameworks such as the EU's Farm to Fork strategy, pushing for a significant reduction in antimicrobial use and promoting animal welfare standards. This accelerates the demand for advanced nutritional interventions that support gut health and immunity, with the poultry application segment commanding a larger market share than swine or ruminants.
The focus on a circular feed economy encourages the use of food industry co-products, requiring sophisticated enzymatic solutions to ensure nutrient consistency. As producers seek to create nutrient-dense food sources, the adoption of data-driven sustainability practices becomes essential for optimizing feed conversion ratio and minimizing environmental impact.
This regulatory and consumer-driven push for transparency is creating a more resilient food system.
We can help! Our analysts can customize this sustainable animal nutrition and feed additives market research report to meet your requirements.
 RIA -
RIA - 
