Sustainable Fashion Certification Services Market Analysis, Size, and Forecast 2026-2030: APAC (China, India, and Japan), Europe (Germany, UK, and France), North America (US, Canada, and Mexico), South America (Brazil, Argentina, and Colombia), Middle East and Africa (Saudi Arabia, UAE, and South Africa), and Rest of World (ROW)

Sustainable Fashion Certification Services Market Analysis, Size, and Forecast 2026-2030:
APAC (China, India, and Japan), Europe (Germany, UK, and France), North America (US, Canada, and Mexico), South America (Brazil, Argentina, and Colombia), Middle East and Africa (Saudi Arabia, UAE, and South Africa), and Rest of World (ROW)

Published: May 2026 308 Pages SKU: IRTNTR81324

Market Overview at a Glance

$454.4 Mn
Market Opportunity
8.1%
CAGR 2025 - 2030
36.1%
APAC Growth
$283.1 Mn
Organic textile certification segment 2024

Sustainable Fashion Certification Services Market Size and Growth Forecast 2026-2030

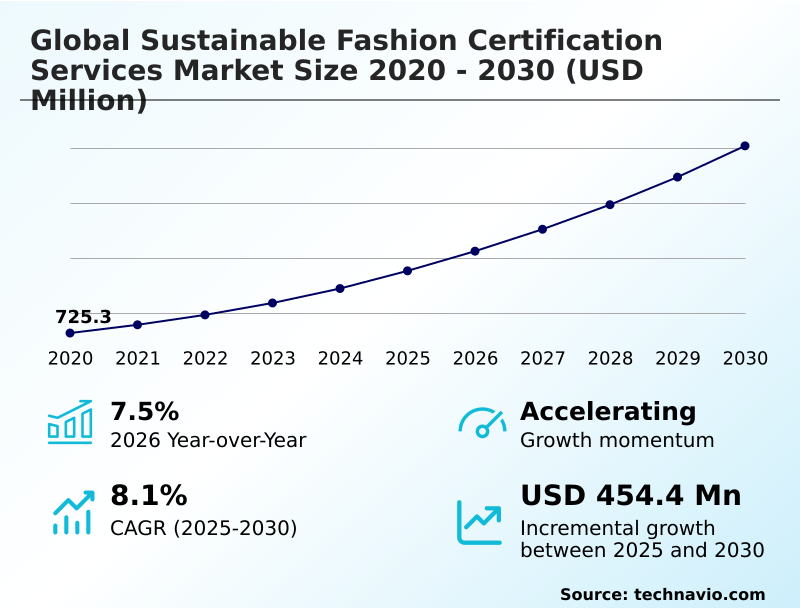
The Sustainable Fashion Certification Services Market size was valued at USD 951.5 million in 2025 growing at a CAGR of 8.1% during the forecast period 2026-2030.

APAC accounts for 36.1% of incremental growth during the forecast period. The Organic textile certification segment by Type was valued at USD 283.1 million in 2024, while the Apparel brands segment holds the largest revenue share by End-user.

The market is projected to grow by USD 680.6 million from 2020 to 2030, with USD 454.4 million of the growth expected during the forecast period of 2025 to 2030.

Get Key Insights on Market Forecast (PDF) Request Free Sample

Sustainable Fashion Certification Services Market Overview

The sustainable fashion certification services market is undergoing significant expansion as regulatory mandates and environmental, social, and governance (ESG) criteria become central to the apparel industry's operations. With APAC poised to contribute over 36% of the market's growth, the focus is on verifying complex global supply chains. Certification bodies provide the critical third-party environmental certification and social compliance auditing that brands need to mitigate greenwashing risks and substantiate claims. For instance, a mid-sized textile manufacturer pursuing B Corp Certification must provide evidence of its closed-loop system, demonstrating verifiable reductions in water usage and a commitment to material traceability. This involves a comprehensive lifecycle assessment (LCA) and chain of custody verification, transforming sustainability from a marketing claim into a quantifiable operational metric. As such, these services are becoming indispensable for securing market access and maintaining brand credibility in an increasingly conscientious marketplace, where factory compliance auditing and material sourcing documentation are standard requirements.

Drivers, Trends, and Challenges in the Sustainable Fashion Certification Services Market

The global sustainable fashion certification services market is shaped by a fundamental tension between its essential role and its practical implementation challenges. The high cost of certification for small and medium enterprises creates significant barriers to entry, often favoring larger corporations that can absorb the expenses associated with comprehensive audits.

This issue is compounded by the need for harmonization of global fashion certification standards, as the current fragmented landscape of labels can confuse consumers and create redundant compliance work for brands operating internationally. In response, technology is emerging as a critical enabler.

The push for blockchain integration for textile supply chain traceability offers a potential solution, creating immutable records that can streamline the verification of recycled content in apparel and simplify auditing for fair labor practices in garment factories.

This technological shift is crucial as regulations, such as the EU's Green Claims Directive, intensify scrutiny on the environmental impact of synthetic vs natural fibers. The growth disparity between regions, with APAC's market expansion outpacing Europe's by nearly 5%, underscores the global shift in manufacturing and the corresponding need for scalable, technologically advanced verification solutions.

A key operational scenario involves a textile manufacturer in Southeast Asia using a blockchain-based system to provide real-time data on water usage and chemical inputs to its European clients, satisfying both regulatory and brand partner requirements for verifiable sustainability data.

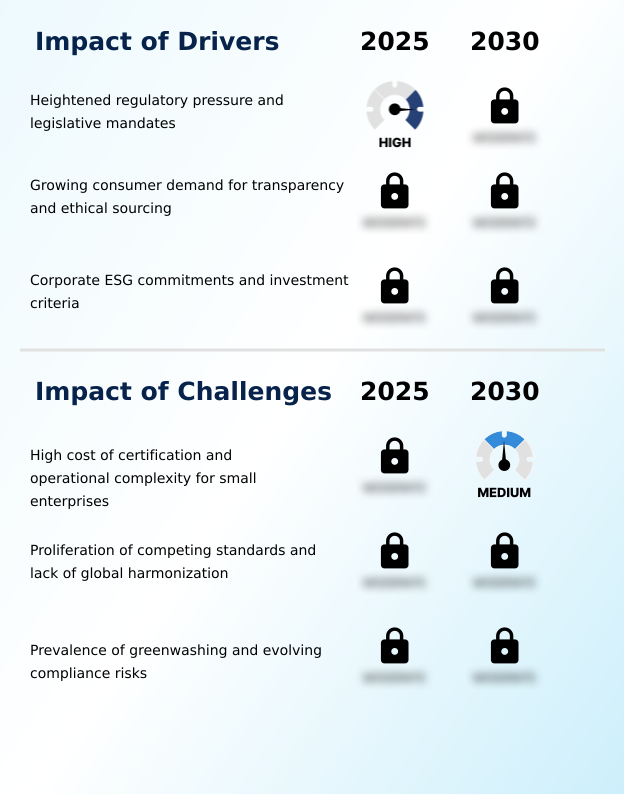
Primary Growth Driver: Heightened regulatory pressure and the implementation of legislative mandates that require verifiable proof of environmental and social claims are a key driver for the market.

Growth in the sustainable fashion certification services market is propelled by a convergence of regulatory mandates, consumer demand for transparency, and investor pressure.

Governments are enacting stringent laws, such as the EU's Corporate Sustainability Due Diligence Directive, that necessitate rigorous supply chain due diligence and verifiable proof of ethical claims, making third-party certification essential for compliance.

This is reinforced by investors who increasingly use environmental, social, and governance (ESG) criteria to evaluate risk and direct capital, linking financial incentives to certified performance.

Furthermore, rising consumer skepticism toward self-declared green marketing is driving brands to seek credible, independent environmental claim validation and social accountability standards to build trust and mitigate the risk of greenwashing, with the market showing an accelerating momentum and a year-over-year growth of 7.5%.

Emerging Market Trend: The integration of blockchain technology and digital product passports is enhancing traceability. This trend represents a fundamental shift away from static certifications toward dynamic, immutable records of a garment's lifecycle.

The market is evolving beyond raw material verification toward a holistic, technology-driven approach focused on circularity and data transparency. A primary trend is the integration of digital product passports, which provide immutable, blockchain-verified records of a garment's journey, from fiber origin to end-of-life. This enhances material traceability and combats greenwashing.

Concurrently, there is a significant expansion of circular economy principles, with new certification frameworks emerging to standardize lifecycle assessments (LCA) and validate textile-to-textile recycling processes. Certification bodies are now required to assess not just inputs but a product's entire lifecycle, including its design for disassembly and end-of-life recyclability.

This shift is critical as the market for recycled materials continues to grow, with the recycled material certification segment projected to see significant expansion.

Key Industry Challenge: The high cost of certification and the operational complexity of compliance present a key challenge, particularly for small and medium enterprises seeking to adopt sustainable practices.

The primary challenges hindering the market's universal adoption are the high cost of certification for small and medium enterprises, the fragmentation of standards, and the persistent threat of greenwashing. The financial burden of audits and compliance with standards like the Global Organic Textile Standard (GOTS) can be prohibitive for smaller brands, creating a market skewed toward large corporations.

This is exacerbated by a lack of harmonization of global fashion certification standards, which leads to confusion for consumers and redundant efforts for businesses seeking to operate across different regions. This fragmentation also creates opportunities for greenwashing, where misleading claims undermine the credibility of legitimate eco-labeling standards.

Mitigating these risks requires significant investment in supply chain transparency and robust chain of custody verification, further complicating the compliance landscape for all players.

Explore Full Market Dynamics Analysis Request Free Sample

Sustainable Fashion Certification Services Market Segmentation

The sustainable fashion certification services industry research report provides comprehensive data including region-wise segment analysis, with forecasts and analysis for the period 2026-2030, as well as historical data from 2020-2024 for the following segments.

Market Segment by Type
  • Organic textile certification
  • Recycled material certification
  • Fair trade certification
  • Carbon neutral certification
  • Animal welfare certification
Market Segment by End-user
  • Apparel brands
  • Textile manufacturers
  • Retailers
  • Fashion designers and private labels
Market Segment by Application
  • Clothing and apparel
  • Footwear
  • Accessories
  • Home textiles
Market Segment by Geography
APAC
China, India, Japan, South Korea, Australia, Indonesia
Europe
Germany, UK, France, Italy, Spain, The Netherlands
North America
US, Canada, Mexico
South America
Brazil, Argentina, Colombia
Middle East and Africa
Saudi Arabia, UAE, South Africa, Israel, Turkey

Type Segment Analysis

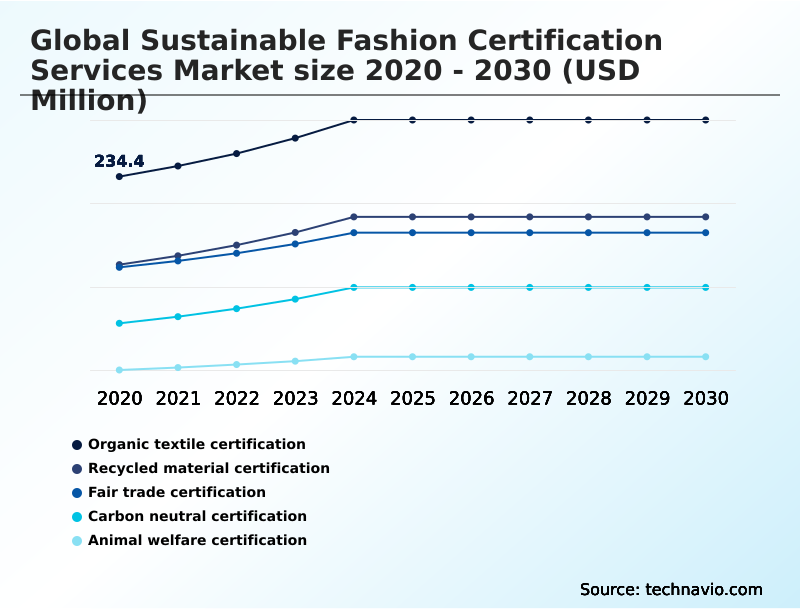
The organic textile certification segment is estimated to witness significant growth during the forecast period.

The organic textile certification segment is foundational to the sustainable fashion services market, driven by consumer and regulatory demands for materials free from synthetic inputs.

This subsegment, which accounts for a significant share of the market, addresses the ecological impact of conventional agriculture by enforcing stringent verification processes.

These processes ensure absolute compliance with standards like the Global Organic Textile Standard (GOTS), which mandates comprehensive soil testing, crop rotation validation, and strict adherence to environmental protection protocols throughout the supply chain.

Auditors perform chain of custody verification to ensure integrity from farm to final product.

As apparel corporations commit to zero-toxic-discharge goals and regenerative agriculture protocols, the demand for rigorous raw material validation continues to grow, cementing this segment's role in the industry.

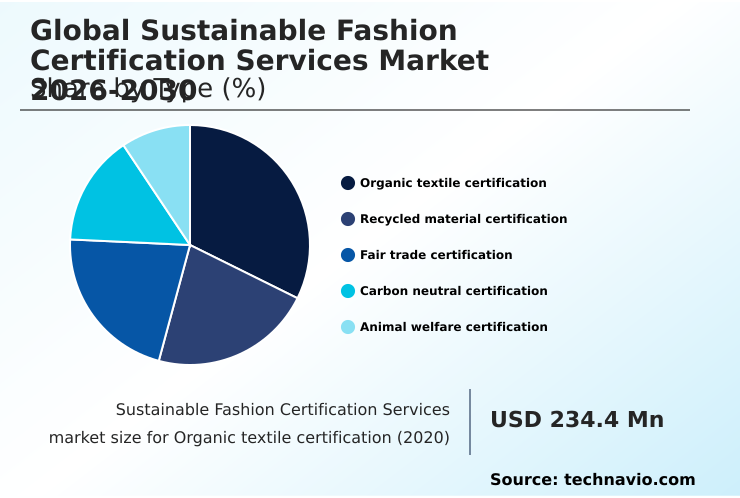
The Organic textile certification segment was valued at USD 283.1 million in 2024 and showed a gradual increase during the forecast period.

Sustainable Fashion Certification Services Market by Region: APAC Leads with 36.1% Growth Share

APAC is estimated to contribute 36.1% to the growth of the global market during the forecast period.

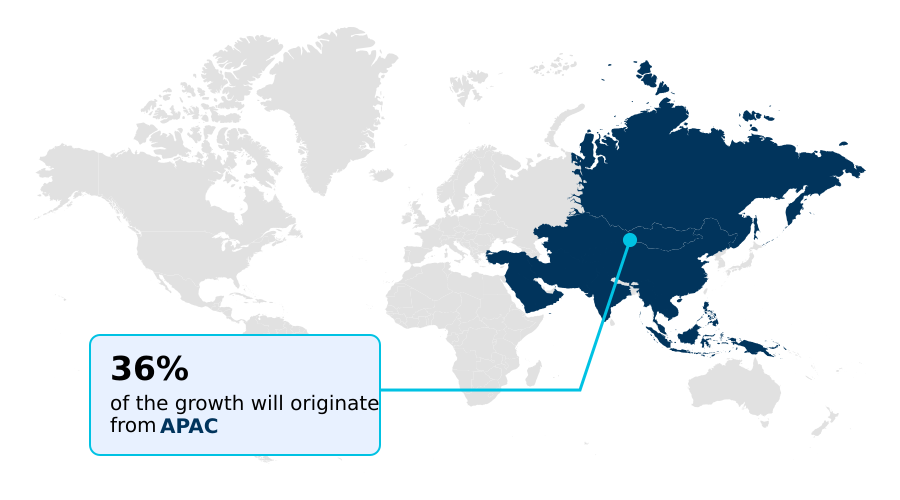
The geographic landscape of the sustainable fashion certification services market is dominated by APAC, which is set to contribute approximately 36.1% of the market's incremental growth.

This is largely because the region serves as the primary manufacturing hub for the global apparel industry, compelling factories to seek international validation through factory compliance auditing and material traceability programs to meet the demands of Western brands.

Europe, holding the second-largest share, acts as a regulatory pacesetter, with frameworks like the EU's Corporate Sustainability Due Diligence Directive mandating rigorous supply chain transparency.

In North America, growth is driven by consumer demand for ethical sourcing and the rise of circular business models requiring verification.

These regional dynamics create a global need for harmonized eco-labeling standards and third-party environmental certification to ensure consistency and trust across international supply chains.

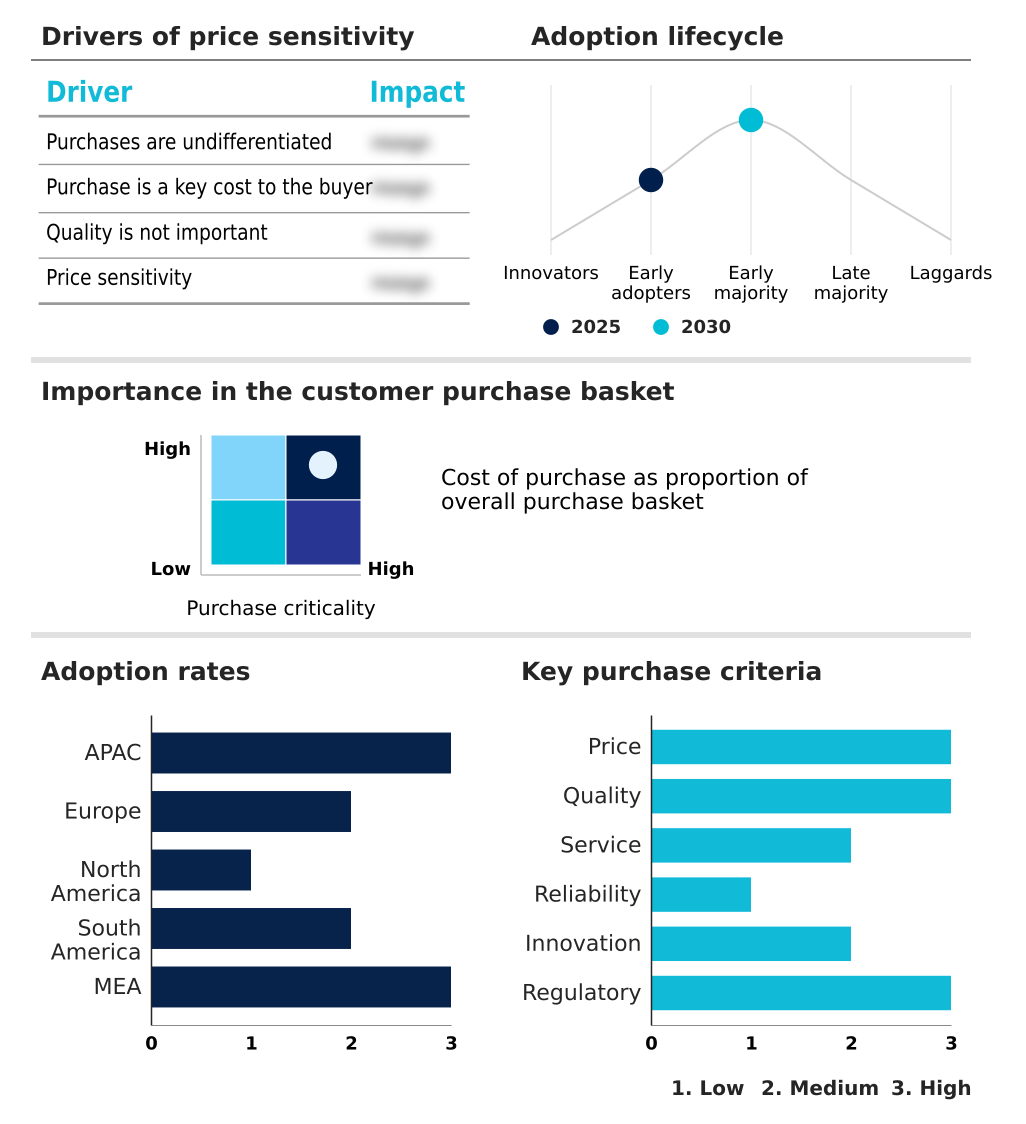
Customer Landscape Analysis for the Sustainable Fashion Certification Services Market

The sustainable fashion certification services market forecasting report includes the adoption lifecycle of the market, covering from the innovator’s stage to the laggard’s stage. It focuses on adoption rates in different regions based on penetration. Furthermore, the sustainable fashion certification services market report also includes key purchase criteria and drivers of price sensitivity to help companies evaluate and develop their market growth analysis strategies.

Competitive Landscape of the Sustainable Fashion Certification Services Market

Companies are implementing various strategies, such as strategic alliances, partnerships, mergers and acquisitions, geographical expansion, and product/service launches, to enhance their presence in the sustainable fashion certification services market industry.

B Lab - Services provide independent, third-party auditing and verification of environmental, social, and ethical claims across the global textile and apparel supply chain, ensuring compliance and enhancing transparency.

The industry research and growth report includes detailed analyses of the competitive landscape of the market and information about key companies, including:

  • B Lab
  • Bluesign Technologies AG
  • Bureau Veritas
  • Control union
  • ECOCERT GROUP
  • Intertek Group Plc
  • OEKO-TEX Service GmbH
  • SCS Global Services
  • SGS SA
  • TUV Rheinland Group
  • UL LLC

Qualitative and quantitative analysis of companies has been conducted to help clients understand the wider business environment as well as the strengths and weaknesses of key industry players. Data is qualitatively analyzed to categorize companies as pure play, category-focused, industry-focused, and diversified; it is quantitatively analyzed to categorize companies as dominant, leading, strong, tentative, and weak.

Recent Developments in the Sustainable Fashion Certification Services Market

  • In April 2025, OEKO-TEX implemented new regulations that introduced stricter chemical safety limits and improved verification processes for organic cotton used in certified textiles, enhancing the integrity of its labeling systems.
  • In May 2025, amendments to the CarbonNeutral Protocol introduced Scope 1 and Scope 2 entity certification options. This update allows organizations to certify operational emissions separately from broader corporate emissions, improving transparency and helping companies demonstrate measurable climate action.
  • In July 2025, The Global Organic Textile Standard initiated a public consultation process for a new certification framework called Global Responsible Textile Standard (GRTS), designed to expand sustainability criteria to responsibly produced fibres that are not necessarily organic.
  • In November 2025, hospitality supplier Bokser Textiles launched a Vermilion sheeting collection marketed as carbon-neutral bedding. The collection combines recycled or sustainable materials and carbon-offset programs to neutralize lifecycle emissions while also reducing microplastic fiber pollution.

Research Analyst Overview: Sustainable Fashion Certification Services Market

The operational landscape for apparel and textiles has shifted, making third-party verification a non-negotiable aspect of risk management and brand equity. Boardroom decisions now directly link environmental, social, and governance (ESG) criteria to financial performance, compelling investment in comprehensive supply chain due diligence.

Adherence to frameworks such as the ZDHC Roadmap to Zero or achieving Leather Working Group (LWG) certification is now a baseline expectation for market access. For example, to comply with the EU's Corporate Sustainability Due Diligence Directive, a fashion conglomerate must deploy robust social compliance auditing across its entire supplier network, making material traceability a critical operational capability.

This demand fuels the market for services providing lifecycle assessment (LCA) and chain of custody verification. Organizations use standards like the Global Recycled Standard (GRS) and Bluesign system to validate environmental claims, while B Corp Certification offers a holistic benchmark for ethical performance.

The market's momentum is evident, with APAC alone contributing over 36% to incremental growth, reflecting the global scale of manufacturing and the corresponding need for standardized, verifiable compliance protocols.

Dive into Technavio’s robust research methodology, blending expert interviews, extensive data synthesis, and validated models for unparalleled Sustainable Fashion Certification Services Market insights. See full methodology.

Request Free Sample

Market Scope
Page number 308
Base year 2025
Historic period 2020-2024
Forecast period 2026-2030
Growth momentum & CAGR Accelerate at a CAGR of 8.1%
Market growth 2026-2030 USD 454.4 million
Market structure Concentrated
YoY growth 2025-2026(%) 7.5%
Key countries China, India, Japan, South Korea, Australia, Indonesia, Germany, UK, France, Italy, Spain, The Netherlands, US, Canada, Mexico, Brazil, Argentina, Colombia, Saudi Arabia, UAE, South Africa, Israel and Turkey
Competitive landscape Leading Companies, Market Positioning of Companies, Competitive Strategies, and Industry Risks

Sustainable Fashion Certification Services Market: Key Questions Answered in This Report

  • What is the expected growth of the Sustainable Fashion Certification Services Market between 2026 and 2030?

    • The Sustainable Fashion Certification Services Market is expected to grow by USD 454.4 million during 2026-2030, registering a CAGR of 8.1%. Year-over-year growth in 2026 is estimated at 7.5%%. This acceleration is shaped by heightened regulatory pressure and legislative mandates, which is intensifying demand across multiple end-use verticals covered in the report.

  • What segmentation does the market report cover?

    • The report is segmented by Type (Organic textile certification, Recycled material certification, Fair trade certification, Carbon neutral certification, and Animal welfare certification), End-user (Apparel brands, Textile manufacturers, Retailers, and Fashion designers and private labels), Application (Clothing and apparel, Footwear, Accessories, and Home textiles) and Geography (APAC, Europe, North America, South America, Middle East and Africa). Among these, the Organic textile certification segment is estimated to witness significant growth during the forecast period, driven by rising adoption across key application areas. Each segment includes detailed qualitative and quantitative analysis, along with historical data from 2020-2024 and forecasts through 2030 with year-over-year growth rates.

  • Which regions are analyzed in the report?

    • The report covers APAC, Europe, North America, South America and Middle East and Africa. APAC is estimated to contribute 36.1% to market growth during the forecast period. Country-level analysis includes China, India, Japan, South Korea, Australia, Indonesia, Germany, UK, France, Italy, Spain, The Netherlands, US, Canada, Mexico, Brazil, Argentina, Colombia, Saudi Arabia, UAE, South Africa, Israel and Turkey, with dedicated market size tables and year-over-year growth for each.

  • What are the key growth drivers and market challenges?

    • The primary driver is heightened regulatory pressure and legislative mandates, which is accelerating investment and industry demand. The main challenge is high cost of certification and operational complexity for small enterprises, creating operational barriers for key market participants. The report quantifies the impact of each driver and challenge across 2026 and 2030 with comparative analysis.

  • Who are the major players in the Sustainable Fashion Certification Services Market?

    • Key vendors include B Lab, Bluesign Technologies AG, Bureau Veritas, Control union, ECOCERT GROUP, Intertek Group Plc, OEKO-TEX Service GmbH, SCS Global Services, SGS SA, TUV Rheinland Group and UL LLC. The report provides qualitative and quantitative analysis categorizing companies as dominant, leading, strong, tentative, and weak based on their market positioning. Company profiles include business segment analysis, SWOT assessment, key offerings, and recent strategic developments.

Sustainable Fashion Certification Services Market Research Insights

Market dynamics are increasingly shaped by corporate ESG commitments and the need for enhanced supply chain transparency, driving a year-over-year growth of 7.5%. Stakeholders demand verifiable proof of ethical sourcing and sustainable material sourcing, moving beyond self-declarations. This pressure is codified in frameworks like the Fashion Sustainability and Social Accountability Act, which mandates stringent material sourcing documentation.

In practice, a textile mill seeking to supply major apparel brands must now undergo regular factory compliance auditing for wastewater compliance under standards such as the ZDHC. This requirement for raw material validation and hazardous substance elimination forces investment in cleaner production technologies and transparent reporting systems.

The market is thus defined by a shift from voluntary initiatives to mandatory, audited compliance across the entire value chain.

We can help! Our analysts can customize this sustainable fashion certification services market research report to meet your requirements.

Get in touch

1. Executive Summary

1.1 Market overview

Executive Summary - Chart on Market Overview
Executive Summary - Data Table on Market Overview
Executive Summary - Chart on Global Market Characteristics
Executive Summary - Chart on Market by Geography
Executive Summary - Chart on Market Segmentation by Type
Executive Summary - Chart on Market Segmentation by End-user
Executive Summary - Chart on Market Segmentation by Application
Executive Summary - Chart on Incremental Growth
Executive Summary - Data Table on Incremental Growth
Executive Summary - Chart on Company Market Positioning

2. Technavio Analysis

2.1 Analysis of price sensitivity, lifecycle, customer purchase basket, adoption rates, and purchase criteria

2.2 Criticality of inputs and Factors of differentiation

Chart on Overview on criticality of inputs and factors of differentiation

2.3 Factors of disruption

Chart on Overview on factors of disruption

2.4 Impact of drivers and challenges

Chart on Impact of drivers and challenges in 2025 and 2030

3. Market Landscape

3.1 Market ecosystem

Chart on Parent Market
Data Table on - Parent Market

3.2 Market characteristics

Chart on Market characteristics analysis

3.3 Value chain analysis

Chart on Value chain analysis

4. Market Sizing

4.1 Market definition

Data Table on Offerings of companies included in the market definition

4.2 Market segment analysis

Market segments

4.3 Market size 2025

4.4 Market outlook: Forecast for 2025-2030

Chart on Global - Market size and forecast 2025-2030 ($ million)
Data Table on Global - Market size and forecast 2025-2030 ($ million)
Chart on Global Market: Year-over-year growth 2025-2030 (%)
Data Table on Global Market: Year-over-year growth 2025-2030 (%)

5. Historic Market Size

5.1 Global Sustainable Fashion Certification Services Market 2020 - 2024

Historic Market Size - Data Table on Global Sustainable Fashion Certification Services Market 2020 - 2024 ($ million)

5.2 Type segment analysis 2020 - 2024

Historic Market Size - Type Segment 2020 - 2024 ($ million)

5.3 End-user segment analysis 2020 - 2024

Historic Market Size - End-user Segment 2020 - 2024 ($ million)

5.4 Application segment analysis 2020 - 2024

Historic Market Size - Application Segment 2020 - 2024 ($ million)

5.5 Geography segment analysis 2020 - 2024

Historic Market Size - Geography Segment 2020 - 2024 ($ million)

5.6 Country segment analysis 2020 - 2024

Historic Market Size - Country Segment 2020 - 2024 ($ million)

6. Qualitative Analysis

6.1 Impact of AI on Global Sustainable Fashion Certification Services Market

6.2 Impact of Geopolitical Conflicts on Sustainable Fashion Certification Services Market

7. Five Forces Analysis

7.1 Five forces summary

Five forces analysis - Comparison between 2025 and 2030

7.2 Bargaining power of buyers

Bargaining power of buyers - Impact of key factors 2025 and 2030

7.3 Bargaining power of suppliers

Bargaining power of suppliers - Impact of key factors in 2025 and 2030

7.4 Threat of new entrants

Threat of new entrants - Impact of key factors in 2025 and 2030

7.5 Threat of substitutes

Threat of substitutes - Impact of key factors in 2025 and 2030

7.6 Threat of rivalry

Threat of rivalry - Impact of key factors in 2025 and 2030

7.7 Market condition

Chart on Market condition - Five forces 2025 and 2030

8. Market Segmentation by Type

8.1 Market segments

Chart on Type - Market share 2025-2030 (%)
Data Table on Type - Market share 2025-2030 (%)

8.2 Comparison by Type

Chart on Comparison by Type
Data Table on Comparison by Type

8.3 Organic textile certification - Market size and forecast 2025-2030

Chart on Organic textile certification - Market size and forecast 2025-2030 ($ million)
Data Table on Organic textile certification - Market size and forecast 2025-2030 ($ million)
Chart on Organic textile certification - Year-over-year growth 2025-2030 (%)
Data Table on Organic textile certification - Year-over-year growth 2025-2030 (%)

8.4 Recycled material certification - Market size and forecast 2025-2030

Chart on Recycled material certification - Market size and forecast 2025-2030 ($ million)
Data Table on Recycled material certification - Market size and forecast 2025-2030 ($ million)
Chart on Recycled material certification - Year-over-year growth 2025-2030 (%)
Data Table on Recycled material certification - Year-over-year growth 2025-2030 (%)

8.5 Fair trade certification - Market size and forecast 2025-2030

Chart on Fair trade certification - Market size and forecast 2025-2030 ($ million)
Data Table on Fair trade certification - Market size and forecast 2025-2030 ($ million)
Chart on Fair trade certification - Year-over-year growth 2025-2030 (%)
Data Table on Fair trade certification - Year-over-year growth 2025-2030 (%)

8.6 Carbon neutral certification - Market size and forecast 2025-2030

Chart on Carbon neutral certification - Market size and forecast 2025-2030 ($ million)
Data Table on Carbon neutral certification - Market size and forecast 2025-2030 ($ million)
Chart on Carbon neutral certification - Year-over-year growth 2025-2030 (%)
Data Table on Carbon neutral certification - Year-over-year growth 2025-2030 (%)

8.7 Animal welfare certification - Market size and forecast 2025-2030

Chart on Animal welfare certification - Market size and forecast 2025-2030 ($ million)
Data Table on Animal welfare certification - Market size and forecast 2025-2030 ($ million)
Chart on Animal welfare certification - Year-over-year growth 2025-2030 (%)
Data Table on Animal welfare certification - Year-over-year growth 2025-2030 (%)

8.8 Market opportunity by Type

Market opportunity by Type ($ million)
Data Table on Market opportunity by Type ($ million)

9. Market Segmentation by End-user

9.1 Market segments

Chart on End-user - Market share 2025-2030 (%)
Data Table on End-user - Market share 2025-2030 (%)

9.2 Comparison by End-user

Chart on Comparison by End-user
Data Table on Comparison by End-user

9.3 Apparel brands - Market size and forecast 2025-2030

Chart on Apparel brands - Market size and forecast 2025-2030 ($ million)
Data Table on Apparel brands - Market size and forecast 2025-2030 ($ million)
Chart on Apparel brands - Year-over-year growth 2025-2030 (%)
Data Table on Apparel brands - Year-over-year growth 2025-2030 (%)

9.4 Textile manufacturers - Market size and forecast 2025-2030

Chart on Textile manufacturers - Market size and forecast 2025-2030 ($ million)
Data Table on Textile manufacturers - Market size and forecast 2025-2030 ($ million)
Chart on Textile manufacturers - Year-over-year growth 2025-2030 (%)
Data Table on Textile manufacturers - Year-over-year growth 2025-2030 (%)

9.5 Retailers - Market size and forecast 2025-2030

Chart on Retailers - Market size and forecast 2025-2030 ($ million)
Data Table on Retailers - Market size and forecast 2025-2030 ($ million)
Chart on Retailers - Year-over-year growth 2025-2030 (%)
Data Table on Retailers - Year-over-year growth 2025-2030 (%)

9.6 Fashion designers and private labels - Market size and forecast 2025-2030

Chart on Fashion designers and private labels - Market size and forecast 2025-2030 ($ million)
Data Table on Fashion designers and private labels - Market size and forecast 2025-2030 ($ million)
Chart on Fashion designers and private labels - Year-over-year growth 2025-2030 (%)
Data Table on Fashion designers and private labels - Year-over-year growth 2025-2030 (%)

9.7 Market opportunity by End-user

Market opportunity by End-user ($ million)
Data Table on Market opportunity by End-user ($ million)

10. Market Segmentation by Application

10.1 Market segments

Chart on Application - Market share 2025-2030 (%)
Data Table on Application - Market share 2025-2030 (%)

10.2 Comparison by Application

Chart on Comparison by Application
Data Table on Comparison by Application

10.3 Clothing and apparel - Market size and forecast 2025-2030

Chart on Clothing and apparel - Market size and forecast 2025-2030 ($ million)
Data Table on Clothing and apparel - Market size and forecast 2025-2030 ($ million)
Chart on Clothing and apparel - Year-over-year growth 2025-2030 (%)
Data Table on Clothing and apparel - Year-over-year growth 2025-2030 (%)

10.4 Footwear - Market size and forecast 2025-2030

Chart on Footwear - Market size and forecast 2025-2030 ($ million)
Data Table on Footwear - Market size and forecast 2025-2030 ($ million)
Chart on Footwear - Year-over-year growth 2025-2030 (%)
Data Table on Footwear - Year-over-year growth 2025-2030 (%)

10.5 Accessories - Market size and forecast 2025-2030

Chart on Accessories - Market size and forecast 2025-2030 ($ million)
Data Table on Accessories - Market size and forecast 2025-2030 ($ million)
Chart on Accessories - Year-over-year growth 2025-2030 (%)
Data Table on Accessories - Year-over-year growth 2025-2030 (%)

10.6 Home textiles - Market size and forecast 2025-2030

Chart on Home textiles - Market size and forecast 2025-2030 ($ million)
Data Table on Home textiles - Market size and forecast 2025-2030 ($ million)
Chart on Home textiles - Year-over-year growth 2025-2030 (%)
Data Table on Home textiles - Year-over-year growth 2025-2030 (%)

10.7 Market opportunity by Application

Market opportunity by Application ($ million)
Data Table on Market opportunity by Application ($ million)

11. Customer Landscape

11.1 Customer landscape overview

Analysis of price sensitivity, lifecycle, customer purchase basket, adoption rates, and purchase criteria

12. Geographic Landscape

12.1 Geographic segmentation

Chart on Market share by geography 2025-2030 (%)
Data Table on Market share by geography 2025-2030 (%)

12.2 Geographic comparison

Chart on Geographic comparison
Data Table on Geographic comparison

12.3 APAC - Market size and forecast 2025-2030

Chart on APAC - Market size and forecast 2025-2030 ($ million)
Data Table on APAC - Market size and forecast 2025-2030 ($ million)
Chart on APAC - Year-over-year growth 2025-2030 (%)
Data Table on APAC - Year-over-year growth 2025-2030 (%)
Chart on Regional Comparison - APAC
Data Table on Regional Comparison - APAC

12.3.1 China - Market size and forecast 2025-2030

Chart on China - Market size and forecast 2025-2030 ($ million)
Data Table on China - Market size and forecast 2025-2030 ($ million)
Chart on China - Year-over-year growth 2025-2030 (%)
Data Table on China - Year-over-year growth 2025-2030 (%)

12.3.2 India - Market size and forecast 2025-2030

Chart on India - Market size and forecast 2025-2030 ($ million)
Data Table on India - Market size and forecast 2025-2030 ($ million)
Chart on India - Year-over-year growth 2025-2030 (%)
Data Table on India - Year-over-year growth 2025-2030 (%)

12.3.3 Japan - Market size and forecast 2025-2030

Chart on Japan - Market size and forecast 2025-2030 ($ million)
Data Table on Japan - Market size and forecast 2025-2030 ($ million)
Chart on Japan - Year-over-year growth 2025-2030 (%)
Data Table on Japan - Year-over-year growth 2025-2030 (%)

12.3.4 South Korea - Market size and forecast 2025-2030

Chart on South Korea - Market size and forecast 2025-2030 ($ million)
Data Table on South Korea - Market size and forecast 2025-2030 ($ million)
Chart on South Korea - Year-over-year growth 2025-2030 (%)
Data Table on South Korea - Year-over-year growth 2025-2030 (%)

12.3.5 Australia - Market size and forecast 2025-2030

Chart on Australia - Market size and forecast 2025-2030 ($ million)
Data Table on Australia - Market size and forecast 2025-2030 ($ million)
Chart on Australia - Year-over-year growth 2025-2030 (%)
Data Table on Australia - Year-over-year growth 2025-2030 (%)

12.3.6 Indonesia - Market size and forecast 2025-2030

Chart on Indonesia - Market size and forecast 2025-2030 ($ million)
Data Table on Indonesia - Market size and forecast 2025-2030 ($ million)
Chart on Indonesia - Year-over-year growth 2025-2030 (%)
Data Table on Indonesia - Year-over-year growth 2025-2030 (%)

12.4 Europe - Market size and forecast 2025-2030

Chart on Europe - Market size and forecast 2025-2030 ($ million)
Data Table on Europe - Market size and forecast 2025-2030 ($ million)
Chart on Europe - Year-over-year growth 2025-2030 (%)
Data Table on Europe - Year-over-year growth 2025-2030 (%)
Chart on Regional Comparison - Europe
Data Table on Regional Comparison - Europe

12.4.1 Germany - Market size and forecast 2025-2030

Chart on Germany - Market size and forecast 2025-2030 ($ million)
Data Table on Germany - Market size and forecast 2025-2030 ($ million)
Chart on Germany - Year-over-year growth 2025-2030 (%)
Data Table on Germany - Year-over-year growth 2025-2030 (%)

12.4.2 UK - Market size and forecast 2025-2030

Chart on UK - Market size and forecast 2025-2030 ($ million)
Data Table on UK - Market size and forecast 2025-2030 ($ million)
Chart on UK - Year-over-year growth 2025-2030 (%)
Data Table on UK - Year-over-year growth 2025-2030 (%)

12.4.3 France - Market size and forecast 2025-2030

Chart on France - Market size and forecast 2025-2030 ($ million)
Data Table on France - Market size and forecast 2025-2030 ($ million)
Chart on France - Year-over-year growth 2025-2030 (%)
Data Table on France - Year-over-year growth 2025-2030 (%)

12.4.4 Italy - Market size and forecast 2025-2030

Chart on Italy - Market size and forecast 2025-2030 ($ million)
Data Table on Italy - Market size and forecast 2025-2030 ($ million)
Chart on Italy - Year-over-year growth 2025-2030 (%)
Data Table on Italy - Year-over-year growth 2025-2030 (%)

12.4.5 Spain - Market size and forecast 2025-2030

Chart on Spain - Market size and forecast 2025-2030 ($ million)
Data Table on Spain - Market size and forecast 2025-2030 ($ million)
Chart on Spain - Year-over-year growth 2025-2030 (%)
Data Table on Spain - Year-over-year growth 2025-2030 (%)

12.4.6 The Netherlands - Market size and forecast 2025-2030

Chart on The Netherlands - Market size and forecast 2025-2030 ($ million)
Data Table on The Netherlands - Market size and forecast 2025-2030 ($ million)
Chart on The Netherlands - Year-over-year growth 2025-2030 (%)
Data Table on The Netherlands - Year-over-year growth 2025-2030 (%)

12.5 North America - Market size and forecast 2025-2030

Chart on North America - Market size and forecast 2025-2030 ($ million)
Data Table on North America - Market size and forecast 2025-2030 ($ million)
Chart on North America - Year-over-year growth 2025-2030 (%)
Data Table on North America - Year-over-year growth 2025-2030 (%)
Chart on Regional Comparison - North America
Data Table on Regional Comparison - North America

12.5.1 US - Market size and forecast 2025-2030

Chart on US - Market size and forecast 2025-2030 ($ million)
Data Table on US - Market size and forecast 2025-2030 ($ million)
Chart on US - Year-over-year growth 2025-2030 (%)
Data Table on US - Year-over-year growth 2025-2030 (%)

12.5.2 Canada - Market size and forecast 2025-2030

Chart on Canada - Market size and forecast 2025-2030 ($ million)
Data Table on Canada - Market size and forecast 2025-2030 ($ million)
Chart on Canada - Year-over-year growth 2025-2030 (%)
Data Table on Canada - Year-over-year growth 2025-2030 (%)

12.5.3 Mexico - Market size and forecast 2025-2030

Chart on Mexico - Market size and forecast 2025-2030 ($ million)
Data Table on Mexico - Market size and forecast 2025-2030 ($ million)
Chart on Mexico - Year-over-year growth 2025-2030 (%)
Data Table on Mexico - Year-over-year growth 2025-2030 (%)

12.6 South America - Market size and forecast 2025-2030

Chart on South America - Market size and forecast 2025-2030 ($ million)
Data Table on South America - Market size and forecast 2025-2030 ($ million)
Chart on South America - Year-over-year growth 2025-2030 (%)
Data Table on South America - Year-over-year growth 2025-2030 (%)
Chart on Regional Comparison - South America
Data Table on Regional Comparison - South America

12.6.1 Brazil - Market size and forecast 2025-2030

Chart on Brazil - Market size and forecast 2025-2030 ($ million)
Data Table on Brazil - Market size and forecast 2025-2030 ($ million)
Chart on Brazil - Year-over-year growth 2025-2030 (%)
Data Table on Brazil - Year-over-year growth 2025-2030 (%)

12.6.2 Argentina - Market size and forecast 2025-2030

Chart on Argentina - Market size and forecast 2025-2030 ($ million)
Data Table on Argentina - Market size and forecast 2025-2030 ($ million)
Chart on Argentina - Year-over-year growth 2025-2030 (%)
Data Table on Argentina - Year-over-year growth 2025-2030 (%)

12.6.3 Colombia - Market size and forecast 2025-2030

Chart on Colombia - Market size and forecast 2025-2030 ($ million)
Data Table on Colombia - Market size and forecast 2025-2030 ($ million)
Chart on Colombia - Year-over-year growth 2025-2030 (%)
Data Table on Colombia - Year-over-year growth 2025-2030 (%)

12.7 Middle East and Africa - Market size and forecast 2025-2030

Chart on Middle East and Africa - Market size and forecast 2025-2030 ($ million)
Data Table on Middle East and Africa - Market size and forecast 2025-2030 ($ million)
Chart on Middle East and Africa - Year-over-year growth 2025-2030 (%)
Data Table on Middle East and Africa - Year-over-year growth 2025-2030 (%)
Chart on Regional Comparison - Middle East and Africa
Data Table on Regional Comparison - Middle East and Africa

12.7.1 Saudi Arabia - Market size and forecast 2025-2030

Chart on Saudi Arabia - Market size and forecast 2025-2030 ($ million)
Data Table on Saudi Arabia - Market size and forecast 2025-2030 ($ million)
Chart on Saudi Arabia - Year-over-year growth 2025-2030 (%)
Data Table on Saudi Arabia - Year-over-year growth 2025-2030 (%)

12.7.2 UAE - Market size and forecast 2025-2030

Chart on UAE - Market size and forecast 2025-2030 ($ million)
Data Table on UAE - Market size and forecast 2025-2030 ($ million)
Chart on UAE - Year-over-year growth 2025-2030 (%)
Data Table on UAE - Year-over-year growth 2025-2030 (%)

12.7.3 South Africa - Market size and forecast 2025-2030

Chart on South Africa - Market size and forecast 2025-2030 ($ million)
Data Table on South Africa - Market size and forecast 2025-2030 ($ million)
Chart on South Africa - Year-over-year growth 2025-2030 (%)
Data Table on South Africa - Year-over-year growth 2025-2030 (%)

12.7.4 Israel - Market size and forecast 2025-2030

Chart on Israel - Market size and forecast 2025-2030 ($ million)
Data Table on Israel - Market size and forecast 2025-2030 ($ million)
Chart on Israel - Year-over-year growth 2025-2030 (%)
Data Table on Israel - Year-over-year growth 2025-2030 (%)

12.7.5 Turkey - Market size and forecast 2025-2030

Chart on Turkey - Market size and forecast 2025-2030 ($ million)
Data Table on Turkey - Market size and forecast 2025-2030 ($ million)
Chart on Turkey - Year-over-year growth 2025-2030 (%)
Data Table on Turkey - Year-over-year growth 2025-2030 (%)

12.8 Market opportunity by geography

Market opportunity by geography ($ million)
Data Tables on Market opportunity by geography ($ million)

13. Drivers, Challenges, and Opportunity

13.1 Market drivers

Heightened regulatory pressure and legislative mandates
Growing consumer demand for transparency and ethical sourcing
Corporate ESG commitments and investment criteria

13.2 Market challenges

High cost of certification and operational complexity for small enterprises
Proliferation of competing standards and lack of global harmonization
Prevalence of greenwashing and evolving compliance risks

13.3 Impact of drivers and challenges

Impact of drivers and challenges in 2025 and 2030

13.4 Market opportunities

Integration of blockchain and digital product passports for enhanced traceability
Circular economy and standardization of end-of-life lifecycle assessments
Expansion of biodiversity and regenerative agriculture certification protocols

14. Competitive Landscape

14.1 Overview

14.2

Overview on criticality of inputs and factors of differentiation

14.3 Landscape disruption

Overview on factors of disruption

14.4 Industry risks

Impact of key risks on business

15. Competitive Analysis

15.1 Companies profiled

Companies covered

15.2 Company ranking index

15.3 Market positioning of companies

Matrix on companies position and classification

15.4 B Lab

B Lab - Overview
B Lab - Product / Service
B Lab - Key offerings
SWOT

15.5 Bluesign Technologies AG

Bluesign Technologies AG - Overview
Bluesign Technologies AG - Product / Service
Bluesign Technologies AG - Key offerings
SWOT

15.6 Bureau Veritas

Bureau Veritas - Overview
Bureau Veritas - Business segments
Bureau Veritas - Key offerings
Bureau Veritas - Segment focus
SWOT

15.7 Control union

Control union - Overview
Control union - Product / Service
Control union - Key offerings
SWOT

15.8 ECOCERT GROUP

ECOCERT GROUP - Overview
ECOCERT GROUP - Product / Service
ECOCERT GROUP - Key offerings
SWOT

15.9 Intertek Group Plc

Intertek Group Plc - Overview
Intertek Group Plc - Business segments
Intertek Group Plc - Key offerings
Intertek Group Plc - Segment focus
SWOT

15.10 OEKO-TEX Service GmbH

OEKO-TEX Service GmbH - Overview
OEKO-TEX Service GmbH - Product / Service
OEKO-TEX Service GmbH - Key offerings
SWOT

15.11 SCS Global Services

SCS Global Services - Overview
SCS Global Services - Product / Service
SCS Global Services - Key offerings
SWOT

15.12 SGS SA

SGS SA - Overview
SGS SA - Business segments
SGS SA - Key offerings
SGS SA - Segment focus
SWOT

15.13 TUV Rheinland Group

TUV Rheinland Group - Overview
TUV Rheinland Group - Product / Service
TUV Rheinland Group - Key offerings
SWOT

15.14 UL LLC

UL LLC - Overview
UL LLC - Business segments
UL LLC - Key offerings
UL LLC - Segment focus
SWOT

16. Appendix

16.1 Scope of the report

Market definition
Objectives
Notes and caveats

16.2 Inclusions and exclusions checklist

Inclusions checklist
Exclusions checklist

16.3 Currency conversion rates for US$

16.4 Research methodology

16.5 Data procurement

Information sources

16.6 Data validation

16.7 Validation techniques employed for market sizing

16.8 Data synthesis

16.9 360 degree market analysis

16.10 List of abbreviations

Research Methodology

Technavio presents a detailed picture of the market by way of study, synthesis, and summation of data from multiple sources. The analysts have presented the various facets of the market with a particular focus on identifying the key industry influencers. The data thus presented is comprehensive, reliable, and the result of extensive research, both primary and secondary.

INFORMATION SOURCES

Primary sources

  • Manufacturers and suppliers
  • Channel partners
  • Industry experts
  • Strategic decision makers

Secondary sources

  • Industry journals and periodicals
  • Government data
  • Financial reports of key industry players
  • Historical data
  • Press releases

DATA ANALYSIS

Data Synthesis

  • Collation of data
  • Estimation of key figures
  • Analysis of derived insights

Data Validation

  • Triangulation with data models
  • Reference against proprietary databases
  • Corroboration with industry experts

REPORT WRITING

Qualitative

  • Market drivers
  • Market challenges
  • Market trends
  • Five forces analysis

Quantitative

  • Market size and forecast
  • Market segmentation
  • Geographical insights
  • Competitive landscape

Interested in this report?

Get your sample now to see our research methodology and insights!

Download Now

Frequently Asked Questions

Sustainable Fashion Certification Services market growth will increase by USD 454.4 million during 2026-2030.

The Sustainable Fashion Certification Services market is expected to grow at a CAGR of 8.1% during 2026-2030.

Sustainable Fashion Certification Services market is segmented by Type (Organic textile certification, Recycled material certification, Fair trade certification, Carbon neutral certification, Animal welfare certification) End-user (Apparel brands, Textile manufacturers, Retailers, Fashion designers and private labels) Application (Clothing and apparel, Footwear, Accessories, Home textiles)

B Lab, Bluesign Technologies AG, Bureau Veritas, Control union, ECOCERT GROUP, Intertek Group Plc, OEKO-TEX Service GmbH, SCS Global Services, SGS SA, TUV Rheinland Group, UL LLC are a few of the key vendors in the Sustainable Fashion Certification Services market.

APAC will register the highest growth rate of 36.1% among the other regions. Therefore, the Sustainable Fashion Certification Services market in APAC is expected to garner significant business opportunities for the vendors during the forecast period.

China, India, Japan, South Korea, Australia, Indonesia, Germany, UK, France, Italy, Spain, The Netherlands, US, Canada, Mexico, Brazil, Argentina, Colombia, Saudi Arabia, UAE, South Africa, Israel, Turkey

  • Heightened regulatory pressure and legislative mandates is the driving factor this market.

The Sustainable Fashion Certification Services market vendors should focus on grabbing business opportunities from the Type segment as it accounted for the largest market share in the base year.
RIA - Research AI Assistant
Ask RIA