Sustainable Palm Oil Market Size 2025-2029
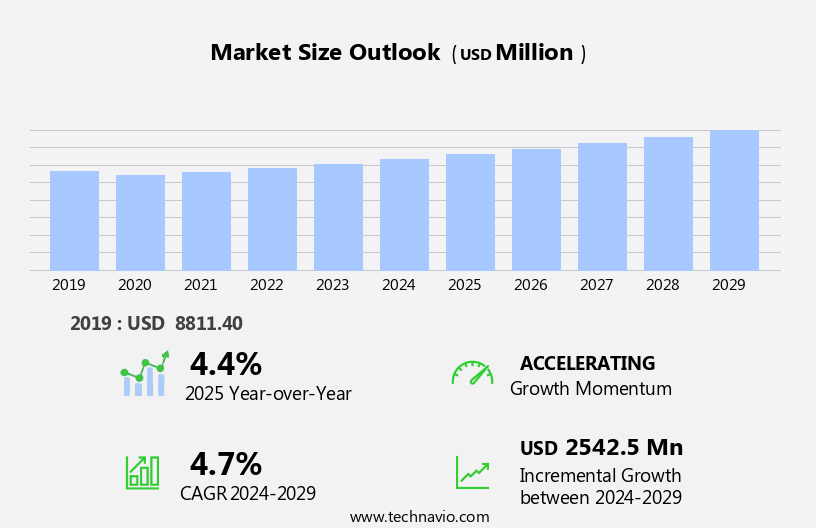
The sustainable palm oil market size is forecast to increase by USD 2.54 billion, at a CAGR of 4.7% between 2024 and 2029.
- The market is experiencing significant growth, driven by the increasing demand for trans-fat-free products among health-conscious consumers. This trend is leading to a rise in the adoption of sustainable palm oil as a viable alternative to its traditional counterpart. Furthermore, advancements in sustainable cultivation methods are making palm oil production more environmentally friendly, addressing concerns over deforestation and carbon emissions. However, the market faces challenges, including the rising availability of substitutes such as soybean and sunflower oils.
- Sustainable palm oil's growing popularity presents a significant market potential for businesses committed to producing and supplying eco-friendly products, while navigating the challenges posed by substitutes and evolving consumer preferences. However, the market faces challenges, including the rising availability of substitutes for sustainable palm oil, such as soybean and sunflower oils. Companies seeking to capitalize on this market's opportunities must stay abreast of these trends and address the challenges effectively through innovation, strategic partnerships, and sustainable business practices.
What will be the Size of the Sustainable Palm Oil Market during the forecast period?
Explore in-depth regional segment analysis with market size data - historical 2019-2023 and forecasts 2025-2029 - in the full report.
Request Free Sample
The market continues to evolve, shaped by dynamic market forces and shifting industry trends. The complex interplay of carbon emissions, processing technologies, and palm oil derivatives drives innovation in areas such as carbon offsets and renewable energy targets. Palm kernel shells and fiber waste are increasingly being repurposed for biodiesel production and biogas generation, reducing the environmental footprint of palm oil production. Sustainability certifications, such as those focusing on sustainable agricultural practices and peatland protection, are gaining traction. Animal feed and food applications remain significant sectors, with a growing emphasis on traceability systems and supply chain transparency. Palm kernel oil, fresh fruit bunches, and crude palm oil are integral components of this evolving landscape.
Land use change, disease control, and pest management are ongoing concerns, with a focus on sustainable sourcing and brand image. The food industry's increasing demand for sustainable palm oil drives the adoption of segregated palm oil and renewable energy in palm oil mills. Storage facilities and transportation logistics are optimized to minimize water usage and waste. Sustainable agriculture, social impact assessments, and community engagement are essential elements of the circular economy. Renewable energy, biogas generation, and wastewater treatment are integrated into palm oil mill operations to minimize carbon emissions and reduce the environmental footprint. The market's continuous dynamism underscores the importance of ongoing monitoring systems for labor practices, biodiversity conservation, and deforestation monitoring.
How is this Sustainable Palm Oil Industry segmented?
The sustainable palm oil industry research report provides comprehensive data (region-wise segment analysis), with forecasts and estimates in "USD million" for the period 2025-2029, as well as historical data from 2019-2023 for the following segments.
- Type
- Edible oil
- Surfactants
- Biofuels
- Others
- Distribution Channel
- Offline
- Online
- End-user
- Household
- Commercial
- Industrial
- Geography
- North America
- US
- Europe
- France
- Germany
- UK
- APAC
- China
- India
- Indonesia
- Malaysia
- Pakistan
- Rest of World (ROW)
- North America
By Type Insights
The edible oil segment is estimated to witness significant growth during the forecast period. Sustainable palm oil production is gaining momentum in the edible oil market due to rising consumer awareness and preference for environmentally responsible and ethically sourced ingredients. This shift is driven by the increasing recognition of the environmental and social issues linked to traditional palm oil production methods. The focus on sustainable practices encompasses various aspects, such as the use of advanced processing technologies, carbon emissions reduction, fair wages for laborers, and effective fiber waste management. Water usage is minimized through recycling processes, while biodiesel production from palm kernel shells contributes to renewable energy targets. Harvesting methods prioritize supply chain transparency and disease control, ensuring the health of oil palm trees and the protection of biodiversity.
Sustainable agricultural practices, including pest management and social impact assessments, promote long-term sustainability and community engagement. The production process adheres to certification standards and circular economy principles, with a focus on renewable energy, storage facilities, and wastewater treatment. The food industry is embracing sustainable palm oil, as it aligns with the growing demand for eco-friendly and ethically sourced ingredients. The use of sustainable palm oil derivatives, such as palm oil mill effluent for biogas generation, further enhances the circular economy approach. The integration of these practices into the palm oil industry is essential for reducing the environmental footprint and ensuring a sustainable future for palm oil production. This versatile vegetable oil is employed extensively across various sectors, including pet food, organic, cosmetics, and soap and detergent industries.
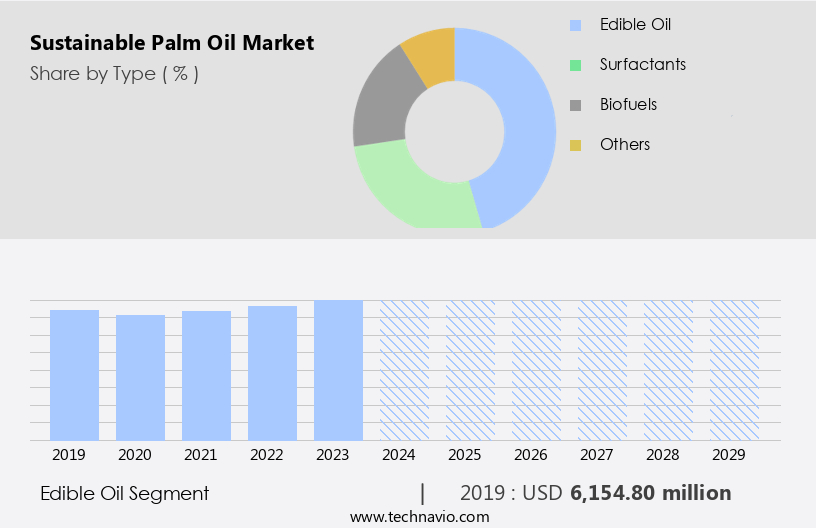
The Edible oil segment was valued at USD 6.15 billion in 2019 and showed a gradual increase during the forecast period.
Regional Analysis
APAC is estimated to contribute 64% to the growth of the global market during the forecast period. Technavio's analysts have elaborately explained the regional trends and drivers that shape the market during the forecast period.
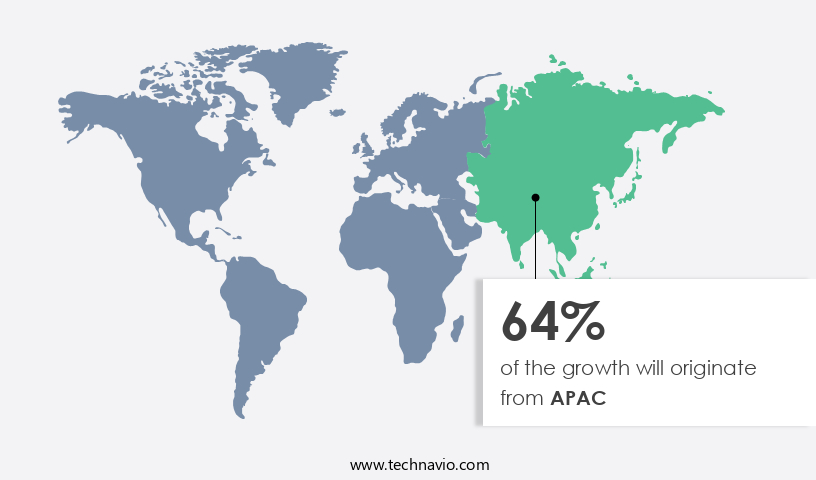
The palm oil market in the Asia-Pacific (APAC) region has witnessed increasing demand for sustainable palm oil over the past five years. This trend is driven by heightened awareness of the health benefits of sustainable palm oil, rising disposable income, and the expansion of the retail sector. Indonesia and Malaysia, significant contributors to the global palm oil production, have implemented certification schemes like the Round Table on Sustainable Palm Oil (RSPO) and the Indonesian Sustainable Palm Oil (ISPO) standard to promote sustainable practices. Sustainable palm oil production encompasses various aspects, including carbon emissions reduction through advanced processing technologies, fair wages for laborers, efficient fiber waste management, and water usage control.
Harvesting methods are also crucial, with a focus on sustainable agriculture and social impact assessments. Processing technologies have evolved, with an emphasis on recycling processes and biodiesel production from palm kernel shells. Crude palm oil extraction is carried out using eco-friendly methods, while sustainable palm oil derivatives are produced to cater to diverse industries, such as food and animal feed. Biodiversity conservation, deforestation monitoring, and wastewater treatment are essential components of sustainable palm oil production. Monitoring systems are employed to ensure transparency in the supply chain, ensuring traceability from plantation to consumer. Renewable energy targets and sustainable sourcing are key priorities for companies in the food industry, which is a significant consumer of palm oil.
Palm oil mills have integrated renewable energy, storage facilities, and circular economy principles to minimize their environmental footprint. Certification standards, such as RSPO and ISPO, provide a framework for pest management, fatty acid production, and product lifecycle assessment. Carbon offsets are utilized to minimize the carbon emissions associated with palm oil production, contributing to a more sustainable environmental footprint. Oil palm trees are cultivated using sustainable agricultural practices, with a focus on peatland protection and community engagement. Smallholder farmers are integrated into the value chain, ensuring a steady supply of sustainable palm oil and contributing to the socio-economic development of local communities.
Transportation logistics are optimized to minimize carbon emissions and ensure timely delivery of sustainable palm oil to consumers. This commitment to sustainability not only benefits the environment but also enhances brand image and consumer trust. The biofuel industry also relies heavily on palm oil, with biodiesel and bioethanol production contributing to the market's growth.
Market Dynamics
Our researchers analyzed the data with 2024 as the base year, along with the key drivers, trends, and challenges. A holistic analysis of drivers will help companies refine their marketing strategies to gain a competitive advantage.
What are the key market drivers leading to the rise in the adoption of Sustainable Palm Oil Industry?
- The increasing preference among consumers for trans-fat-free products serves as the primary market driver. The market has gained significant traction due to increasing health concerns and the perception that it is a healthier alternative to conventional edible oils. With the global prevalence of diabetes on the rise, approximately 589 million adults were living with the condition in 2024, representing 11% of the adult population. This number is projected to reach 853 million by 2050, with over 40% of these individuals being unaware of their condition. This trend is driving demand for sustainable palm oil, which is extracted using methods that prioritize biodiversity conservation, deforestation monitoring, wastewater treatment, and labor practices. This number is projected to increase to 643 million by 2030 and 783 million by 2045, encompassing both diagnosed and undiagnosed cases of type 1 and type 2 diabetes.
- Additionally, many organizations are setting renewable energy targets to reduce their carbon footprint and enhance their sustainability efforts. The food industry is a significant consumer of palm oil derivatives and is increasingly adopting sustainable sourcing practices to meet consumer demand and protect their brand reputation. Companies are implementing monitoring systems and community engagement initiatives to ensure sustainable sourcing, aligning their brand image with consumer values. Margarine, ice cream, and confectionery products are among the processed goods that increasingly rely on sustainable palm oil, while the biofuels sector continues to grapple with the environmental implications of palm oil production.
What are the market trends shaping the Sustainable Palm Oil Industry?
- Sustainable cultivation methods are gaining increasing popularity in the agricultural industry due to advancements in this field. The trend toward more environmentally friendly farming practices is expected to continue in the upcoming market. The market has experienced notable progress in implementing eco-friendly agricultural techniques, such as agroforestry, to enhance practices and boost yield. Agroforestry, a system that combines oil palm cultivation with various tree species, fosters biodiversity, ecological resilience, and improved soil health. This approach also contributes to carbon sequestration and additional income sources for farmers.
- Certification standards, such as those for sustainable palm oil production, ensure traceability systems, pest management, and product lifecycle assessments. These initiatives contribute to the overall sustainability of the palm oil industry, making it a responsible choice for businesses. Moreover, advancements in sustainable agriculture include social impact assessments, renewable energy usage in palm oil mills, and the establishment of circular economy principles through efficient storage facilities and waste management. The environmental perspective of sustainable palm oil production includes minimizing deforestation and habitat damage, reducing greenhouse gas emissions, and preserving peatlands.
What challenges does the Sustainable Palm Oil Industry face during its growth?
- The expansion of viable alternatives to sustainable palm oil poses a significant challenge to the industry's growth trajectory. The market faces challenges due to the availability of alternatives, such as sunflower oil, soybean oil, and rapeseed oil. These vegetable oils have gained popularity in various industries and product formulations due to consumer concerns regarding the environmental and social impacts of palm oil production. As a result, the increased utilization of these substitutes has led to a decline in demand for palm oil, including sustainable palm oil, in certain market segments. Sustainability certifications, such as RSPO (Roundtable on Sustainable Palm Oil), play a crucial role in addressing these concerns by promoting sustainable agricultural practices and peatland protection.
- However, the market dynamics are influenced by the environmental footprint of oil palm trees and land use change. Smallholder farmers contribute significantly to the palm oil industry, and implementing sustainable practices on their farms can help reduce the industry's overall impact. Palm oil has various applications, including animal feed and food applications, such as palm kernel oil and fresh fruit bunches. The demand for these applications may influence the market's growth trajectory. Palm oil plantations must balance economic viability with environmental sustainability to meet consumer demands and maintain their competitiveness in the market.
Exclusive Customer Landscape
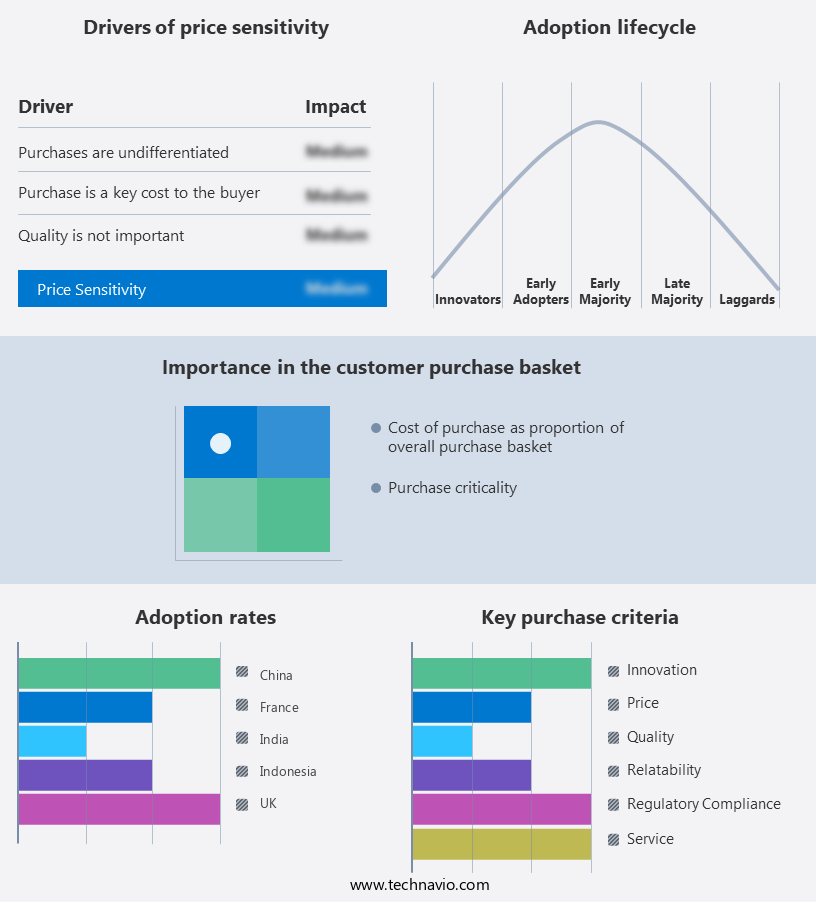
The sustainable palm oil market forecasting report includes the adoption lifecycle of the market, covering from the innovator's stage to the laggard's stage. It focuses on adoption rates in different regions based on penetration. Furthermore, the sustainable palm oil market report also includes key purchase criteria and drivers of price sensitivity to help companies evaluate and develop their market growth analysis strategies.
Customer Landscape
Key Companies & Market Insights
Companies are implementing various strategies, such as strategic alliances, sustainable palm oil market forecast, partnerships, mergers and acquisitions, geographical expansion, and product/service launches, to enhance their presence in the industry.
Asian Agri - The company specializes in providing a range of high-quality palm oil products, including Crude Palm Oil and Crude Palm Kernel Oil, to meet diverse industry requirements.
The industry research and growth report includes detailed analyses of the competitive landscape of the market and information about key companies, including:
- Asian Agri
- Astra Agro Lestari
- Beiersdorf AG
- Bumitama Agri Ltd.
- Bunge Global SA
- Cargill Inc.
- Clariant International Ltd.
- European Palm Oil Alliance
- Ferrero International S.A.
- First Resources Ltd.
- Genting Plantations BHD
- Golden Agri-Resources Ltd.
- Hap Seng Plantations Holdings BHD
- IOI Corp. BHD
- Kuala Lumpur Kepong BHD
- Musim Mas Group
- Sampoerna Agro
- Sarawak Oil Palms BHD
- Solidaridad Network Asia Ltd
- Unilever PLC
- United Plantations BHD
- Wilmar International Ltd.
Qualitative and quantitative analysis of companies has been conducted to help clients understand the wider business environment as well as the strengths and weaknesses of key industry players. Data is qualitatively analyzed to categorize companies as pure play, category-focused, industry-focused, and diversified; it is quantitatively analyzed to categorize companies as dominant, leading, strong, tentative, and weak.
Recent Development and News in Sustainable Palm Oil Market
- In January 2024, Unilever, a leading consumer goods company, announced its commitment to sourcing 100% sustainable palm oil by 2025, representing a significant increase from its previous target of 90% (Unilever Press Release, 2024). This pledge was made in collaboration with the Roundtable on Sustainable Palm Oil (RSPO), further emphasizing the organization's influence in driving market growth.
- In March 2024, Wilmar International, the world's largest palm oil processing and merchandising company, acquired a 50% stake in a new sustainable palm oil plantation in Indonesia, marking a strategic expansion into more sustainable production methods (Wilmar International Press Release, 2024). The project, which is expected to yield 25,000 metric tons of certified sustainable palm oil annually, is a major step towards addressing concerns over deforestation and environmental sustainability.
- In May 2024, Nestlé, the world's largest food and beverage company, signed a strategic partnership with the International Labor Rights Forum (ILRF) to improve labor conditions in the palm oil industry. This collaboration aimed to address issues such as forced labor, child labor, and other human rights concerns, demonstrating a commitment to ethical sourcing and sustainability (Nestlé Press Release, 2024).
- In April 2025, the European Union (EU) passed a regulation mandating the use of sustainable palm oil in all biofuels produced in the region, starting from 2026. This policy change is expected to significantly boost demand for sustainable palm oil, as it accounts for approximately 50% of the EU's biodiesel market (European Commission Press Release, 2025). This regulatory initiative further underscores the importance of sustainable palm oil in the global market.
Research Analyst Overview
Palm oil, a cash crop of significant economic development in rural communities, experiences dynamic market trends. Organic farming practices gain traction, addressing consumer demand for eco-friendly products. Risk management strategies are crucial in navigating price volatility and disease-resistant strains. Policy advocacy pushes for water-efficient irrigation and labeling standards, while certification schemes ensure improved livelihoods. Data analytics and blockchain technology enhance supply chain security, providing transparency and traceability. Fractionated palm oil and refined palm oil cater to various industries, including personal care and household products. Palm oil substitutes, such as alternative oils, gain ground due to genetic modification and carbon sequestration.
Efficiency improvements, like precision agriculture and high-yield varieties, reduce input costs. Public awareness campaigns promote the use of ecofriendly products and consumer education. Drone technology and remote sensing aid in climate change adaptation and habitat restoration. In the food industry, it is used in processed goods like margarine, baked goods, and confectionery products. The baking industry embraces palm oil's long shelf life and yield optimization. Policy makers and investors explore certification schemes and investment strategies to mitigate risks and promote sustainability. Palm oil's role in economic development remains vital, with ongoing research in disease resistance, yield optimization, and climate change adaptation.
Dive into Technavio's robust research methodology, blending expert interviews, extensive data synthesis, and validated models for unparalleled Sustainable Palm Oil Market insights. See full methodology.
|
Market Scope |
|
|
Report Coverage |
Details |
|
Page number |
221 |
|
Base year |
2024 |
|
Historic period |
2019-2023 |
|
Forecast period |
2025-2029 |
|
Growth momentum & CAGR |
Accelerate at a CAGR of 4.7% |
|
Market growth 2025-2029 |
USD 2.54 billion |
|
Market structure |
Fragmented |
|
YoY growth 2024-2025(%) |
4.4 |
|
Key countries |
Indonesia, India, China, Malaysia, US, Nigeria, France, Pakistan, UK, and Germany |
|
Competitive landscape |
Leading Companies, Market Positioning of Companies, Competitive Strategies, and Industry Risks |
What are the Key Data Covered in this Sustainable Palm Oil Market Research and Growth Report?
- CAGR of the Sustainable Palm Oil industry during the forecast period
- Detailed information on factors that will drive the growth and forecasting between 2025 and 2029
- Precise estimation of the size of the market and its contribution of the industry in focus to the parent market
- Accurate predictions about upcoming growth and trends and changes in consumer behaviour
- Growth of the market across APAC, Europe, Middle East and Africa, North America, and South America
- Thorough analysis of the market's competitive landscape and detailed information about companies
- Comprehensive analysis of factors that will challenge the sustainable palm oil market growth of industry companies
We can help! Our analysts can customize this sustainable palm oil market research report to meet your requirements.
 RIA -
RIA - 
