Sweet Snacks Market Analysis, Size, and Forecast 2026-2030: APAC (China, Japan, and India), Europe (Germany, UK, and France), North America (US, Canada, and Mexico), Middle East and Africa (Saudi Arabia, UAE, and South Africa), South America (Brazil, Argentina, and Colombia), and Rest of World (ROW)

Sweet Snacks Market Analysis, Size, and Forecast 2026-2030:
APAC (China, Japan, and India), Europe (Germany, UK, and France), North America (US, Canada, and Mexico), Middle East and Africa (Saudi Arabia, UAE, and South Africa), South America (Brazil, Argentina, and Colombia), and Rest of World (ROW)

Published: Dec 2025 308 Pages SKU: IRTNTR80103

Market Overview at a Glance

$132.4 B
Market Opportunity
7.3%
CAGR 2025 - 2030
37.9%
APAC Growth
$142.8 B
Cakes segment 2024

Sweet Snacks Market Size 2026-2030

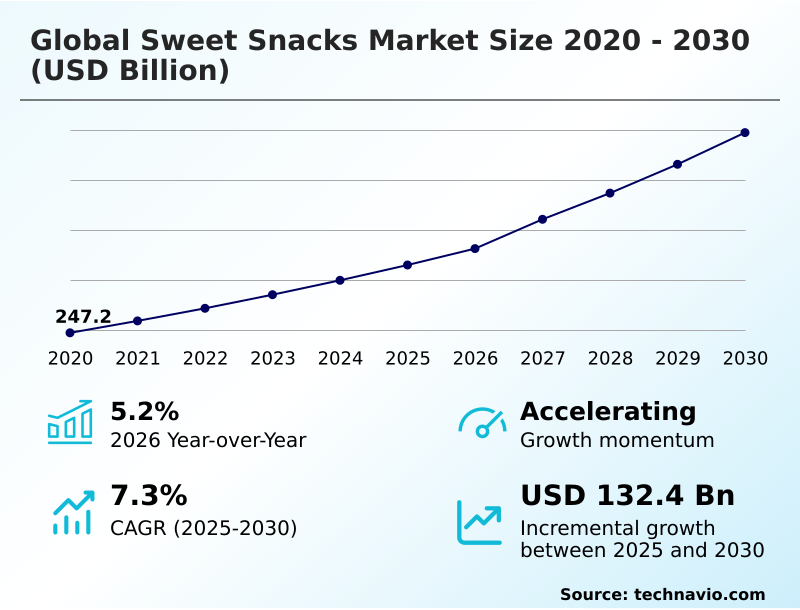
The sweet snacks market size is valued to increase by USD 132.4 billion, at a CAGR of 7.3% from 2025 to 2030. Pervasive influence of convenience and on-go consumption patterns will drive the sweet snacks market.

Major Market Trends & Insights

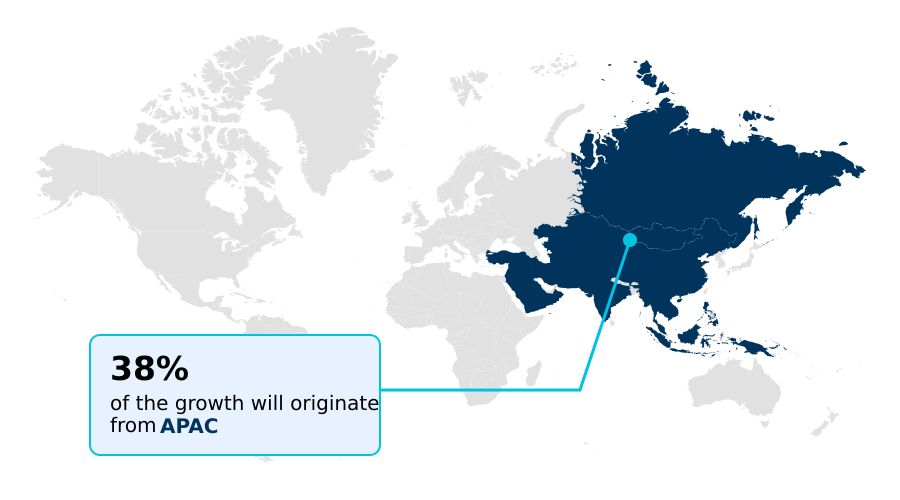
  • APAC dominated the market and accounted for a 37.9% growth during the forecast period.
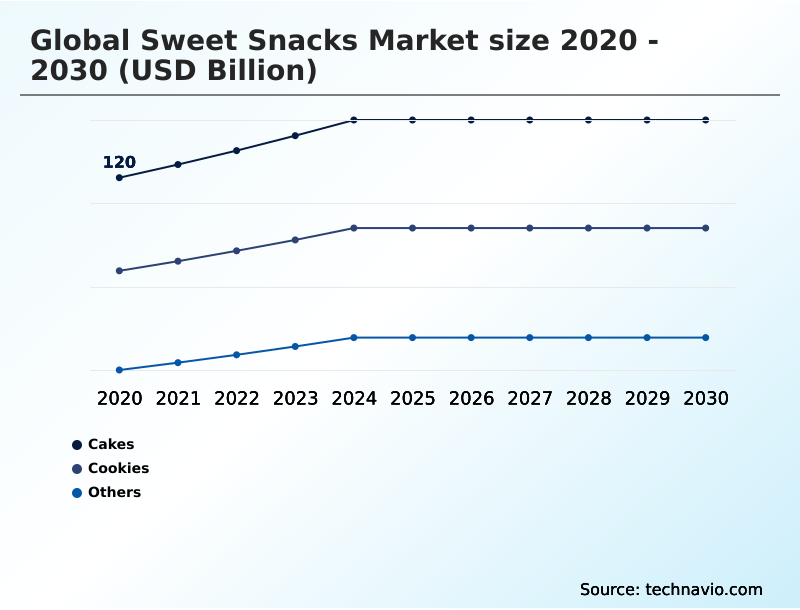
  • By Product - Cakes segment was valued at USD 142.8 billion in 2024
  • By Distribution Channel - Offline segment accounted for the largest market revenue share in 2024

Market Size & Forecast

  • Market Opportunities: USD 200.2 billion
  • Market Future Opportunities: USD 132.4 billion
  • CAGR from 2025 to 2030 : 7.3%

Market Summary

  • The sweet snacks market is defined by a core tension between consumer demand for permissible indulgence and the rising influence of health-conscious purchasing behaviors. This dynamic compels continuous innovation, moving beyond traditional formulations toward products featuring clean label ingredients, plant-based alternatives, and functional benefits.
  • In this landscape, manufacturers must navigate complex supply chains to ensure ethical sourcing and cost stability for key commodities. For instance, a confectioner aiming to launch a new premium chocolate line must secure a transparent and resilient supply of certified sustainable cocoa, manage volatile commodity prices through hedging strategies, and develop packaging that is both protective and environmentally responsible.
  • Success depends on harmonizing these operational imperatives with sophisticated marketing that communicates quality, taste, and wellness attributes to a discerning global audience. The market's trajectory is shaped by an ability to deliver on this multifaceted value proposition, where sensory appeal and responsible production are inextricably linked.

What will be the Size of the Sweet Snacks Market during the forecast period?

Get Key Insights on Market Forecast (PDF) Request Free Sample

How is the Sweet Snacks Market Segmented?

The sweet snacks industry research report provides comprehensive data (region-wise segment analysis), with forecasts and estimates in "USD billion" for the period 2026-2030, as well as historical data from 2020-2024 for the following segments.

  • Product
    • Cakes
    • Cookies
    • Others
  • Distribution channel
    • Offline
    • Online
  • Packaging
    • Bag and pouches
    • Boxes
    • Jars
    • Others
  • Geography
    • APAC
      • China
      • Japan
      • India
    • Europe
      • Germany
      • UK
      • France
    • North America
      • US
      • Canada
      • Mexico
    • Middle East and Africa
      • Saudi Arabia
      • UAE
      • South Africa
    • South America
      • Brazil
      • Argentina
      • Colombia
    • Rest of World (ROW)

By Product Insights

The cakes segment is estimated to witness significant growth during the forecast period.

The market is segmented by product, distribution channel, packaging, and geography. Within the product segment, the cakes category is transforming to meet demands for individual consumption occasions and permissible indulgence.

This shift is evident in the proliferation of single-serving formats and portion control packaging. Innovation is a key battleground, with a focus on clean label ingredients and artisanal production methods.

Health and wellness trends have created a robust market for specialized options, including reduced sugar formulations and gluten-free options, with projections indicating a category scale-up of nearly 50% over a five-year horizon.

Strategic imperatives include a focus on a circular packaging economy, utilizing compostable films and materials that support sustainable packaging innovation.

Request Free Sample

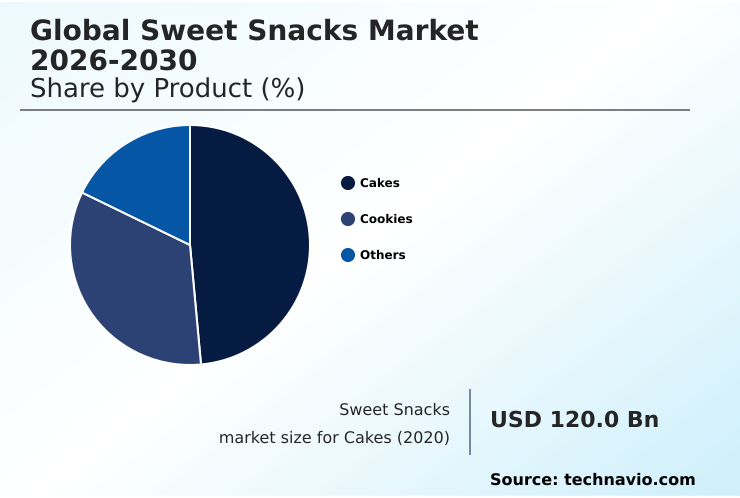
The Cakes segment was valued at USD 142.8 billion in 2024 and showed a gradual increase during the forecast period.

Request Free Sample

Regional Analysis

APAC is estimated to contribute 37.9% to the growth of the global market during the forecast period.Technavio’s analysts have elaborately explained the regional trends and drivers that shape the market during the forecast period.

See How Sweet Snacks Market Demand is Rising in APAC Request Free Sample

The geographic landscape is shifting, with APAC poised to contribute nearly 38% of the market's incremental expansion, outpacing North America's contribution by more than double. This is driven by demand for mindful snacking products and clean eating dessert trends.

In these regions, the emphasis on sustainable cocoa sourcing is intensifying, with brands leveraging food traceability technology to validate claims. Products featuring functional ingredients, along with gluten-free options and dairy-free alternatives made with clean label ingredients, are gaining traction.

A resilient supply chain management strategy is crucial for companies to manage commodity sourcing and distribution across these diverse, high-growth territories, where consumer preference for ethically produced goods is on the rise.

Market Dynamics

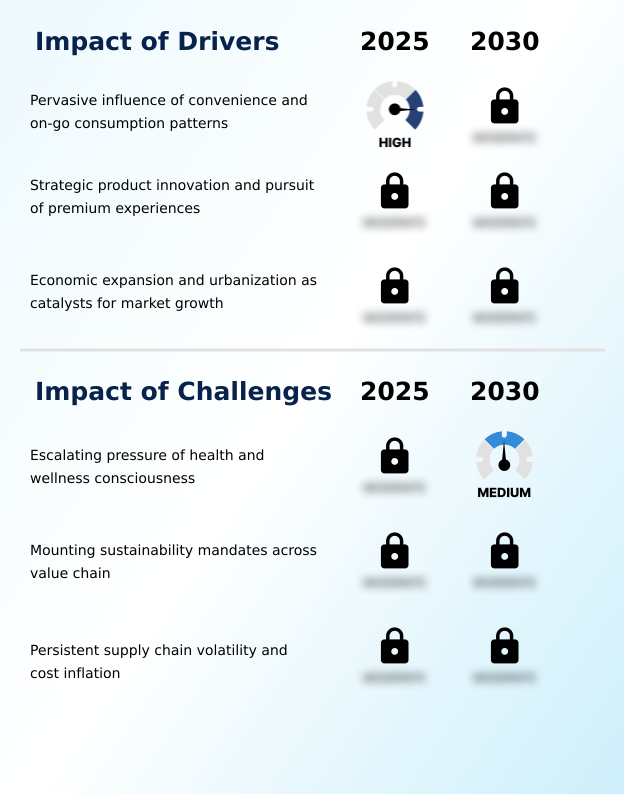
Our researchers analyzed the data with 2025 as the base year, along with the key drivers, trends, and challenges. A holistic analysis of drivers will help companies refine their marketing strategies to gain a competitive advantage.

  • Strategic decision-making in the sweet snacks market is increasingly complex, shaped by a confluence of regulatory, economic, and consumer-driven factors. Navigating the impact of sugar taxes on product pricing requires sophisticated modeling to maintain margins without alienating price-sensitive demographics.
  • This ties directly into the core challenge of balancing taste and nutrition in snacks, a task complicated by the strong consumer preference for natural ingredients. The parallel demand for portable snack packaging fuels innovation but also intersects with strategies for reducing packaging waste, a key pillar of corporate sustainability goals.
  • At the same time, the role of e-commerce in snack distribution is expanding, offering a direct channel to consumers but requiring new logistical capabilities. Operationally, the challenges in sustainable ingredient sourcing and the need to manage commodity price volatility in food production demand a resilient and transparent supply chain.
  • A company that successfully implements traceability can see a 10% improvement in supplier verification efficiency. Furthermore, the push toward navigating front-of-pack labeling regulations and fostering innovation in plant-based dessert recipes are no longer optional but essential for long-term relevance and market access.

What are the key market drivers leading to the rise in the adoption of Sweet Snacks Industry?

  • The market's primary driver is the pervasive influence of modern consumer lifestyles, which favor convenience and on-the-go consumption patterns.

  • Market growth is fundamentally driven by the alignment of products with modern lifestyles. The demand for convenient snacking solutions is paramount, leading to a proliferation of single-serving portions and ready-to-eat formats that facilitate on-the-go consumption.
  • This convenience factor is a strong impulse purchase driver, with sales from checkout displays accounting for up to 5% of a category's total revenue in certain retail environments.
  • Concurrently, a push toward premiumization is evident, as consumers gravitate toward artisanal production methods and premium ingredients. This creates a market for healthier indulgence options that do not compromise on taste.
  • However, this premium segment faces robust private label snack competition, which has matured to offer comparable quality at a lower price point, intensifying the need for continuous brand innovation.

What are the market trends shaping the Sweet Snacks Industry?

  • The profound shift toward a digitally integrated, multi-channel ecosystem is reshaping market dynamics. This includes the expansion of the digital shelf through e-commerce and disruptive direct-to-consumer channels.

  • Key trends are reshaping competitive dynamics, driven by a consumer search for novel experiences. Experiential consumption trends are fueling demand for products that offer sensory exploration, leveraging flavor globalization and multi-textural products. This is evident in the rise of co-branding food partnerships that create unique, limited-time offers.
  • The expansion of direct-to-consumer sweet snacks and subscription snack boxes has seen online channel growth outpace offline by a factor of nearly two in recent periods. Social commerce for food is also an emerging frontier, particularly for plant-based alternatives.
  • Packaging innovation focuses on functionality, with resealable pouches that cater to on-the-go lifestyles and a growing preference for sustainable options over traditional formats.

What challenges does the Sweet Snacks Industry face during its growth?

  • A key market challenge stems from the escalating pressure of global health and wellness consciousness, which scrutinizes the nutritional profile of traditional sweet snacks.

  • The primary market challenge is navigating the intersection of health regulations and consumer demand for transparency. The ingredient reformulation challenge is immense, as companies work to develop reduced sugar formulations using natural sweeteners without compromising taste.
  • This is compounded by the front-of-pack labeling impact, where regulations in several key markets, now covering over 25% of the population in some regions, mandate clear warnings on products high in sugar or fat. Furthermore, demands for ethical sourcing and a transparent supply chain are non-negotiable. Ethical ingredient procurement, backed by food traceability technology, is becoming a standard operational requirement.
  • On the sustainability front, companies are investing in mono-material structures and compostable films to move away from multi-layer plastics, which face recycling rates below 5% in many areas.

Exclusive Technavio Analysis on Customer Landscape

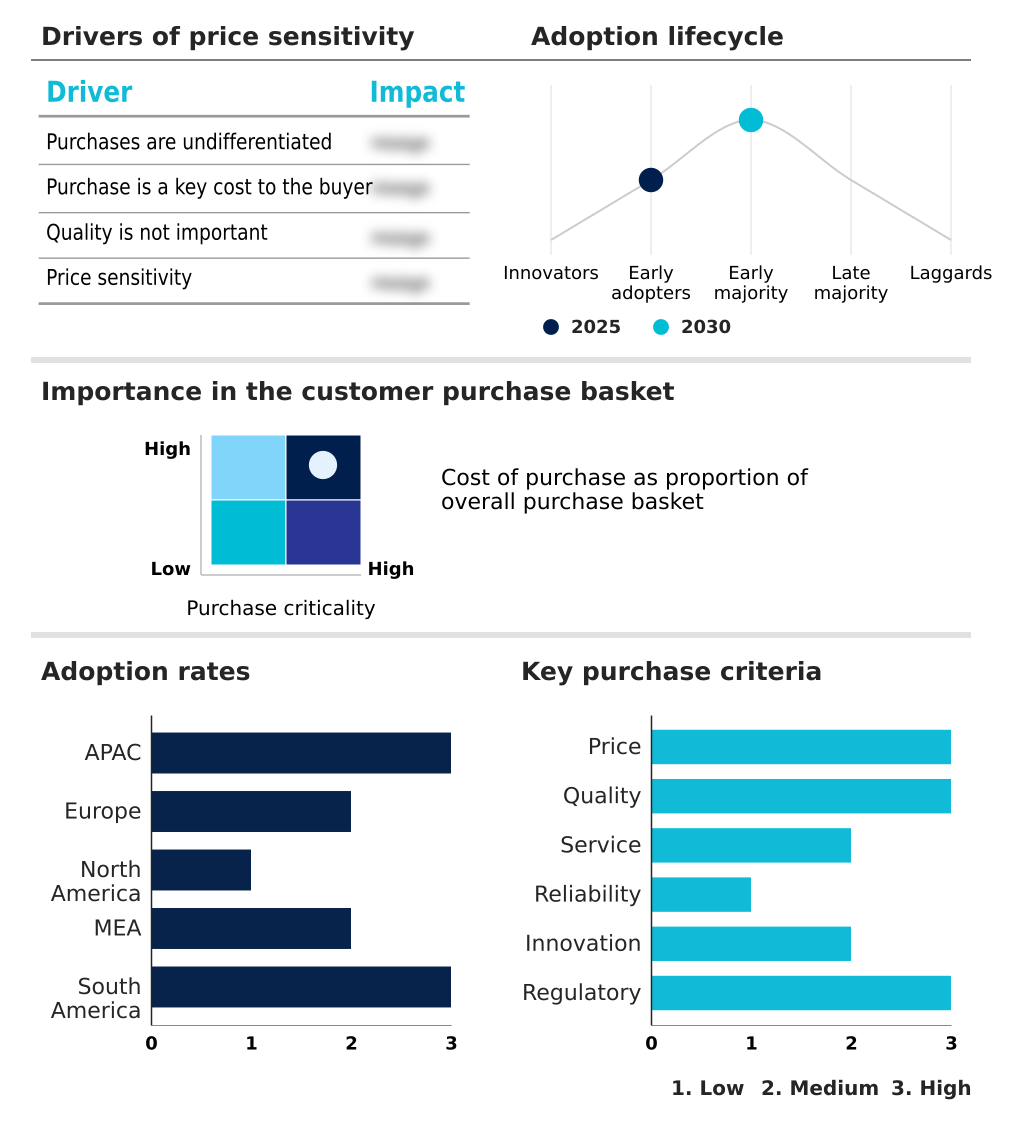
The sweet snacks market forecasting report includes the adoption lifecycle of the market, covering from the innovator’s stage to the laggard’s stage. It focuses on adoption rates in different regions based on penetration. Furthermore, the sweet snacks market report also includes key purchase criteria and drivers of price sensitivity to help companies evaluate and develop their market growth analysis strategies.

Customer Landscape of Sweet Snacks Industry

Competitive Landscape

Companies are implementing various strategies, such as strategic alliances, sweet snacks market forecast, partnerships, mergers and acquisitions, geographical expansion, and product/service launches, to enhance their presence in the industry.

Blue Diamond Growers - Key offerings focus on balancing permissible indulgence with healthier attributes, featuring clean label ingredients, functional benefits, and innovative formats designed for on-the-go consumption and sensory exploration.

The industry research and growth report includes detailed analyses of the competitive landscape of the market and information about key companies, including:

  • Blue Diamond Growers
  • Calbee Inc.
  • Campbell Soup Co.
  • Conagra Brands Inc.
  • Ferrero International S.A.
  • General Mills Inc.
  • Haldiram Snacks Food Pvt. Ltd.
  • HARIBO GmbH and Co. KG
  • Jelly Belly Candy Co.
  • Lindt and Sprungli AG
  • Mars Inc.
  • Mondelez International Inc.
  • Nestle SA
  • Palmer Candy Co.
  • PepsiCo Inc.
  • The Hain Celestial Group
  • The Hershey Co.
  • Unilever PLC
  • Universal Robina Corp.
  • WK Kellogg Co

Qualitative and quantitative analysis of companies has been conducted to help clients understand the wider business environment as well as the strengths and weaknesses of key industry players. Data is qualitatively analyzed to categorize companies as pure play, category-focused, industry-focused, and diversified; it is quantitatively analyzed to categorize companies as dominant, leading, strong, tentative, and weak.

Recent Development and News in Sweet snacks market

  • In November 2024, Mondelez International announced a major investment of over $480 million to expand its manufacturing capabilities and build a new chocolate factory in India, underscoring the strategic importance of the APAC market.
  • In January 2025, Hostess Brands LLC introduced Meltamors, a soft cake with a melting center designed to be microwaved, tapping into the consumer trend of experiential consumption and at-home indulgence.
  • In September 2024, Mondelez International released the limited-edition Oreo Black and White Cookie, a culturally resonant innovation inspired by the iconic New York City delicacy to drive short-term sales and brand affinity.
  • In April 2025, Krispy Kreme Inc. and Mars Inc. collaborated to launch a new collection of M&M'S-topped doughnuts, demonstrating a synergistic co-branding strategy to create buzzworthy products in the fresh bakery space.

Dive into Technavio’s robust research methodology, blending expert interviews, extensive data synthesis, and validated models for unparalleled Sweet Snacks Market insights. See full methodology.

Market Scope
Page number 308
Base year 2025
Historic period 2020-2024
Forecast period 2026-2030
Growth momentum & CAGR Accelerate at a CAGR of 7.3%
Market growth 2026-2030 USD 132.4 billion
Market structure Fragmented
YoY growth 2025-2026(%) 5.2%
Key countries China, Japan, India, South Korea, Australia, Indonesia, Germany, UK, France, Italy, Spain, The Netherlands, US, Canada, Mexico, Saudi Arabia, UAE, South Africa, Israel, Turkey, Brazil, Argentina and Colombia
Competitive landscape Leading Companies, Market Positioning of Companies, Competitive Strategies, and Industry Risks

Request Free Sample

Research Analyst Overview

  • The sweet snacks market operates on a complex axis, balancing permissible indulgence with health-driven innovation. Boardroom decisions are increasingly influenced by the need for portfolio diversification to include plant-based alternatives and reduced sugar formulations, driven by a consumer shift toward functional ingredients and clean label ingredients.
  • The demand for on-the-go consumption has institutionalized formats like single-serving portions and ready-to-eat formats in resealable pouches, necessitating investment in specialized portion control packaging. At the same time, the push for ethical sourcing and a circular packaging economy is reshaping supply chains.
  • Manufacturers are now investing in sustainable cocoa sourcing and mono-material structures, with some achieving a 15% reduction in non-recyclable material usage. Success hinges on a brand's ability to integrate premium ingredients into multi-textural products that also offer high protein content or high fiber content, meeting the nuanced expectations of the modern consumer.

What are the Key Data Covered in this Sweet Snacks Market Research and Growth Report?

  • What is the expected growth of the Sweet Snacks Market between 2026 and 2030?

    • USD 132.4 billion, at a CAGR of 7.3%

  • What segmentation does the market report cover?

    • The report is segmented by Product (Cakes, Cookies, and Others), Distribution Channel (Offline, and Online), Packaging (Bag and pouches, Boxes, Jars, and Others) and Geography (APAC, Europe, North America, Middle East and Africa, South America)

  • Which regions are analyzed in the report?

    • APAC, Europe, North America, Middle East and Africa and South America

  • What are the key growth drivers and market challenges?

    • Pervasive influence of convenience and on-go consumption patterns, Escalating pressure of health and wellness consciousness

  • Who are the major players in the Sweet Snacks Market?

    • Blue Diamond Growers, Calbee Inc., Campbell Soup Co., Conagra Brands Inc., Ferrero International S.A., General Mills Inc., Haldiram Snacks Food Pvt. Ltd., HARIBO GmbH and Co. KG, Jelly Belly Candy Co., Lindt and Sprungli AG, Mars Inc., Mondelez International Inc., Nestle SA, Palmer Candy Co., PepsiCo Inc., The Hain Celestial Group, The Hershey Co., Unilever PLC, Universal Robina Corp. and WK Kellogg Co

Market Research Insights

  • Market dynamics are increasingly shaped by shifting consumer values and retail channel evolution. The rise of private label snack competition has captured significant retail share, with some chains seeing own-brand sales expand by over 15% in key categories. This pressures established brands, whose marketing ROI is 1.8 times higher when leveraging impulse purchase drivers at checkout.
  • As consumers seek healthier indulgence options and convenient snacking solutions, the direct-to-consumer model gains traction, offering brands a channel for fostering loyalty and gathering valuable first-party data. Navigating this landscape requires a sophisticated understanding of these competitive pressures and evolving paths to purchase.

We can help! Our analysts can customize this sweet snacks market research report to meet your requirements.

Get in touch

1. Executive Summary

1.1 Market overview

Executive Summary - Chart on Market Overview
Executive Summary - Data Table on Market Overview
Executive Summary - Chart on Global Market Characteristics
Executive Summary - Chart on Market by Geography
Executive Summary - Chart on Market Segmentation by Product
Executive Summary - Chart on Market Segmentation by Distribution Channel
Executive Summary - Chart on Market Segmentation by Packaging
Executive Summary - Chart on Incremental Growth
Executive Summary - Data Table on Incremental Growth
Executive Summary - Chart on Company Market Positioning

2. Technavio Analysis

2.1 Analysis of price sensitivity, lifecycle, customer purchase basket, adoption rates, and purchase criteria

2.2 Criticality of inputs and Factors of differentiation

Chart on Overview on criticality of inputs and factors of differentiation

2.3 Factors of disruption

Chart on Overview on factors of disruption

2.4 Impact of drivers and challenges

Chart on Impact of drivers and challenges in 2025 and 2030

3. Market Landscape

3.1 Market ecosystem

Chart on Parent Market
Data Table on - Parent Market

3.2 Market characteristics

Chart on Market characteristics analysis

3.3 Value chain analysis

Chart on Value chain analysis

4. Market Sizing

4.1 Market definition

Data Table on Offerings of companies included in the market definition

4.2 Market segment analysis

Market segments

4.3 Market size 2025

4.4 Market outlook: Forecast for 2025-2030

Chart on Global - Market size and forecast 2025-2030 ($ billion)
Data Table on Global - Market size and forecast 2025-2030 ($ billion)
Chart on Global Market: Year-over-year growth 2025-2030 (%)
Data Table on Global Market: Year-over-year growth 2025-2030 (%)

5. Historic Market Size

5.1 Global Sweet Snacks Market 2020 - 2024

Historic Market Size - Data Table on Global Sweet Snacks Market 2020 - 2024 ($ billion)

5.2 Product segment analysis 2020 - 2024

Historic Market Size - Product Segment 2020 - 2024 ($ billion)

5.3 Distribution Channel segment analysis 2020 - 2024

Historic Market Size - Distribution Channel Segment 2020 - 2024 ($ billion)

5.4 Packaging segment analysis 2020 - 2024

Historic Market Size - Packaging Segment 2020 - 2024 ($ billion)

5.5 Geography segment analysis 2020 - 2024

Historic Market Size - Geography Segment 2020 - 2024 ($ billion)

5.6 Country segment analysis 2020 - 2024

Historic Market Size - Country Segment 2020 - 2024 ($ billion)

6. Qualitative Analysis

6.1 The AI impact on global sweet snacks market

7. Five Forces Analysis

7.1 Five forces summary

Five forces analysis - Comparison between 2025 and 2030

7.2 Bargaining power of buyers

Bargaining power of buyers - Impact of key factors 2025 and 2030

7.3 Bargaining power of suppliers

Bargaining power of suppliers - Impact of key factors in 2025 and 2030

7.4 Threat of new entrants

Threat of new entrants - Impact of key factors in 2025 and 2030

7.5 Threat of substitutes

Threat of substitutes - Impact of key factors in 2025 and 2030

7.6 Threat of rivalry

Threat of rivalry - Impact of key factors in 2025 and 2030

7.7 Market condition

Chart on Market condition - Five forces 2025 and 2030

8. Market Segmentation by Product

8.1 Market segments

Chart on Product - Market share 2025-2030 (%)
Data Table on Product - Market share 2025-2030 (%)

8.2 Comparison by Product

Chart on Comparison by Product
Data Table on Comparison by Product

8.3 Cakes - Market size and forecast 2025-2030

Chart on Cakes - Market size and forecast 2025-2030 ($ billion)
Data Table on Cakes - Market size and forecast 2025-2030 ($ billion)
Chart on Cakes - Year-over-year growth 2025-2030 (%)
Data Table on Cakes - Year-over-year growth 2025-2030 (%)

8.4 Cookies - Market size and forecast 2025-2030

Chart on Cookies - Market size and forecast 2025-2030 ($ billion)
Data Table on Cookies - Market size and forecast 2025-2030 ($ billion)
Chart on Cookies - Year-over-year growth 2025-2030 (%)
Data Table on Cookies - Year-over-year growth 2025-2030 (%)

8.5 Others - Market size and forecast 2025-2030

Chart on Others - Market size and forecast 2025-2030 ($ billion)
Data Table on Others - Market size and forecast 2025-2030 ($ billion)
Chart on Others - Year-over-year growth 2025-2030 (%)
Data Table on Others - Year-over-year growth 2025-2030 (%)

8.6 Market opportunity by Product

Market opportunity by Product ($ billion)
Data Table on Market opportunity by Product ($ billion)

9. Market Segmentation by Distribution Channel

9.1 Market segments

Chart on Distribution Channel - Market share 2025-2030 (%)
Data Table on Distribution Channel - Market share 2025-2030 (%)

9.2 Comparison by Distribution Channel

Chart on Comparison by Distribution Channel
Data Table on Comparison by Distribution Channel

9.3 Offline - Market size and forecast 2025-2030

Chart on Offline - Market size and forecast 2025-2030 ($ billion)
Data Table on Offline - Market size and forecast 2025-2030 ($ billion)
Chart on Offline - Year-over-year growth 2025-2030 (%)
Data Table on Offline - Year-over-year growth 2025-2030 (%)

9.4 Online - Market size and forecast 2025-2030

Chart on Online - Market size and forecast 2025-2030 ($ billion)
Data Table on Online - Market size and forecast 2025-2030 ($ billion)
Chart on Online - Year-over-year growth 2025-2030 (%)
Data Table on Online - Year-over-year growth 2025-2030 (%)

9.5 Market opportunity by Distribution Channel

Market opportunity by Distribution Channel ($ billion)
Data Table on Market opportunity by Distribution Channel ($ billion)

10. Market Segmentation by Packaging

10.1 Market segments

Chart on Packaging - Market share 2025-2030 (%)
Data Table on Packaging - Market share 2025-2030 (%)

10.2 Comparison by Packaging

Chart on Comparison by Packaging
Data Table on Comparison by Packaging

10.3 Bag and pouches - Market size and forecast 2025-2030

Chart on Bag and pouches - Market size and forecast 2025-2030 ($ billion)
Data Table on Bag and pouches - Market size and forecast 2025-2030 ($ billion)
Chart on Bag and pouches - Year-over-year growth 2025-2030 (%)
Data Table on Bag and pouches - Year-over-year growth 2025-2030 (%)

10.4 Boxes - Market size and forecast 2025-2030

Chart on Boxes - Market size and forecast 2025-2030 ($ billion)
Data Table on Boxes - Market size and forecast 2025-2030 ($ billion)
Chart on Boxes - Year-over-year growth 2025-2030 (%)
Data Table on Boxes - Year-over-year growth 2025-2030 (%)

10.5 Jars - Market size and forecast 2025-2030

Chart on Jars - Market size and forecast 2025-2030 ($ billion)
Data Table on Jars - Market size and forecast 2025-2030 ($ billion)
Chart on Jars - Year-over-year growth 2025-2030 (%)
Data Table on Jars - Year-over-year growth 2025-2030 (%)

10.6 Others - Market size and forecast 2025-2030

Chart on Others - Market size and forecast 2025-2030 ($ billion)
Data Table on Others - Market size and forecast 2025-2030 ($ billion)
Chart on Others - Year-over-year growth 2025-2030 (%)
Data Table on Others - Year-over-year growth 2025-2030 (%)

10.7 Market opportunity by Packaging

Market opportunity by Packaging ($ billion)
Data Table on Market opportunity by Packaging ($ billion)

11. Customer Landscape

11.1 Customer landscape overview

Analysis of price sensitivity, lifecycle, customer purchase basket, adoption rates, and purchase criteria

12. Geographic Landscape

12.1 Geographic segmentation

Chart on Market share by geography 2025-2030 (%)
Data Table on Market share by geography 2025-2030 (%)

12.2 Geographic comparison

Chart on Geographic comparison
Data Table on Geographic comparison

12.3 APAC - Market size and forecast 2025-2030

Chart on APAC - Market size and forecast 2025-2030 ($ billion)
Data Table on APAC - Market size and forecast 2025-2030 ($ billion)
Chart on APAC - Year-over-year growth 2025-2030 (%)
Data Table on APAC - Year-over-year growth 2025-2030 (%)
Chart on Regional Comparison - APAC
Data Table on Regional Comparison - APAC

12.3.1 China - Market size and forecast 2025-2030

Chart on China - Market size and forecast 2025-2030 ($ billion)
Data Table on China - Market size and forecast 2025-2030 ($ billion)
Chart on China - Year-over-year growth 2025-2030 (%)
Data Table on China - Year-over-year growth 2025-2030 (%)

12.3.2 Japan - Market size and forecast 2025-2030

Chart on Japan - Market size and forecast 2025-2030 ($ billion)
Data Table on Japan - Market size and forecast 2025-2030 ($ billion)
Chart on Japan - Year-over-year growth 2025-2030 (%)
Data Table on Japan - Year-over-year growth 2025-2030 (%)

12.3.3 India - Market size and forecast 2025-2030

Chart on India - Market size and forecast 2025-2030 ($ billion)
Data Table on India - Market size and forecast 2025-2030 ($ billion)
Chart on India - Year-over-year growth 2025-2030 (%)
Data Table on India - Year-over-year growth 2025-2030 (%)

12.3.4 South Korea - Market size and forecast 2025-2030

Chart on South Korea - Market size and forecast 2025-2030 ($ billion)
Data Table on South Korea - Market size and forecast 2025-2030 ($ billion)
Chart on South Korea - Year-over-year growth 2025-2030 (%)
Data Table on South Korea - Year-over-year growth 2025-2030 (%)

12.3.5 Australia - Market size and forecast 2025-2030

Chart on Australia - Market size and forecast 2025-2030 ($ billion)
Data Table on Australia - Market size and forecast 2025-2030 ($ billion)
Chart on Australia - Year-over-year growth 2025-2030 (%)
Data Table on Australia - Year-over-year growth 2025-2030 (%)

12.3.6 Indonesia - Market size and forecast 2025-2030

Chart on Indonesia - Market size and forecast 2025-2030 ($ billion)
Data Table on Indonesia - Market size and forecast 2025-2030 ($ billion)
Chart on Indonesia - Year-over-year growth 2025-2030 (%)
Data Table on Indonesia - Year-over-year growth 2025-2030 (%)

12.4 Europe - Market size and forecast 2025-2030

Chart on Europe - Market size and forecast 2025-2030 ($ billion)
Data Table on Europe - Market size and forecast 2025-2030 ($ billion)
Chart on Europe - Year-over-year growth 2025-2030 (%)
Data Table on Europe - Year-over-year growth 2025-2030 (%)
Chart on Regional Comparison - Europe
Data Table on Regional Comparison - Europe

12.4.1 Germany - Market size and forecast 2025-2030

Chart on Germany - Market size and forecast 2025-2030 ($ billion)
Data Table on Germany - Market size and forecast 2025-2030 ($ billion)
Chart on Germany - Year-over-year growth 2025-2030 (%)
Data Table on Germany - Year-over-year growth 2025-2030 (%)

12.4.2 UK - Market size and forecast 2025-2030

Chart on UK - Market size and forecast 2025-2030 ($ billion)
Data Table on UK - Market size and forecast 2025-2030 ($ billion)
Chart on UK - Year-over-year growth 2025-2030 (%)
Data Table on UK - Year-over-year growth 2025-2030 (%)

12.4.3 France - Market size and forecast 2025-2030

Chart on France - Market size and forecast 2025-2030 ($ billion)
Data Table on France - Market size and forecast 2025-2030 ($ billion)
Chart on France - Year-over-year growth 2025-2030 (%)
Data Table on France - Year-over-year growth 2025-2030 (%)

12.4.4 Italy - Market size and forecast 2025-2030

Chart on Italy - Market size and forecast 2025-2030 ($ billion)
Data Table on Italy - Market size and forecast 2025-2030 ($ billion)
Chart on Italy - Year-over-year growth 2025-2030 (%)
Data Table on Italy - Year-over-year growth 2025-2030 (%)

12.4.5 Spain - Market size and forecast 2025-2030

Chart on Spain - Market size and forecast 2025-2030 ($ billion)
Data Table on Spain - Market size and forecast 2025-2030 ($ billion)
Chart on Spain - Year-over-year growth 2025-2030 (%)
Data Table on Spain - Year-over-year growth 2025-2030 (%)

12.4.6 The Netherlands - Market size and forecast 2025-2030

Chart on The Netherlands - Market size and forecast 2025-2030 ($ billion)
Data Table on The Netherlands - Market size and forecast 2025-2030 ($ billion)
Chart on The Netherlands - Year-over-year growth 2025-2030 (%)
Data Table on The Netherlands - Year-over-year growth 2025-2030 (%)

12.5 North America - Market size and forecast 2025-2030

Chart on North America - Market size and forecast 2025-2030 ($ billion)
Data Table on North America - Market size and forecast 2025-2030 ($ billion)
Chart on North America - Year-over-year growth 2025-2030 (%)
Data Table on North America - Year-over-year growth 2025-2030 (%)
Chart on Regional Comparison - North America
Data Table on Regional Comparison - North America

12.5.1 US - Market size and forecast 2025-2030

Chart on US - Market size and forecast 2025-2030 ($ billion)
Data Table on US - Market size and forecast 2025-2030 ($ billion)
Chart on US - Year-over-year growth 2025-2030 (%)
Data Table on US - Year-over-year growth 2025-2030 (%)

12.5.2 Canada - Market size and forecast 2025-2030

Chart on Canada - Market size and forecast 2025-2030 ($ billion)
Data Table on Canada - Market size and forecast 2025-2030 ($ billion)
Chart on Canada - Year-over-year growth 2025-2030 (%)
Data Table on Canada - Year-over-year growth 2025-2030 (%)

12.5.3 Mexico - Market size and forecast 2025-2030

Chart on Mexico - Market size and forecast 2025-2030 ($ billion)
Data Table on Mexico - Market size and forecast 2025-2030 ($ billion)
Chart on Mexico - Year-over-year growth 2025-2030 (%)
Data Table on Mexico - Year-over-year growth 2025-2030 (%)

12.6 Middle East and Africa - Market size and forecast 2025-2030

Chart on Middle East and Africa - Market size and forecast 2025-2030 ($ billion)
Data Table on Middle East and Africa - Market size and forecast 2025-2030 ($ billion)
Chart on Middle East and Africa - Year-over-year growth 2025-2030 (%)
Data Table on Middle East and Africa - Year-over-year growth 2025-2030 (%)
Chart on Regional Comparison - Middle East and Africa
Data Table on Regional Comparison - Middle East and Africa

12.6.1 Saudi Arabia - Market size and forecast 2025-2030

Chart on Saudi Arabia - Market size and forecast 2025-2030 ($ billion)
Data Table on Saudi Arabia - Market size and forecast 2025-2030 ($ billion)
Chart on Saudi Arabia - Year-over-year growth 2025-2030 (%)
Data Table on Saudi Arabia - Year-over-year growth 2025-2030 (%)

12.6.2 UAE - Market size and forecast 2025-2030

Chart on UAE - Market size and forecast 2025-2030 ($ billion)
Data Table on UAE - Market size and forecast 2025-2030 ($ billion)
Chart on UAE - Year-over-year growth 2025-2030 (%)
Data Table on UAE - Year-over-year growth 2025-2030 (%)

12.6.3 South Africa - Market size and forecast 2025-2030

Chart on South Africa - Market size and forecast 2025-2030 ($ billion)
Data Table on South Africa - Market size and forecast 2025-2030 ($ billion)
Chart on South Africa - Year-over-year growth 2025-2030 (%)
Data Table on South Africa - Year-over-year growth 2025-2030 (%)

12.6.4 Israel - Market size and forecast 2025-2030

Chart on Israel - Market size and forecast 2025-2030 ($ billion)
Data Table on Israel - Market size and forecast 2025-2030 ($ billion)
Chart on Israel - Year-over-year growth 2025-2030 (%)
Data Table on Israel - Year-over-year growth 2025-2030 (%)

12.6.5 Turkey - Market size and forecast 2025-2030

Chart on Turkey - Market size and forecast 2025-2030 ($ billion)
Data Table on Turkey - Market size and forecast 2025-2030 ($ billion)
Chart on Turkey - Year-over-year growth 2025-2030 (%)
Data Table on Turkey - Year-over-year growth 2025-2030 (%)

12.7 South America - Market size and forecast 2025-2030

Chart on South America - Market size and forecast 2025-2030 ($ billion)
Data Table on South America - Market size and forecast 2025-2030 ($ billion)
Chart on South America - Year-over-year growth 2025-2030 (%)
Data Table on South America - Year-over-year growth 2025-2030 (%)
Chart on Regional Comparison - South America
Data Table on Regional Comparison - South America

12.7.1 Brazil - Market size and forecast 2025-2030

Chart on Brazil - Market size and forecast 2025-2030 ($ billion)
Data Table on Brazil - Market size and forecast 2025-2030 ($ billion)
Chart on Brazil - Year-over-year growth 2025-2030 (%)
Data Table on Brazil - Year-over-year growth 2025-2030 (%)

12.7.2 Argentina - Market size and forecast 2025-2030

Chart on Argentina - Market size and forecast 2025-2030 ($ billion)
Data Table on Argentina - Market size and forecast 2025-2030 ($ billion)
Chart on Argentina - Year-over-year growth 2025-2030 (%)
Data Table on Argentina - Year-over-year growth 2025-2030 (%)

12.7.3 Colombia - Market size and forecast 2025-2030

Chart on Colombia - Market size and forecast 2025-2030 ($ billion)
Data Table on Colombia - Market size and forecast 2025-2030 ($ billion)
Chart on Colombia - Year-over-year growth 2025-2030 (%)
Data Table on Colombia - Year-over-year growth 2025-2030 (%)

12.8 Market opportunity by geography

Market opportunity by geography ($ billion)
Data Tables on Market opportunity by geography ($ billion)

13. Drivers, Challenges, and Opportunity

13.1 Market drivers

Pervasive influence of convenience and on-go consumption patterns
Strategic product innovation and pursuit of premium experiences
Economic expansion and urbanization as catalysts for market growth

13.2 Market challenges

Escalating pressure of health and wellness consciousness
Mounting sustainability mandates across value chain
Persistent supply chain volatility and cost inflation

13.3 Impact of drivers and challenges

Impact of drivers and challenges in 2025 and 2030

13.4 Market opportunities

Digital shelf of e-commerce and direct-to-consumer channel disruption
Experiential consumption like sensory exploration and flavor globalization
Conscientious of consumer ascendancy of plant-based and ethical snacking

14. Competitive Landscape

14.1 Overview

14.2

Overview on criticality of inputs and factors of differentiation

14.3 Landscape disruption

Overview on factors of disruption

14.4 Industry risks

Impact of key risks on business

15. Competitive Analysis

15.1 Companies profiled

Companies covered

15.2 Company ranking index

15.3 Market positioning of companies

Matrix on companies position and classification

15.4 Calbee Inc.

Calbee Inc. - Overview
Calbee Inc. - Product / Service
Calbee Inc. - Key offerings
SWOT

15.5 Campbell Soup Co.

Campbell Soup Co. - Overview
Campbell Soup Co. - Business segments
Campbell Soup Co. - Key news
Campbell Soup Co. - Key offerings
Campbell Soup Co. - Segment focus
SWOT

15.6 Conagra Brands Inc.

Conagra Brands Inc. - Overview
Conagra Brands Inc. - Business segments
Conagra Brands Inc. - Key news
Conagra Brands Inc. - Key offerings
Conagra Brands Inc. - Segment focus
SWOT

15.7 Ferrero International S.A.

Ferrero International S.A. - Overview
Ferrero International S.A. - Product / Service
Ferrero International S.A. - Key news
Ferrero International S.A. - Key offerings
SWOT

15.8 General Mills Inc.

General Mills Inc. - Overview
General Mills Inc. - Business segments
General Mills Inc. - Key news
General Mills Inc. - Key offerings
General Mills Inc. - Segment focus
SWOT

15.9 Haldiram Snacks Food Pvt. Ltd.

Haldiram Snacks Food Pvt. Ltd. - Overview
Haldiram Snacks Food Pvt. Ltd. - Product / Service
Haldiram Snacks Food Pvt. Ltd. - Key offerings
SWOT

15.10 HARIBO GmbH and Co. KG

HARIBO GmbH and Co. KG - Overview
HARIBO GmbH and Co. KG - Product / Service
HARIBO GmbH and Co. KG - Key offerings
SWOT

15.11 Lindt and Sprungli AG

Lindt and Sprungli AG - Overview
Lindt and Sprungli AG - Business segments
Lindt and Sprungli AG - Key news
Lindt and Sprungli AG - Key offerings
Lindt and Sprungli AG - Segment focus
SWOT

15.12 Mondelez International Inc.

Mondelez International Inc. - Overview
Mondelez International Inc. - Business segments
Mondelez International Inc. - Key news
Mondelez International Inc. - Key offerings
Mondelez International Inc. - Segment focus
SWOT

15.13 Nestle SA

Nestle SA - Overview
Nestle SA - Business segments
Nestle SA - Key news
Nestle SA - Key offerings
Nestle SA - Segment focus
SWOT

15.14 PepsiCo Inc.

PepsiCo Inc. - Overview
PepsiCo Inc. - Business segments
PepsiCo Inc. - Key news
PepsiCo Inc. - Key offerings
PepsiCo Inc. - Segment focus
SWOT

15.15 The Hain Celestial Group

The Hain Celestial Group - Overview
The Hain Celestial Group - Business segments
The Hain Celestial Group - Key news
The Hain Celestial Group - Key offerings
The Hain Celestial Group - Segment focus
SWOT

15.16 The Hershey Co.

The Hershey Co. - Overview
The Hershey Co. - Business segments
The Hershey Co. - Key news
The Hershey Co. - Key offerings
The Hershey Co. - Segment focus
SWOT

15.17 Unilever PLC

Unilever PLC - Overview
Unilever PLC - Business segments
Unilever PLC - Key offerings
Unilever PLC - Segment focus
SWOT

15.18 WK Kellogg Co

WK Kellogg Co - Overview
WK Kellogg Co - Product / Service
WK Kellogg Co - Key offerings
SWOT

16. Appendix

16.1 Scope of the report

Market definition
Objectives
Notes and caveats

16.2 Inclusions and exclusions checklist

Inclusions checklist
Exclusions checklist

16.3 Currency conversion rates for US$

16.4 Research methodology

16.5 Data procurement

Information sources

16.6 Data validation

16.7 Validation techniques employed for market sizing

16.8 Data synthesis

16.9 360 degree market analysis

16.10 List of abbreviations

Research Methodology

Technavio presents a detailed picture of the market by way of study, synthesis, and summation of data from multiple sources. The analysts have presented the various facets of the market with a particular focus on identifying the key industry influencers. The data thus presented is comprehensive, reliable, and the result of extensive research, both primary and secondary.

INFORMATION SOURCES

Primary sources

  • Manufacturers and suppliers
  • Channel partners
  • Industry experts
  • Strategic decision makers

Secondary sources

  • Industry journals and periodicals
  • Government data
  • Financial reports of key industry players
  • Historical data
  • Press releases

DATA ANALYSIS

Data Synthesis

  • Collation of data
  • Estimation of key figures
  • Analysis of derived insights

Data Validation

  • Triangulation with data models
  • Reference against proprietary databases
  • Corroboration with industry experts

REPORT WRITING

Qualitative

  • Market drivers
  • Market challenges
  • Market trends
  • Five forces analysis

Quantitative

  • Market size and forecast
  • Market segmentation
  • Geographical insights
  • Competitive landscape

Interested in this report?

Get your sample now to see our research methodology and insights!

Download Now

Frequently Asked Questions

Sweet Snacks market growth will increase by USD 132.4 billion during 2026-2030 .

The Sweet Snacks market is expected to grow at a CAGR of 7.3% during 2026-2030 .

Sweet Snacks market is segmented by Product (Cakes, Cookies, Others) Distribution channel (Offline, Online) Packaging (Bag and pouches, Boxes, Jars, Others)

Blue Diamond Growers, Calbee Inc., Campbell Soup Co., Conagra Brands Inc., Ferrero International S.A., General Mills Inc., Haldiram Snacks Food Pvt. Ltd., HARIBO GmbH and Co. KG, Jelly Belly Candy Co., Lindt and Sprungli AG, Mars Inc., Mondelez International Inc., Nestle SA, Palmer Candy Co., PepsiCo Inc., The Hain Celestial Group, The Hershey Co., Unilever PLC, Universal Robina Corp., WK Kellogg Co are a few of the key vendors in the Sweet Snacks market.

APAC will register the highest growth rate of 37.9% among the other regions. Therefore, the Sweet Snacks market in APAC is expected to garner significant business opportunities for the vendors during the forecast period.

China, Japan, India, South Korea, Australia, Indonesia, Germany, UK, France, Italy, Spain, The Netherlands, US, Canada, Mexico, Saudi Arabia, UAE, South Africa, Israel, Turkey, Brazil, Argentina, Colombia

  • Pervasive influence of convenience and on-go consumption patterns is the driving factor this market.

The Sweet Snacks market vendors should focus on grabbing business opportunities from the Product segment as it accounted for the largest market share in the base year.