Tea Market Size 2026-2030
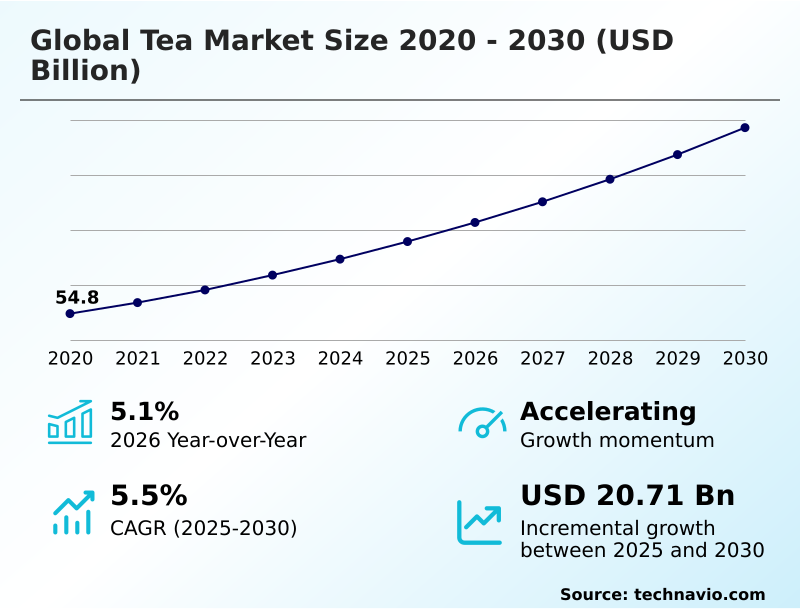
The tea market size is valued to increase by USD 20.71 billion, at a CAGR of 5.5% from 2025 to 2030. Rising health and wellness awareness boosting tea consumption will drive the tea market.
Major Market Trends & Insights
- APAC dominated the market and accounted for a 44% growth during the forecast period.
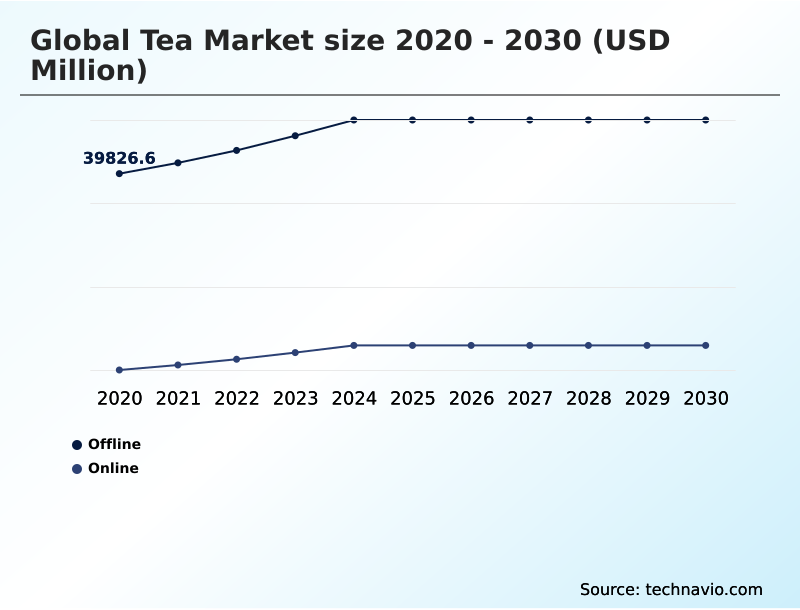
- By Distribution Channel - Offline segment was valued at USD 46.62 billion in 2024
- By Product - Black tea segment accounted for the largest market revenue share in 2024
Market Size & Forecast
- Market Opportunities: USD 33.81 billion
- Market Future Opportunities: USD 20.71 billion
- CAGR from 2025 to 2030 : 5.5%
Market Summary
- The tea market is undergoing a significant transformation, driven by evolving consumer preferences toward health and wellness. Demand is shifting from traditional preparations to functional beverages that offer tangible benefits, including high antioxidant properties derived from their rich catechin content and polyphenol compounds.
- This evolution is compelling producers to innovate beyond conventional products, focusing on artisanal tea blends and specialty tea flavor profiles. In the supply chain, a key scenario involves optimizing logistics to preserve the freshness of single origin tea.
- Companies are leveraging technology for enhanced supply chain traceability to ensure the delicate tea terroir characteristics of premium leaves are maintained from farm to cup. This focus on quality is critical, as the sensory evaluation of tea and its caffeine content level remain key purchasing criteria.
- Moreover, the industry is navigating challenges like the need for climate-resilient tea varieties while capitalizing on opportunities in the ready to drink tea formulation and direct-to-consumer tea sales channels. The rise of the wellness tea market and clean label tea products underscores a broader movement toward mindful consumption and transparency in the global beverage industry.
What will be the Size of the Tea Market during the forecast period?
Get Key Insights on Market Forecast (PDF) Get Free Sample
How is the Tea Market Segmented?
The tea industry research report provides comprehensive data (region-wise segment analysis), with forecasts and estimates in "USD million" for the period 2026-2030, as well as historical data from 2020-2024 for the following segments.
- Distribution channel
- Offline
- Online
- Product
- Black tea
- Green tea
- Others
- Type
- Leaf tea
- CTC tea
- Others
- Geography
- APAC
- China
- Japan
- India
- Europe
- Germany
- UK
- France
- North America
- US
- Canada
- Mexico
- South America
- Brazil
- Argentina
- Colombia
- Middle East and Africa
- Saudi Arabia
- UAE
- South Africa
- Rest of World (ROW)
- APAC
By Distribution Channel Insights
The offline segment is estimated to witness significant growth during the forecast period.
The offline segment remains the primary sales pillar, heavily influenced by traditional shopping habits where consumers prefer direct, sensory evaluation of tea.
Supermarkets and hypermarkets drive retail tea category management, offering a wide array of brands from mass-market CTC tea manufacturing to premium loose leaf tea grading.
These large-scale outlets capitalize on premium tea packaging design and in-store promotions, appealing to diverse consumer beverage preferences. Specialty boutiques play a crucial role, offering curated selections for the specialty food and beverage connoisseur.
Despite the rise of digital channels, this segment's resilience is notable, showing a 4.87% year-over-year increase, underpinned by the immediate product access and trust that physical retail environments provide, particularly for high-value artisanal tea blends.
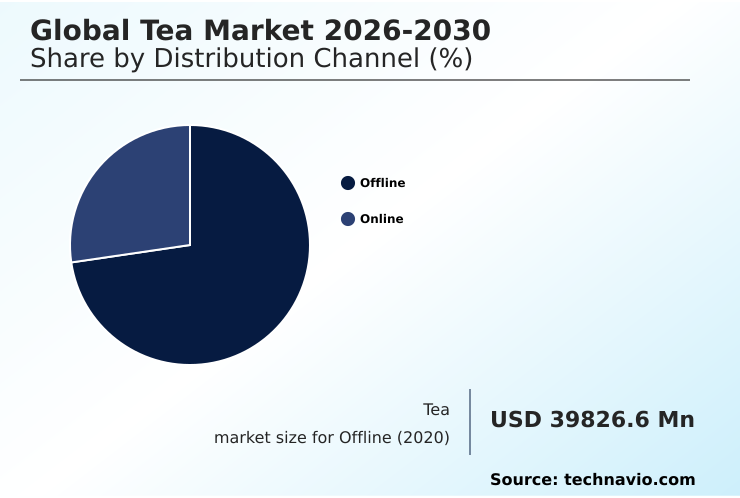
The Offline segment was valued at USD 46.62 billion in 2024 and showed a gradual increase during the forecast period.
Regional Analysis
APAC is estimated to contribute 44% to the growth of the global market during the forecast period.Technavio’s analysts have elaborately explained the regional trends and drivers that shape the market during the forecast period.
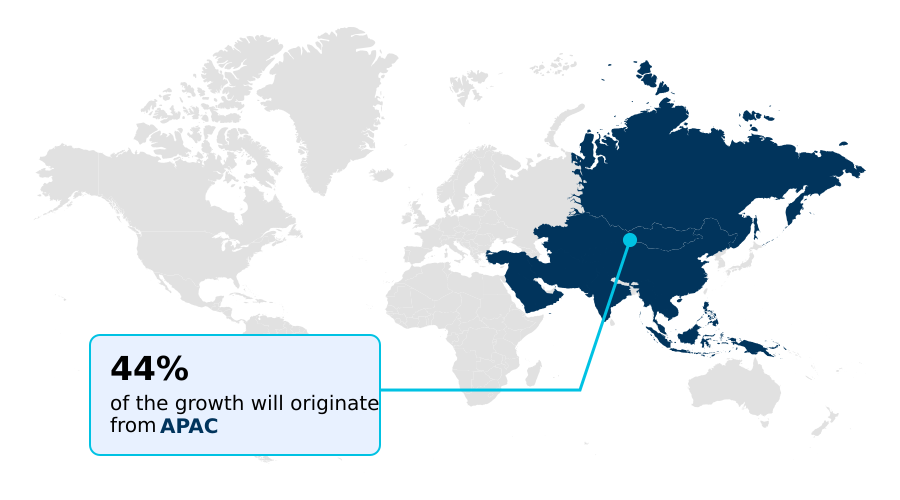
See How Tea Market Demand is Rising in APAC Get Free Sample
The geographic landscape of the tea market is dominated by APAC, which accounts for 44% of incremental growth, driven by deep cultural traditions and massive consumer bases in China and India.
In this region, tea terroir characteristics are paramount, with a focus on specific varieties of the camellia sinensis leaf and traditional tea blending techniques.
Europe remains a key market, with a strong premiumization trend in beverages; consumers are increasingly seeking sustainable farming practices and ethical sourcing certification, with over 60% of specialty buyers prioritizing these labels.
North America, with a steady 5.2% growth rate, is a hub for innovation in the global beverage industry, particularly around functional tea benefits and healthy hydration options.
The alternative beverage market is expanding rapidly here, creating new avenues for specialty tea market analysis and growth. Across regions, a unified theme is the rising importance of transparent food sourcing and adapting to regional tea consumption patterns.
Market Dynamics
Our researchers analyzed the data with 2025 as the base year, along with the key drivers, trends, and challenges. A holistic analysis of drivers will help companies refine their marketing strategies to gain a competitive advantage.
- The future of the global tea market is being shaped by several interconnected long-tail trends. The growth of ready to drink tea is making the beverage more accessible, appealing to consumers seeking convenience without sacrificing quality.
- Simultaneously, a rising demand for specialty tea reflects a consumer shift to healthy beverages, where the unique health benefits of green tea are a major draw. This has pushed marketing strategies for tea brands to focus on storytelling around origin and artisanal tea blending techniques.
- Sustainability in tea production is no longer a niche concern; it is a core expectation, influencing everything from farming practices to innovation in tea packaging. The premiumization of tea products continues, with consumers willing to pay more for fair trade certified tea benefits and superior quality.
- However, the industry faces challenges in the tea supply chain, requiring a deeper look at the role of technology in tea farming to mitigate issues like the impact of climate change on tea. The distinction between CTC versus orthodox tea processing is becoming more relevant to discerning consumers, who are also showing evolving consumer preferences in tea flavors.
- These dynamics, combined with the strong growth drivers for herbal infusions and the e-commerce growth in tea sales, define the complex regional tea consumption patterns of today.
What are the key market drivers leading to the rise in the adoption of Tea Industry?
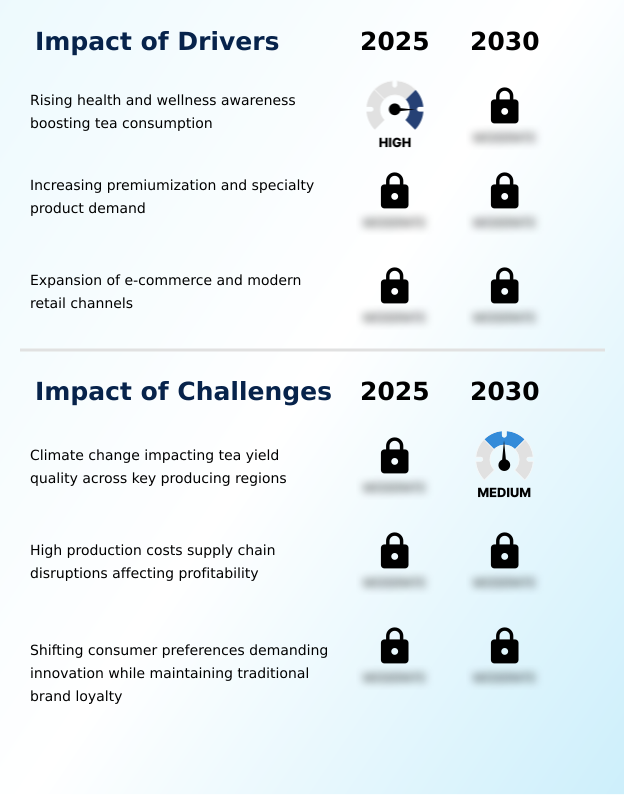
- Increasing consumer health and wellness awareness is a key driver boosting global tea consumption.
- The market's expansion is propelled by a confluence of health-consciousness, premiumization, and digital accessibility. The wellness tea market is thriving, with products highlighting functional tea benefits and natural tea flavorings commanding a price premium of up to 40%.
- This premiumization trend in beverages is supported by the demand for clean label tea products and transparent food sourcing. E-commerce tea platforms have become pivotal, now accounting for over 25% of sales in the specialty tea market analysis.
- The appeal of single origin tea and unique artisanal tea blends is a major factor, with consumers valuing the stories and craftsmanship behind gourmet food products.
- This shift toward ethical consumerism trends is forcing brands to re-evaluate their value propositions, emphasizing quality and authenticity to align with modern consumer expectations in the global beverage industry.
What are the market trends shaping the Tea Industry?
- The rising popularity of ready-to-drink tea and other convenience formats represents a significant market trend. This shift is driven by consumer demand for portability and immediate consumption.
- Key trends are reshaping the tea market, driven by consumer demand for convenience and personalized experiences. The growth of ready to drink tea formulation is undeniable, with sales in this category growing 35% faster than traditional formats. This aligns with a broader shift toward mindful consumption habits, where products like those featuring biodegradable tea bags are preferred.
- The beverage industry innovation is further evident in the rise of tea subscription box models, which enhance digital brand engagement and have achieved a 50% higher customer lifetime value compared to single-purchase customers. Experiential tea marketing, through pop-ups and tasting events, helps build brand loyalty.
- Furthermore, the popularity of cold brew tea extraction methods for their smooth flavor profile is surging, reflecting a move toward more sophisticated, healthy hydration options and influencing the non-alcoholic drink trends.
What challenges does the Tea Industry face during its growth?
- The impact of climate change on tea yield and quality across key producing regions poses a significant challenge to industry growth.
- The tea market faces significant operational and environmental challenges that threaten stability and profitability. Climate change is a primary concern, with erratic weather patterns leading to the development of climate-resilient tea varieties being a top priority; some regions have already reported yield reductions of up to 15%.
- This environmental pressure complicates soil health management and requires investment in agri-food technology to maintain crop quality. Concurrently, disruptions in beverage supply chain logistics, coupled with rising input costs, have compressed margins by an average of 5% for many producers. Ensuring supply chain traceability from farm to consumer is now essential for brand trust but adds complexity.
- Addressing these issues requires a holistic approach that integrates sustainable farming practices with advanced operational oversight to secure the long-term health of the industry.
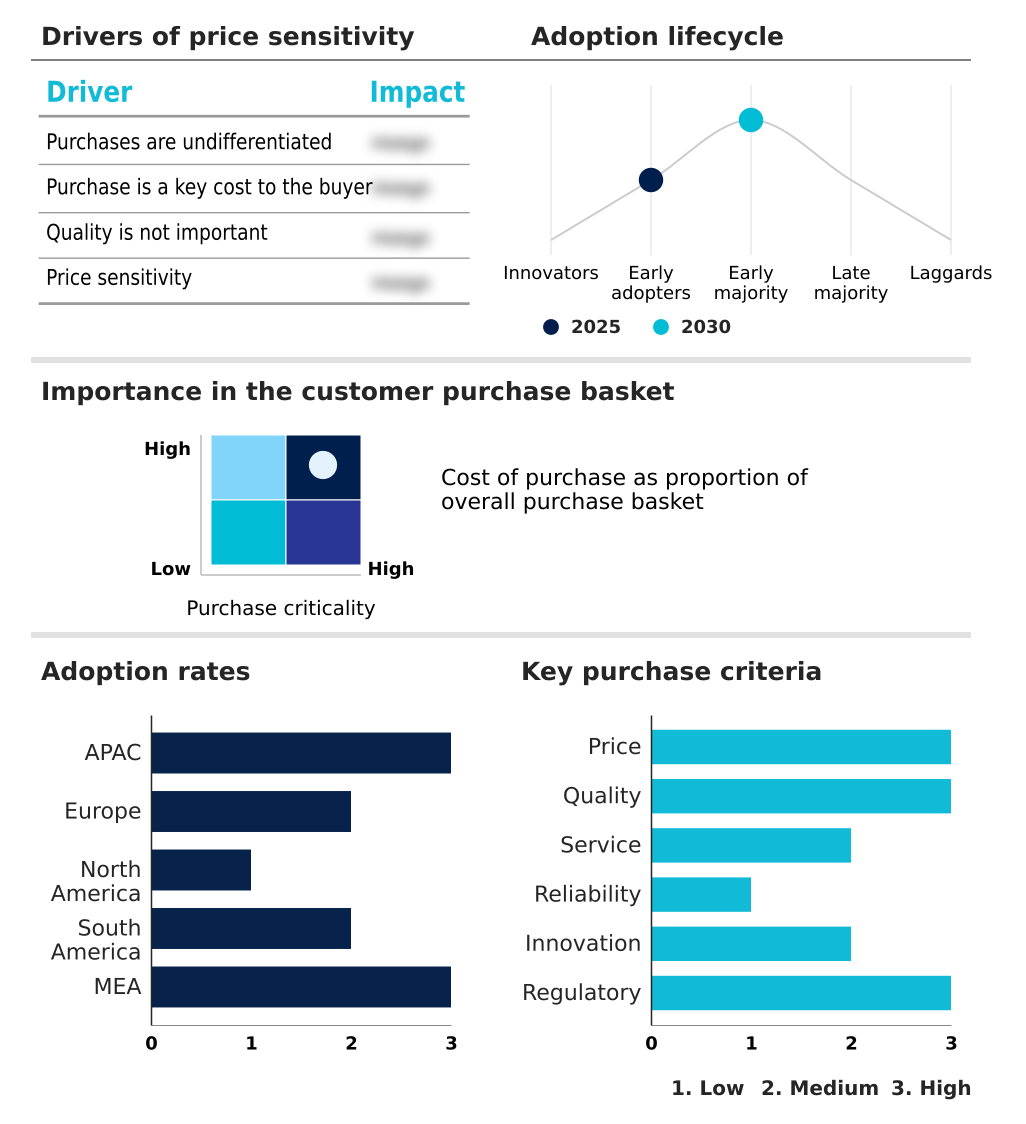
Exclusive Technavio Analysis on Customer Landscape
The tea market forecasting report includes the adoption lifecycle of the market, covering from the innovator’s stage to the laggard’s stage. It focuses on adoption rates in different regions based on penetration. Furthermore, the tea market report also includes key purchase criteria and drivers of price sensitivity to help companies evaluate and develop their market growth analysis strategies.
Customer Landscape of Tea Industry
Competitive Landscape
Companies are implementing various strategies, such as strategic alliances, tea market forecast, partnerships, mergers and acquisitions, geographical expansion, and product/service launches, to enhance their presence in the industry.
Ahmad Tea Ltd. - The company provides a diverse portfolio of premium blends and herbal infusions, catering to global consumer preferences for quality and variety in the tea market.
The industry research and growth report includes detailed analyses of the competitive landscape of the market and information about key companies, including:
- Ahmad Tea Ltd.
- Apeejay Surrendra Group
- Associated British Foods Plc
- Barrys Tea
- Bettys and Taylors Group Ltd.
- Bigelow Tea
- BOH Plantations Sdn Bhd
- Clipper Teas
- Dilmah Ceylon Tea Co. Plc
- ITO EN Ltd.
- Kenya Tea Packers Ltd.
- LIPTON Teas and Infusions
- Mariage Freres
- Orientis Gourmet
- Rishi Tea and Botanicals
- Tata Consumer Products Ltd.
- The Hain Celestial Group
Qualitative and quantitative analysis of companies has been conducted to help clients understand the wider business environment as well as the strengths and weaknesses of key industry players. Data is qualitatively analyzed to categorize companies as pure play, category-focused, industry-focused, and diversified; it is quantitatively analyzed to categorize companies as dominant, leading, strong, tentative, and weak.
Recent Development and News in Tea market
- In December, 2025, HEYTEA collaborated with POP MART to introduce exclusive seasonal drinks through a coordinated global launch, blending digital creativity with experiential retail activation.
- In October, 2025, Vanaspatya Teas officially launched, introducing premium handcrafted blends rooted in natural Assam tea leaves, reflecting heightened interest in authenticity and plant-based wellness products.
- In September, 2025, CHAGEE won the Best Natural/Organic Beverage award at the World Beverage Innovation Awards for its premium tea drinks, highlighting its product excellence and innovation.
- In July, 2025, Aman Tea Group launched a Sustainability and Good Agricultural Practices (GAP) initiative aimed at empowering over 6,000 small tea growers, aligning production sustainability with expanding distribution.
Dive into Technavio’s robust research methodology, blending expert interviews, extensive data synthesis, and validated models for unparalleled Tea Market insights. See full methodology.
| Market Scope | |
|---|---|
| Page number | 288 |
| Base year | 2025 |
| Historic period | 2020-2024 |
| Forecast period | 2026-2030 |
| Growth momentum & CAGR | Accelerate at a CAGR of 5.5% |
| Market growth 2026-2030 | USD 20708.9 million |
| Market structure | Fragmented |
| YoY growth 2025-2026(%) | 5.1% |
| Key countries | China, Japan, India, South Korea, Indonesia, Australia, Germany, UK, France, Italy, Spain, The Netherlands, US, Canada, Mexico, Brazil, Argentina, Colombia, Saudi Arabia, UAE, South Africa, Israel and Turkey |
| Competitive landscape | Leading Companies, Market Positioning of Companies, Competitive Strategies, and Industry Risks |
Research Analyst Overview
- The tea market is defined by a complex interplay of tradition and innovation. At its core, the quality of the camellia sinensis leaf, determined by its catechin content and polyphenol compounds, remains paramount.
- The tea oxidation process is a critical factor differentiating products, from unoxidized green teas rich in l-theanine amino acid to fully oxidized black teas with high theaflavin concentration. A key boardroom decision revolves around product strategy: whether to focus on mass-market CTC tea manufacturing or high-margin artisanal tea blends and single origin tea.
- Brands focusing on ethical sourcing certification and regenerative agriculture are building significant consumer trust, with data showing that products with transparent supply chain traceability achieve up to 20% higher price points. The industry is also seeing growth in niche segments like pu-erh fermentation and oolong tea processing.
- Expertise in sensory evaluation of tea and understanding its antioxidant properties are becoming essential for differentiation in a crowded marketplace, shaping the future of beverage industry innovation.
What are the Key Data Covered in this Tea Market Research and Growth Report?
-
What is the expected growth of the Tea Market between 2026 and 2030?
-
USD 20.71 billion, at a CAGR of 5.5%
-
-
What segmentation does the market report cover?
-
The report is segmented by Distribution Channel (Offline, and Online), Product (Black tea, Green tea, and Others), Type (Leaf tea, CTC tea, and Others) and Geography (APAC, Europe, North America, South America, Middle East and Africa)
-
-
Which regions are analyzed in the report?
-
APAC, Europe, North America, South America and Middle East and Africa
-
-
What are the key growth drivers and market challenges?
-
Rising health and wellness awareness boosting tea consumption, Climate change impacting tea yield quality across key producing regions
-
-
Who are the major players in the Tea Market?
-
Ahmad Tea Ltd., Apeejay Surrendra Group, Associated British Foods Plc, Barrys Tea, Bettys and Taylors Group Ltd., Bigelow Tea, BOH Plantations Sdn Bhd, Clipper Teas, Dilmah Ceylon Tea Co. Plc, ITO EN Ltd., Kenya Tea Packers Ltd., LIPTON Teas and Infusions, Mariage Freres, Orientis Gourmet, Rishi Tea and Botanicals, Tata Consumer Products Ltd. and The Hain Celestial Group
-
Market Research Insights
- Market dynamics are increasingly shaped by the demand for transparency and innovation, influencing consumer beverage preferences globally. The adoption of tea subscription box models has surged, with some services reporting a 40% year-over-year growth in subscribers seeking curated experiences. This direct-to-consumer approach enhances digital brand engagement and provides valuable data on emerging tastes.
- In parallel, the foodservice tea solutions sector is expanding, with premium chains achieving a 15% higher customer retention rate by offering exclusive artisanal tea blends and plant-based beverage alternatives. As beverage packaging sustainability becomes a critical differentiator, brands using fully compostable materials are seeing a 10% increase in sales from environmentally conscious consumers.
- These shifts reflect a broader move toward healthy hydration options and ethical consumerism trends.
We can help! Our analysts can customize this tea market research report to meet your requirements.
 RIA -
RIA - 
