
Telematics In Insurance Industry Market Size 2025-2029
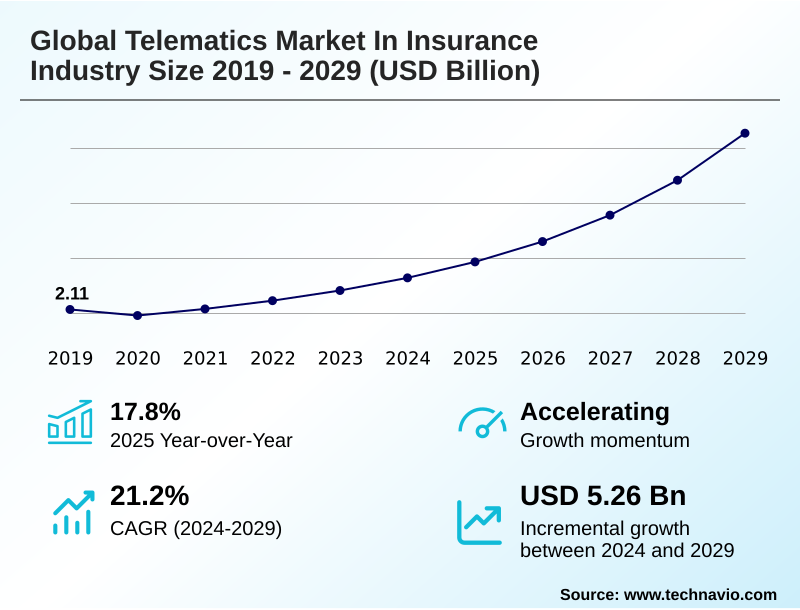
The telematics in insurance industry market size is valued to increase by USD 5.26 billion, at a CAGR of 21.2% from 2024 to 2029. Cost savings due to adoption of telematics-enabled UBI will drive the telematics in insurance industry market.
Major Market Trends & Insights
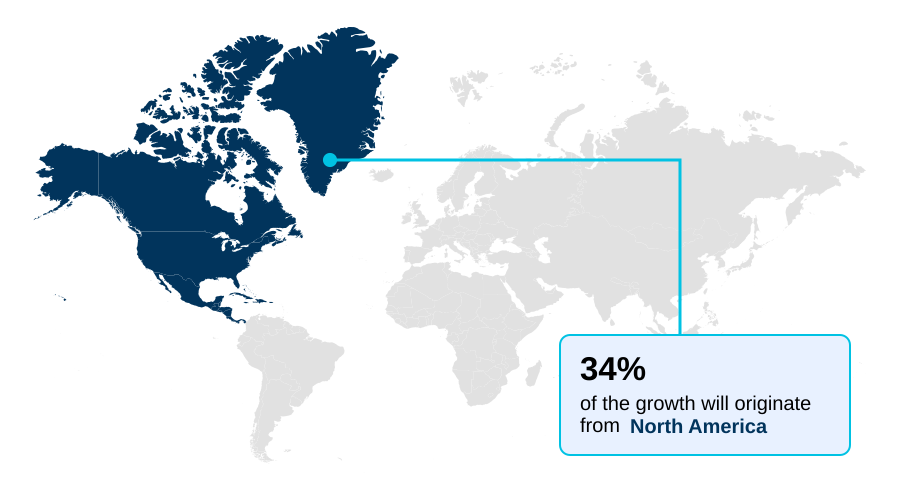
- North America dominated the market and accounted for a 34.1% growth during the forecast period.
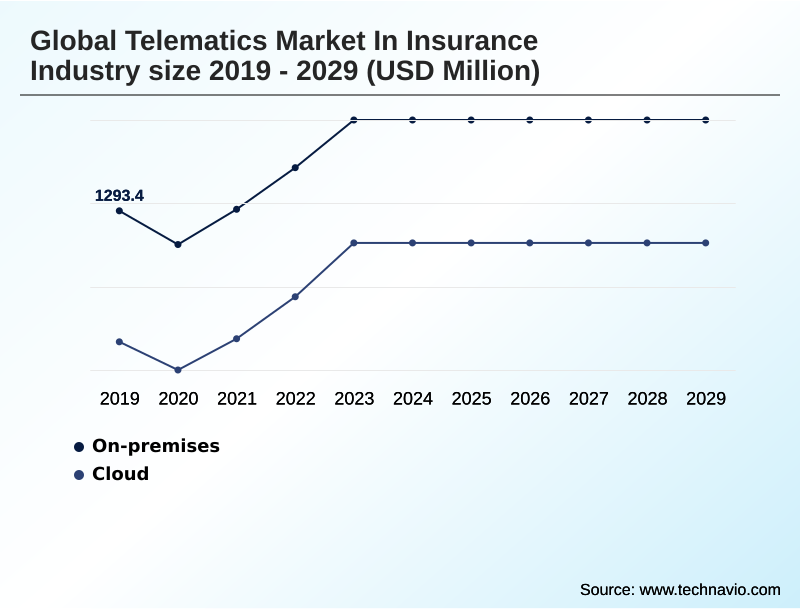
- By Deployment - On-premises segment was valued at USD 1.62 billion in 2023
- By Usage - PAYD segment accounted for the largest market revenue share in 2023
Market Size & Forecast
- Market Opportunities: USD 6.41 billion
- Market Future Opportunities: USD 5.26 billion
- CAGR from 2024 to 2029 : 21.2%
Market Summary
- The telematics market in insurance industry is evolving from a simple mechanism for usage-based insurance (UBI) into a sophisticated ecosystem for proactive risk management and enhanced customer engagement. This transformation is driven by the convergence of advanced sensor technology, IoT connectivity solutions, and powerful insurance data analytics.
- Insurers are moving beyond basic pay-as-you-drive (PAYD) models to more nuanced approaches like pay-how-you-drive (PHYD), which utilize granular driver behavior monitoring to refine actuarial risk modeling.
- For instance, a commercial logistics company can leverage a fleet management integration platform not only to secure lower premiums based on safe driving scores but also to optimize routes, monitor vehicle health diagnostics, and reduce fuel consumption. This creates a symbiotic relationship where safer operations lead to lower insurance costs and improved business outcomes.
- However, the increasing volume and sensitivity of contextual driving data raise significant challenges related to data privacy and security, requiring robust governance frameworks to maintain policyholder trust and ensure regulatory compliance management. The market's trajectory points toward an integrated future where real-time driver feedback and automated claims processing are standard.
What will be the Size of the Telematics In Insurance Industry Market during the forecast period?
Get Key Insights on Market Forecast (PDF) Get Free Sample
How is the Telematics In Insurance Industry Market Segmented?
The telematics in insurance industry industry research report provides comprehensive data (region-wise segment analysis), with forecasts and estimates in "USD million" for the period 2025-2029, as well as historical data from 2019-2023 for the following segments.
- Deployment
- On-premises
- Cloud
- Usage
- PAYD
- PHYD
- MHYD
- Technology
- Embedded OEM module
- OBD-II dongle
- Smartphone-centric
- Hardwired
- Geography
- North America
- US
- Canada
- Mexico
- APAC
- China
- India
- Japan
- Europe
- Germany
- UK
- France
- South America
- Brazil
- Argentina
- Middle East and Africa
- Saudi Arabia
- UAE
- South Africa
- Rest of World (ROW)
- North America
By Deployment Insights
The on-premises segment is estimated to witness significant growth during the forecast period.
On-premises deployment remains a vital segment, especially for large enterprises that prioritize robust data privacy and security for their telematics data platform. This approach supports comprehensive journey risk management and ensures strict regulatory compliance management.
Utilizing a mix of onboard diagnostics (OBD-II) dongle and hardwired telematics device inputs, organizations can implement precise vehicle tracking solutions and geofencing and location services.
In-house control over data also facilitates accurate mileage verification systems and proprietary modeling to improve policyholder retention strategies, with some fleets reporting a 15% reduction in compliance-related incidents by maintaining direct data oversight.
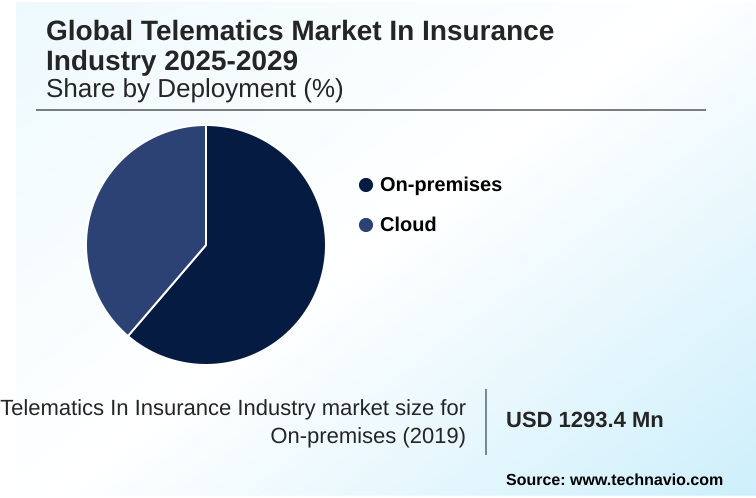
The On-premises segment was valued at USD 1.62 billion in 2023 and showed a gradual increase during the forecast period.
Regional Analysis
North America is estimated to contribute 34.1% to the growth of the global market during the forecast period.Technavio’s analysts have elaborately explained the regional trends and drivers that shape the market during the forecast period.
See How Telematics In Insurance Industry Market Demand is Rising in North America Get Free Sample
The market's geographic landscape is characterized by varying levels of maturity. North America leads in adoption, with sophisticated driver scoring models and fleet management integration becoming standard. In Europe, regulatory focus is driving the adoption of manage-how-you-drive (MHYD) programs.
Emerging markets in APAC show strong potential, driven by OEM-led initiatives incorporating the embedded OEM module. Across regions, insurers are refining actuarial risk modeling through detailed driving habit analysis.
The use of eco-driving scorecards is also growing, supported by services like automated roadside assistance dispatch. Programs employing predictive crash modeling have demonstrated the ability to identify high-risk drivers with 30% greater accuracy than traditional demographic models.
Market Dynamics
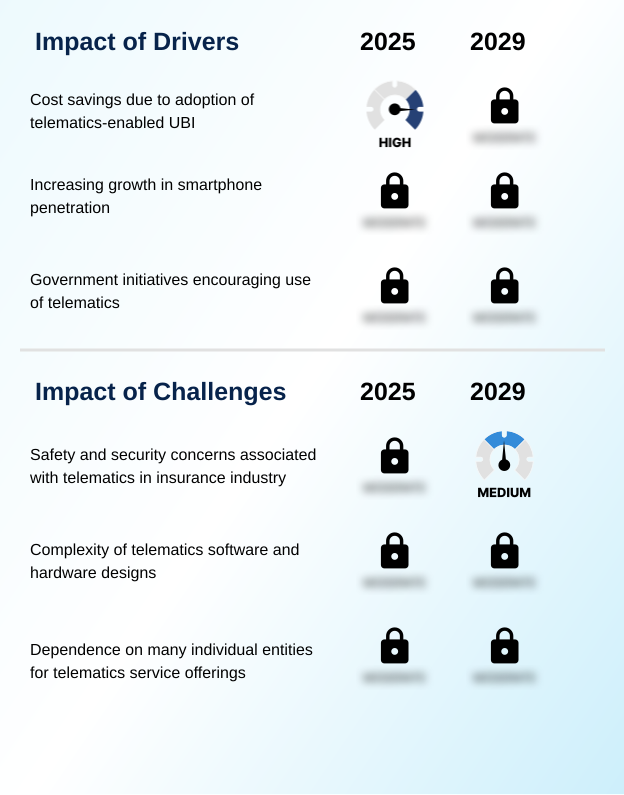
Our researchers analyzed the data with 2024 as the base year, along with the key drivers, trends, and challenges. A holistic analysis of drivers will help companies refine their marketing strategies to gain a competitive advantage.
- The evolution of the telematics market in insurance industry is defined by the expanding use of telematics data for insurance underwriting, moving far beyond simple mileage tracking. A central theme is the impact of UBI on driver safety, as real-time feedback mechanisms demonstrably improve driving habits.
- Forward-thinking insurers are now focused on integrating ADAS data into risk assessment, creating more predictive and accurate models. The debate between smartphone telematics vs OBD-II devices continues, with each offering distinct advantages in deployment cost and data richness. This data collection also amplifies privacy concerns in insurance telematics, a critical hurdle that providers must address to maintain consumer trust.
- Operationally, a key application is using telematics for claims fraud detection, where data can validate or contest incident reports. The value proposition for commercial clients is clear, as real-time telematics for fleet insurance offers unparalleled risk management capabilities, highlighting the ROI of telematics in commercial auto.
- This technology's expanding telematics role in the connected car ecosystem is reshaping product development, particularly for telematics for young driver insurance programs. The core enabler is the capability of analyzing driver behavior with AI, which powers the next-generation telematics platform for insurance carriers.
- While the benefits of PAYD insurance models are well-understood, the future lies in telematics data monetization strategies and scaling FNOL automation with telematics data. The future of video telematics in insurance promises even deeper insights, solidifying the importance of IoT applications in auto insurance.
- However, challenges in telematics data accuracy and the complexity of managing data from embedded telematics persist, making telematics-based customer loyalty programs both a goal and a challenge. Platforms capable of analyzing driver behavior with AI can improve risk segmentation by more than double compared to traditional demographic-based methods.
What are the key market drivers leading to the rise in the adoption of Telematics In Insurance Industry Industry?
- Significant cost savings achieved through the adoption of telematics-enabled usage-based insurance (UBI) stand out as a primary market driver.
- The primary market driver is the financial appeal of usage-based insurance (UBI), which allows for highly personalized insurance premiums.
- Models such as pay-as-you-drive (PAYD) are gaining traction due to the widespread availability of IoT connectivity solutions and mobile app-based data collection.
- Insurers are leveraging AI-powered video analytics for sophisticated driver behavior monitoring, which not only facilitates value-added services like stolen vehicle recovery but also underpins automated claims processing.
- This automation can accelerate claim settlements by over 50%, leading to a direct improvement in claims loss ratio reduction and overall operational efficiency.
What are the market trends shaping the Telematics In Insurance Industry Industry?
- A key market trend involves optimizing customer communication with insurance telematics. This shift leverages data to create more personalized and value-added interactions.
- Market trends indicate a definitive shift toward enhancing driver interaction, with video telematics and smartphone-centric telematics leading the charge. These technologies enable insurers to provide real-time driver feedback through dynamic customer engagement platforms. The analysis of contextual driving data from an incident data recorder allows for precise driving event reconstruction, which is foundational to effective pay-how-you-drive (PHYD) models.
- Programs offering compelling safe driving incentives and premium discount programs see policyholder adoption rates that are up to 40% higher than standard offerings, fostering safer driving habits and increasing customer loyalty.
What challenges does the Telematics In Insurance Industry Industry face during its growth?
- Pervasive safety and security concerns associated with telematics data in the insurance industry present a significant challenge to market growth.
- Key market challenges stem from the technical complexities of data integration and security. Accessing information from a vehicle's telematics control unit (TCU) and controller area network (CAN) bus presents significant hurdles for any telematics service provider (TSP). Standardizing the use of advanced driver-assistance systems (ADAS) data for insurance data analytics remains a major goal.
- The reliability of crash detection algorithms is paramount for effective first notice of loss (FNOL) systems, just as accurate distracted driving detection is for risk prevention. Furthermore, the lack of data uniformity complicates vehicle health diagnostics, often creating integration bottlenecks that delay program rollouts by more than a quarter.
Exclusive Technavio Analysis on Customer Landscape
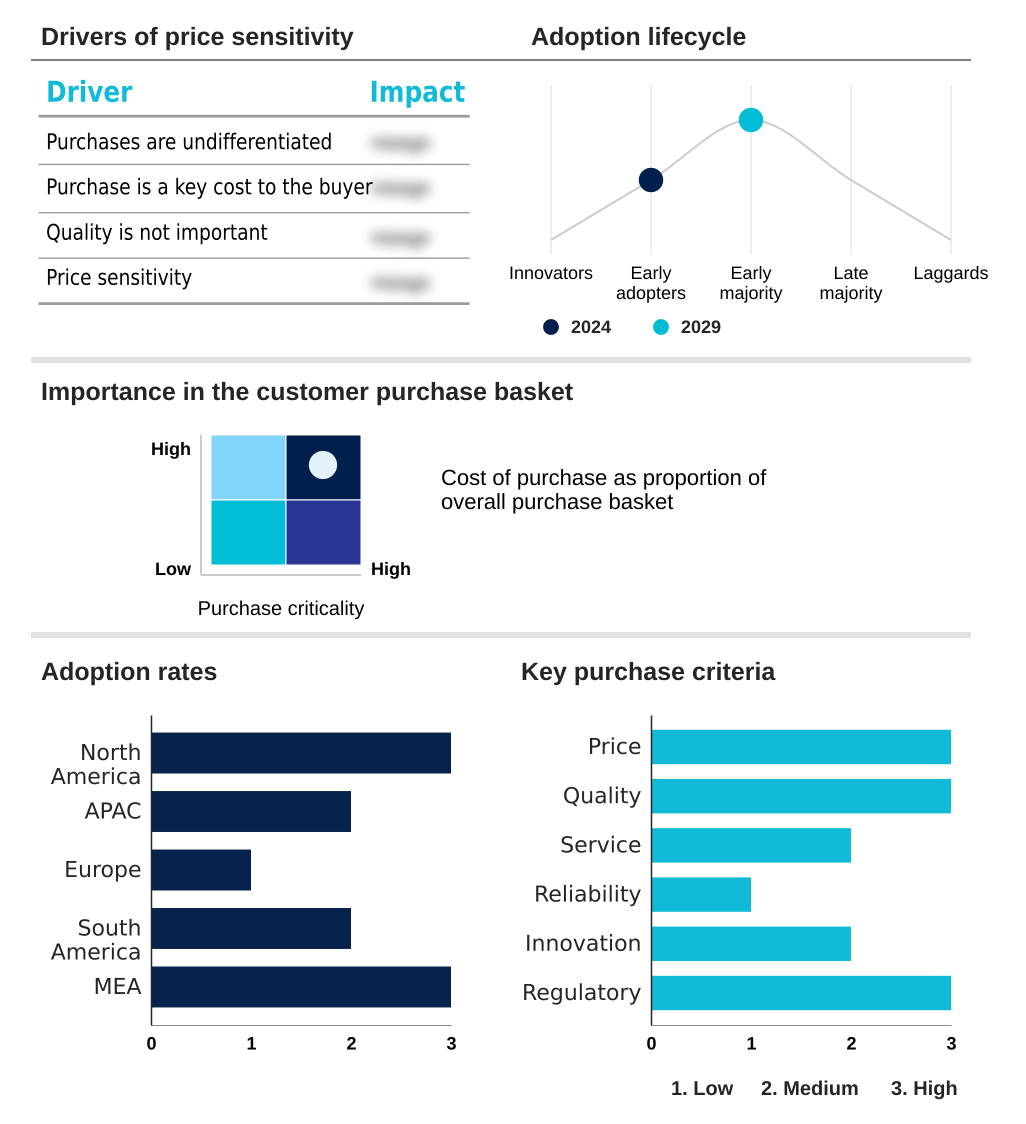
The telematics in insurance industry market forecasting report includes the adoption lifecycle of the market, covering from the innovator’s stage to the laggard’s stage. It focuses on adoption rates in different regions based on penetration. Furthermore, the telematics in insurance industry market report also includes key purchase criteria and drivers of price sensitivity to help companies evaluate and develop their market growth analysis strategies.
Customer Landscape of Telematics In Insurance Industry Industry
Competitive Landscape
Companies are implementing various strategies, such as strategic alliances, telematics in insurance industry market forecast, partnerships, mergers and acquisitions, geographical expansion, and product/service launches, to enhance their presence in the industry.
Admiral Group plc - Provides integrated solutions for roadside assistance, connected vehicle services, and claims management, optimizing safety and operational efficiency for insurance providers.
The industry research and growth report includes detailed analyses of the competitive landscape of the market and information about key companies, including:
- Admiral Group plc
- Agero Inc.
- Aplicom Ltd.
- Aviva insurance Ltd.
- AXA Group
- Insurance and Mobility Solutions
- Masternaut Ltd.
- Mercedes Benz Group AG
- Meta System S.p.A
- MiX Telematics Ltd.
- OCTO Telematics S.p.A
- Sierra Wireless Inc.
- The Allstate Corp.
- TomTom NV
- Verizon Communications Inc.
- Zurich Insurance Co. Ltd.
Qualitative and quantitative analysis of companies has been conducted to help clients understand the wider business environment as well as the strengths and weaknesses of key industry players. Data is qualitatively analyzed to categorize companies as pure play, category-focused, industry-focused, and diversified; it is quantitatively analyzed to categorize companies as dominant, leading, strong, tentative, and weak.
Recent Development and News in Telematics in insurance industry market
- In October 2024, Verizon Communications Inc. acquired a leading AI video analytics firm to enhance its Verizon Connect platform with advanced driver monitoring and contextual event analysis capabilities.
- In January 2025, Mercedes Benz Group AG and AXA Group announced a strategic partnership to offer embedded, behavior-based insurance policies directly through the vehicle’s native infotainment system across Europe.
- In March 2025, OCTO Telematics S.p.A launched its next-generation telematics platform, which integrates data from electric vehicle batteries to offer specialized insurance products based on charging habits and energy consumption.
- In May 2025, The Allstate Corp. received regulatory approval in California to use telematics data, including braking and cornering severity, as primary rating factors for its Drivewise program.
Dive into Technavio’s robust research methodology, blending expert interviews, extensive data synthesis, and validated models for unparalleled Telematics In Insurance Industry Market insights. See full methodology.
| Market Scope | |
|---|---|
| Page number | 286 |
| Base year | 2024 |
| Historic period | 2019-2023 |
| Forecast period | 2025-2029 |
| Growth momentum & CAGR | Accelerate at a CAGR of 21.2% |
| Market growth 2025-2029 | USD 5256.7 million |
| Market structure | Fragmented |
| YoY growth 2024-2025(%) | 17.8% |
| Key countries | US, Canada, Mexico, China, India, Japan, South Korea, Australia, Indonesia, Germany, UK, France, Italy, Spain, The Netherlands, Brazil, Argentina, Chile, Saudi Arabia, UAE, South Africa, Egypt and Nigeria |
| Competitive landscape | Leading Companies, Market Positioning of Companies, Competitive Strategies, and Industry Risks |
Research Analyst Overview
- The telematics market in insurance industry is undergoing a structural shift, moving from basic vehicle tracking solutions to a comprehensive telematics data platform.
- The adoption of the embedded OEM module and hardwired telematics device is creating a rich data stream directly from the controller area network (CAN) bus, enabling advanced applications beyond the capabilities of a simple onboard diagnostics (OBD-II) dongle.
- This allows for precise driver behavior monitoring and sophisticated driver scoring models, which are fundamental to modern usage-based insurance (UBI) programs like pay-as-you-drive (PAYD) and pay-how-you-drive (PHYD). At a strategic level, boardroom decisions now center on how to leverage this data for automated claims processing and proactive roadside assistance dispatch.
- A core technology gaining traction is video telematics, which, when combined with AI-powered video analytics and crash detection algorithms, automates first notice of loss (FNOL) with high accuracy. Insurers that effectively implement real-time driver feedback have seen a 10-15% reduction in claims frequency.
- The market is also seeing growth in smartphone-centric telematics and solutions for manage-how-you-drive (MHYD), fleet management integration, geofencing and location services, and analyzing contextual driving data.
What are the Key Data Covered in this Telematics In Insurance Industry Market Research and Growth Report?
-
What is the expected growth of the Telematics In Insurance Industry Market between 2025 and 2029?
-
USD 5.26 billion, at a CAGR of 21.2%
-
-
What segmentation does the market report cover?
-
The report is segmented by Deployment (On-premises, and Cloud), Usage (PAYD, PHYD, and MHYD), Technology (Embedded OEM module, OBD-II dongle, Smartphone-centric, and Hardwired) and Geography (North America, APAC, Europe, South America, Middle East and Africa)
-
-
Which regions are analyzed in the report?
-
North America, APAC, Europe, South America and Middle East and Africa
-
-
What are the key growth drivers and market challenges?
-
Cost savings due to adoption of telematics-enabled UBI, Safety and security concerns associated with telematics in insurance industry
-
-
Who are the major players in the Telematics In Insurance Industry Market?
-
Admiral Group plc, Agero Inc., Aplicom Ltd., Aviva insurance Ltd., AXA Group, Insurance and Mobility Solutions, Masternaut Ltd., Mercedes Benz Group AG, Meta System S.p.A, MiX Telematics Ltd., OCTO Telematics S.p.A, Sierra Wireless Inc., The Allstate Corp., TomTom NV, Verizon Communications Inc. and Zurich Insurance Co. Ltd.
-
Market Research Insights
- The market is propelled by a strategic shift towards data-driven customer engagement platforms and advanced actuarial risk modeling. Insurers leveraging safe driving incentives report up to a 15% increase in policyholder retention compared to those without such programs.
- The integration of vehicle health diagnostics and mobile app-based data collection provides a more holistic view of risk, enabling the creation of highly personalized insurance premiums. This focus on proactive engagement is proving effective, as programs offering eco-driving scorecards have helped commercial fleets reduce fuel costs by as much as 12%.
- Moreover, the efficiency gains are substantial; telematics-driven systems have been shown to improve the accuracy of driving event reconstruction and combat fraud, supporting claims loss ratio reduction.
We can help! Our analysts can customize this telematics in insurance industry market research report to meet your requirements.
 RIA -
RIA - 
