
Japan Testing, Inspection, and Certification Market Size 2024-2028
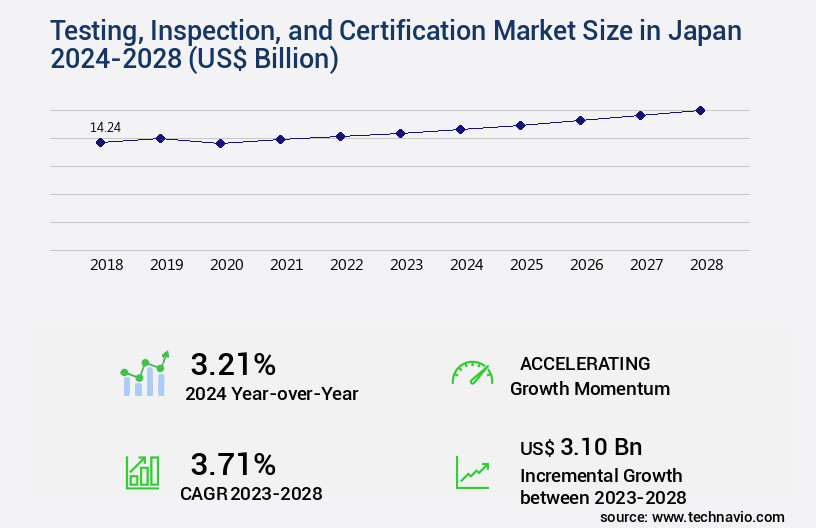
The Japan testing, inspection, and certification market size is valued to increase USD 3.10 billion, at a CAGR of 3.71% from 2023 to 2028. Stringent government regulations to ensure product and environmental safety will drive the Japan testing, inspection, and certification market.
Major Market Trends & Insights
- By Service Type - Testing and inspection service segment was valued at USD 10.37 billion in 2022
- By Source - In-house segment accounted for the largest market revenue share in 2022
Market Size & Forecast
- Market Opportunities: USD 0 billion
- Market Future Opportunities: USD 0 billion
- CAGR from 2023 to 2028 : 3.71%
Market Summary
- The market is a critical sector, encompassing core technologies and applications such as non-destructive testing, product certification, and quality assurance. This market is characterized by the continuous unfolding of market activities and evolving patterns. Strict government regulations, driven by the need to ensure product and environmental safety, are a primary market driver. For instance, the Japanese Ministry of Economy, Trade, and Industry mandates certification for various industries, including automotive, electronics, and construction. Another significant trend is the rise in adoption of artificial intelligence (AI) and machine learning (ML) in testing, inspection, and certification services. This technological advancement enhances efficiency, accuracy, and reduces human error.
- However, the high cost of testing, inspection, and certification services remains a challenge for small and medium-sized enterprises (SMEs). According to a survey by the Japan External Trade Organization, approximately 70% of SMEs in Japan face challenges in complying with regulations due to the high costs. Despite these challenges, the market continues to evolve, offering opportunities for innovation and growth.
What will be the Size of the Japan Testing, Inspection, and Certification Market during the forecast period?
Get Key Insights on Market Forecast (PDF) Request Free Sample
How is the Testing, Inspection, and Certification in Japan Market Segmented and what are the key trends of market segmentation?
The testing, inspection, and certification in Japan industry research report provides comprehensive data (region-wise segment analysis), with forecasts and estimates in "USD billion" for the period 2024-2028, as well as historical data from 2018-2022 for the following segments.
- Service Type
- Testing and inspection service
- Certification service
- Source
- In-house
- Outsourced
- End-user
- Infrastructure
- Energy and power
- Healthcare
- Manufacturing
- Others
- Geography
- APAC
- Japan
- APAC
By Service Type Insights
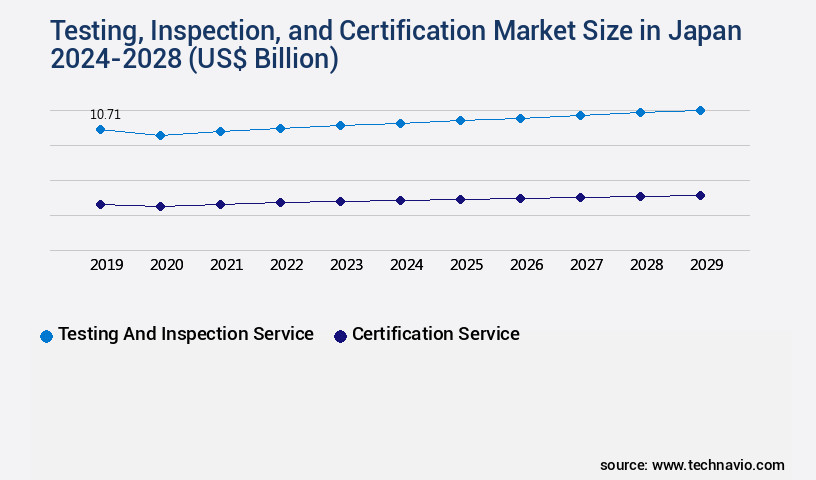
The testing and inspection service segment is estimated to witness significant growth during the forecast period.
The testing and inspection service segment holds a significant share in Japan's thriving testing, inspection, and certification market. With a relentless focus on safety, quality, and regulatory compliance, this segment is instrumental in maintaining Japan's reputation for rigorous standards and reliability. Activities span from material testing and inspection reporting to quality control metrics, risk assessment methods, and non-destructive testing. Notably, the automotive industry is a significant area of focus, with major players like Honda Motor Co Ltd, Toyota Motor Corp, and Nissan Motor Co Ltd, implementing various testing methodologies, including destructive testing, performance testing, and safety testing. These companies prioritize corrective actions and employ advanced quality management systems, certification bodies, and traceability systems to ensure product validation and continuous improvement.
Inspection protocols, preventive measures, and environmental testing are also crucial components, supported by inspection tools, quality assurance systems, testing equipment, and certification standards. Auditing procedures, data integrity, calibration procedures, root cause analysis, and compliance audits further bolster the sector's commitment to maintaining the highest standards.
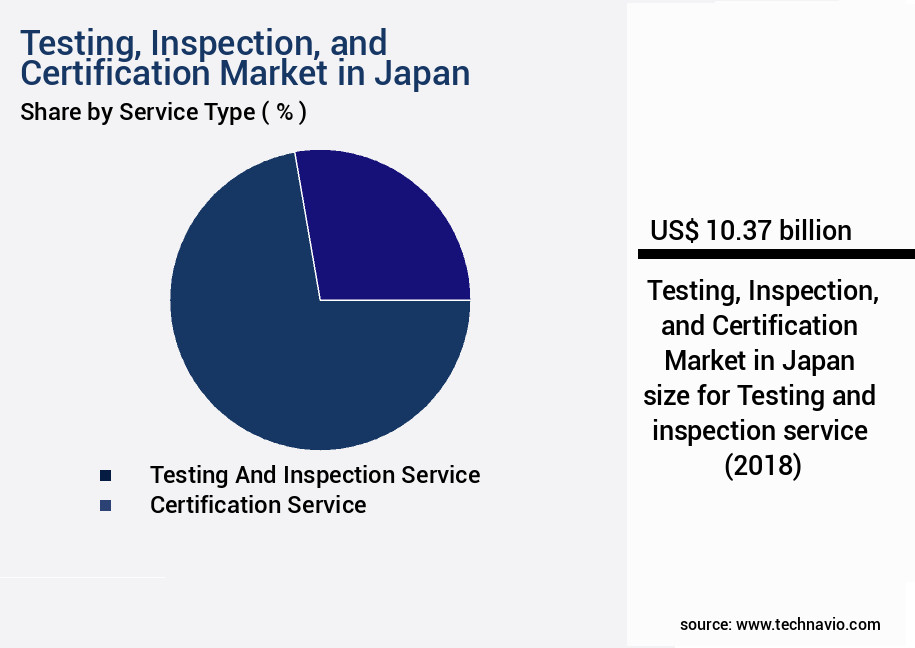
The Testing and inspection service segment was valued at USD 10.37 billion in 2018 and showed a gradual increase during the forecast period.
Market Dynamics
Our researchers analyzed the data with 2023 as the base year, along with the key drivers, trends, and challenges. A holistic analysis of drivers will help companies refine their marketing strategies to gain a competitive advantage.
In the dynamic and evolving landscape of the market, various sectors prioritize non-destructive testing methods to ensure product quality and adherence to stringent regulations. Quality management system implementation and statistical process control techniques are integral components of this process, enabling organizations to manage product lifecycle and supplier quality effectively. Environmental testing procedures and safety testing protocols are essential in the Japanese market, reflecting a strong commitment to ISO 14001 environmental certification. Failure analysis and corrective actions, root cause analysis methodologies, process capability analysis, and quality control chart interpretation are essential tools for continuous improvement initiatives. Data integrity management practices and traceability systems implementation are critical for maintaining transparency and accountability.
Risk assessment and mitigation strategies, quality assurance program development, testing equipment calibration schedules, and inspection reporting and documentation are other essential elements of this market. Compared to other regions, the adoption of advanced testing technologies in Japan is significantly higher. More than 80% of Japanese companies invest in non-destructive testing methods, surpassing the global average. This commitment to quality and safety is a testament to the market's maturity and the importance placed on maintaining a strong reputation for excellence. In conclusion, the market is a thriving industry, driven by a focus on quality, innovation, and regulatory compliance. Companies that prioritize these elements and invest in advanced testing technologies will reap the rewards of a competitive edge and customer trust.
What are the key market drivers leading to the rise in the adoption of Testing, Inspection, and Certification in Japan Industry?
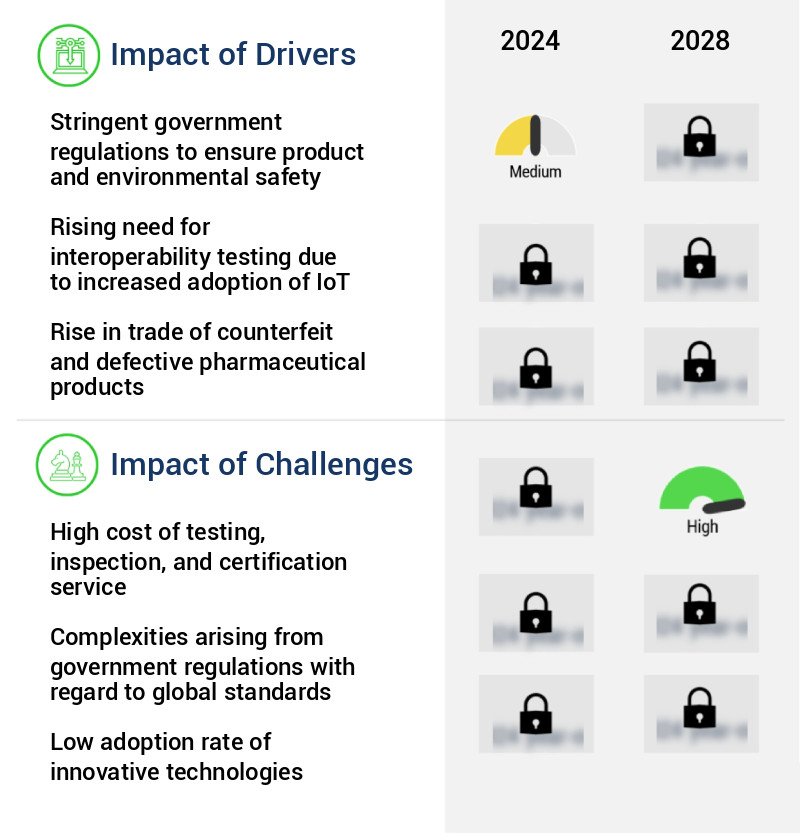
- Strict government regulations, which prioritize product safety and environmental protection, serve as the primary market driver.
- Stringent government regulations are a significant driving force behind the market. These regulations prioritize product safety and environmental protection, setting high standards for industries to adhere to. The Ministry of Health, Labor, and Welfare (MHLW) and the Ministry of Economy, Trade and Industry (METI) are key regulatory bodies responsible for establishing and enforcing these guidelines. Their efforts ensure consumer welfare and minimize environmental impacts. The testing, inspection, and certification services play a crucial role in validating compliance with these stringent requirements.
- For instance, MHLW oversees regulations related to food safety, pharmaceuticals, and medical devices, while METI focuses on industrial safety and environmental standards. By implementing rigorous testing, inspection, and certification processes, these regulatory bodies safeguard public health and the environment, making Japan a global leader in regulatory compliance.
What are the market trends shaping the Testing, Inspection, and Certification in Japan Industry?
- The adoption of artificial intelligence (AI) and machine learning (ML) is increasingly prevalent in testing, inspection, and certification services. This emerging market trend mandates professional expertise in implementing these technologies.
- Artificial intelligence (AI) and machine learning (ML) technologies have significantly influenced testing, inspection, and certification services in Japan, introducing innovative methods for quality assurance, process optimization, and compliance verification. The integration of AI and ML has brought about substantial progress in predictive analytics, automation, and data-driven decision-making, revolutionizing the effectiveness, efficiency, and reach of testing, inspection, and certification services across various sectors. These technologies are increasingly utilized to streamline testing processes for various products, systems, and procedures, optimizing testing schedules, resource allocation, and result analysis. AI and ML have transformed testing in Japan by enhancing accuracy, reducing human error, and increasing productivity.
- For instance, predictive analytics enables early detection of potential issues, while automation speeds up repetitive tasks, allowing human experts to focus on complex problem-solving. The application of AI and ML in testing, inspection, and certification services continues to evolve, offering promising opportunities for improved efficiency, quality, and innovation.
What challenges does the Testing, Inspection, and Certification in Japan Industry face during its growth?
- The escalating costs associated with testing, inspection, and certification services pose a significant challenge to the industry's growth trajectory.
- The market faces a significant challenge due to the high financial burden associated with these services. This cost barrier affects various industries and organizations, leading to repercussions such as reduced competitiveness, challenges to market entry, and increased operational expenses. The cost for testing, inspection, and certification services varies in Japan, with prices ranging from USD680 to USD3,408. Small and medium-sized enterprises (SMEs) in Japan are particularly impacted, as they often lack the financial resources to cover these expenses. Consequently, they face limited access to international trade and global markets. This high cost trend is a continuous issue in the market, necessitating ongoing attention and potential solutions to ensure businesses can effectively navigate the testing, inspection, and certification landscape in Japan.
Exclusive Customer Landscape
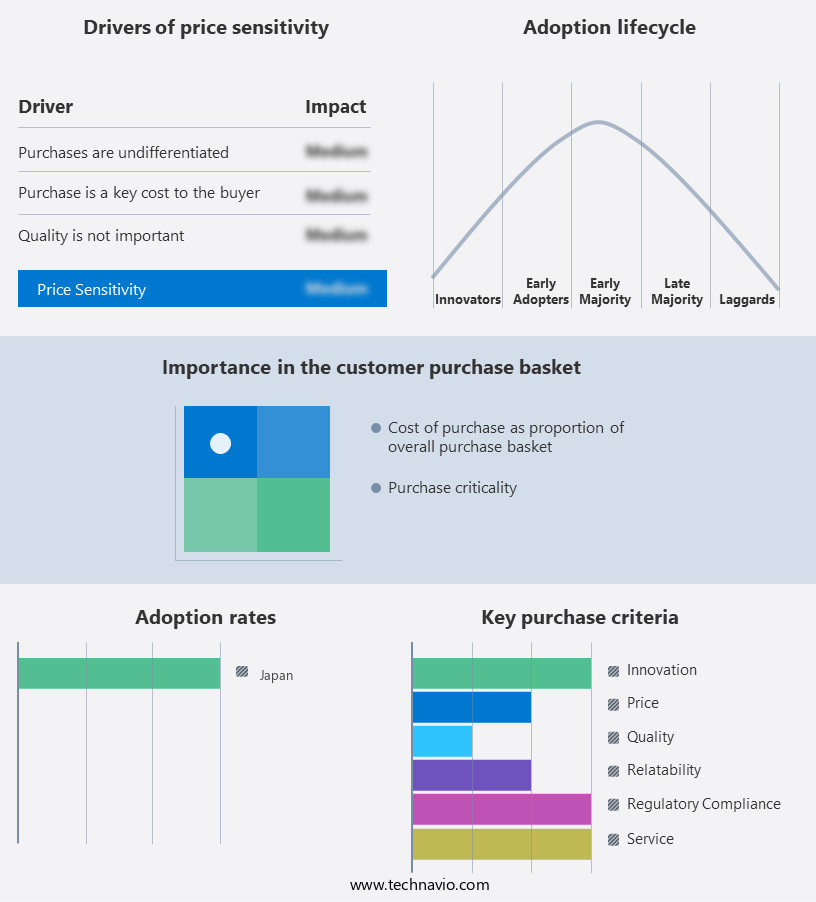
The Japan testing, inspection, and certification market forecasting report includes the adoption lifecycle of the market, covering from the innovator's stage to the laggard's stage. It focuses on adoption rates in different regions based on penetration. Furthermore, the Japan testing, inspection, and certification market report also includes key purchase criteria and drivers of price sensitivity to help companies evaluate and develop their market growth analysis strategies.
Customer Landscape of Testing, Inspection, and Certification in Japan Industry
Competitive Landscape & Market Insights
Companies are implementing various strategies, such as strategic alliances, Japan testing, inspection, and certification market forecast, partnerships, mergers and acquisitions, geographical expansion, and product/service launches, to enhance their presence in the industry.
American Bureau of Shipping - ABS Group of Companies Inc., a subsidiary of the global organization, provides product testing, inspection, and certification services through the ABS QE Audit Process. This rigorous evaluation ensures compliance with industry standards, issuing ABS QE Audit Process certificates to validate product quality and safety.
The industry research and growth report includes detailed analyses of the competitive landscape of the market and information about key companies, including:
- American Bureau of Shipping
- AmSpec LLC
- Apave Group
- Applus Services S.A.
- AsureQuality Ltd.
- Bureau Veritas SA
- Cotecna Inspection SA
- DEKRA SE
- DNV Group AS
- Element Materials Technology Group Ltd.
- Eurofins Scientific SE
- Helmsman Quality and Technology Services Co. Ltd.
- Intertek Group Plc
- Japan Inspection Co. Ltd.
- L and T Technology Services Ltd.
- SGS SA
- TUV NORD Group
- TUV Rheinland AG
- TUV SUD AG
- UL Solutions Inc.
Qualitative and quantitative analysis of companies has been conducted to help clients understand the wider business environment as well as the strengths and weaknesses of key industry players. Data is qualitatively analyzed to categorize companies as pure play, category-focused, industry-focused, and diversified; it is quantitatively analyzed to categorize companies as dominant, leading, strong, tentative, and weak.
Recent Development and News in Testing, Inspection, And Certification Market In Japan
- In January 2024, TÜV SÜD, a global testing, inspection, and certification organization, announced the expansion of its operations in Japan by opening a new laboratory in Tokyo. This expansion aimed to support the growing demand for safety and quality testing in the automotive and industrial sectors (TÜV SÜD press release).
- In March 2024, Intertek, a leading total quality and inspection company, entered into a strategic partnership with Mitsui O.S.K. Lines, Ltd., a Japanese shipping company, to provide inspection and certification services for their global fleet. This collaboration was expected to enhance Intertek's presence in the maritime industry and strengthen Mitsui O.S.K. Lines' commitment to safety and compliance (Intertek press release).
- In May 2024, SGS, a leading inspection, verification, testing, and certification company, acquired a majority stake in a Japanese food testing laboratory, expanding its food testing capabilities in the region. The acquisition was part of SGS's growth strategy to strengthen its presence in the Japanese food safety testing market (SGS press release).
- In February 2025, the Japanese government announced the implementation of new regulations for construction projects, mandating third-party inspections and certifications to ensure safety and quality. This initiative was expected to boost the demand for testing, inspection, and certification services in the Japanese construction industry (Japanese Ministry of Land, Infrastructure, Transport and Tourism press release).
Dive into Technavio's robust research methodology, blending expert interviews, extensive data synthesis, and validated models for unparalleled Japan Testing, Inspection, and Certification Market insights. See full methodology.
|
Market Scope |
|
|
Report Coverage |
Details |
|
Page number |
161 |
|
Base year |
2023 |
|
Historic period |
2018-2022 |
|
Forecast period |
2024-2028 |
|
Growth momentum & CAGR |
Accelerate at a CAGR of 3.71% |
|
Market growth 2024-2028 |
USD 3.10 billion |
|
Market structure |
Fragmented |
|
YoY growth 2023-2024(%) |
3.21 |
|
Key countries |
Japan |
|
Competitive landscape |
Leading Companies, Market Positioning of Companies, Competitive Strategies, and Industry Risks |
Research Analyst Overview
- In the dynamic and evolving the market, material testing plays a pivotal role in ensuring product quality and regulatory compliance. Inspection reporting, a crucial aspect of this process, provides valuable data for quality control metrics. Non-destructive testing methodologies, such as ultrasonic and magnetic particle inspection, are increasingly popular due to their ability to assess the integrity of components without damaging them. Risk assessment methods are integral to the testing process, helping to identify potential hazards and prevent safety issues. Regulatory compliance is a significant driver of market activity, with certification bodies enforcing stringent standards.
- Performance testing, corrective actions, and root cause analysis are essential components of quality management systems. Quality assurance systems rely on certification standards, auditing procedures, and calibration procedures to maintain data integrity and continuous improvement. Defect detection is a continuous process, with inspection protocols and preventive measures ensuring the highest standards. Environmental testing is also a critical aspect, with inspection tools designed to assess the impact of various conditions on materials and products. Safety testing is another key area, with ISO 9001 certification and traceability systems ensuring the highest levels of product validation. Process verification and quality control charts are essential tools for monitoring and improving production processes.
- Destructive testing, while less common, is sometimes necessary for evaluating the limits of materials and components. In this market, non-destructive testing, risk assessment methods, and regulatory compliance are driving trends. Quality control metrics, inspection reporting, and data integrity are key performance indicators. The use of advanced testing equipment and certification standards is on the rise, reflecting the industry's commitment to innovation and continuous improvement.
What are the Key Data Covered in this Japan Testing, Inspection, and Certification Market Research and Growth Report?
-
What is the expected growth of the Japan Testing, Inspection, and Certification Market between 2024 and 2028?
-
USD 3.10 billion, at a CAGR of 3.71%
-
-
What segmentation does the market report cover?
-
The report segmented by Service Type (Testing and inspection service and Certification service), Source (In-house and Outsourced), End-user (Infrastructure, Energy and power, Healthcare, Manufacturing, and Others), and Geography (APAC)
-
-
Which regions are analyzed in the report?
-
Japan
-
-
What are the key growth drivers and market challenges?
-
Stringent government regulations to ensure product and environmental safety, High cost of testing, inspection, and certification service
-
-
Who are the major players in the Testing, Inspection, and Certification Market in Japan?
-
Key Companies American Bureau of Shipping, AmSpec LLC, Apave Group, Applus Services S.A., AsureQuality Ltd., Bureau Veritas SA, Cotecna Inspection SA, DEKRA SE, DNV Group AS, Element Materials Technology Group Ltd., Eurofins Scientific SE, Helmsman Quality and Technology Services Co. Ltd., Intertek Group Plc, Japan Inspection Co. Ltd., L and T Technology Services Ltd., SGS SA, TUV NORD Group, TUV Rheinland AG, TUV SUD AG, and UL Solutions Inc.
-
Market Research Insights
- The market is a critical component of the country's industrial sector, underpinned by a commitment to quality and compliance. With an increasing focus on process audits and operational efficiency, this market is driven by the need for quality assurance and performance analysis. According to industry estimates, the testing procedures market in Japan was valued at USD12 billion in 2020, with a growth rate of 3% projected annually. Compliance verification and certification schemes are also significant areas of investment, with over 60% of Japanese companies holding at least one certification. Environmental impact is a key consideration, with process validation and testing standards prioritizing sustainability.
- Data management plays a crucial role in inspection planning and report generation, ensuring quality systems remain effective and efficient. Material science and inspection techniques are continually evolving, with equipment calibration and certification processes ensuring accuracy and reliability. Defect prevention and failure modes analysis are integral to risk management, driving continuous improvement and enhancing product safety and reliability.
We can help! Our analysts can customize this Japan testing, inspection, and certification market research report to meet your requirements.
 RIA -
RIA - 
