Thermal Paper Market Analysis North America, Europe, APAC, South America, Middle East and Africa - US, Germany, France, UK, China - Size and Forecast 2024-2028

Thermal Paper Market Analysis North America, Europe, APAC, South America, Middle East and Africa - US, Germany, France, UK, China - Size and Forecast 2024-2028

Published: Oct 2024 139 Pages SKU: IRTNTR71308

Market Overview at a Glance

$909.2 Mn
Market Opportunity
3.4%
CAGR
3.3
YoY growth 2023-2024(%)

Thermal Paper Market Size 2024-2028

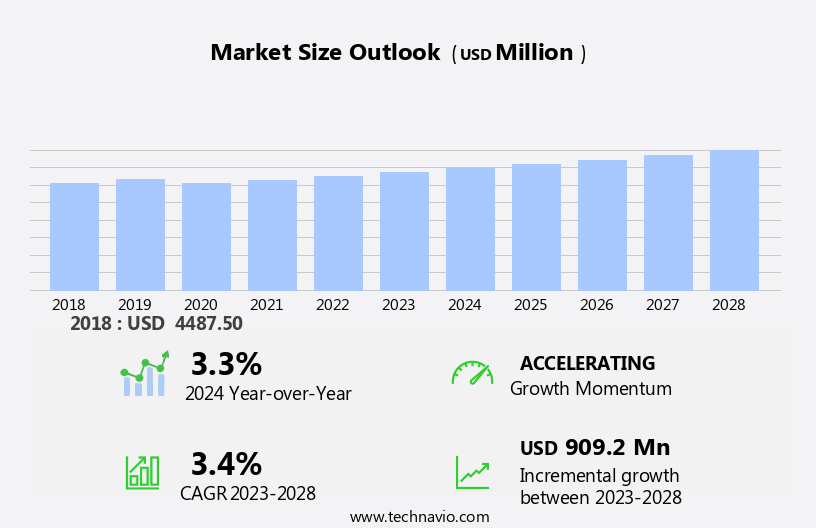
The thermal paper market size is forecast to increase by USD 909.2 million at a CAGR of 3.4% between 2023 and 2028.

  • The market is experiencing significant growth due to several key drivers. The increasing trend toward cashless transactions is one major factor, as more businesses adopt point-of-sale (POS) systems and electronic receipts. Additionally, favorable government initiatives, such as incentives for eco-friendly practices, are encouraging the adoption of renewable thermal paper processes and the use of recycled thermal paper. Additionally, the use of thermal paper is expanding in the warehousing and logistics sectors for labeling and tracking purposes. The demand for high-quality thermal paper with excellent color retention and durable surfaces is also driving market growth. As consumers and businesses continue to prioritize sustainability, there is a growing interest in eco-friendly paper solutions.

What will be the Size of the Thermal Paper Market During the Forecast Period?

Thermal Paper Market Size

 Request Free Sample

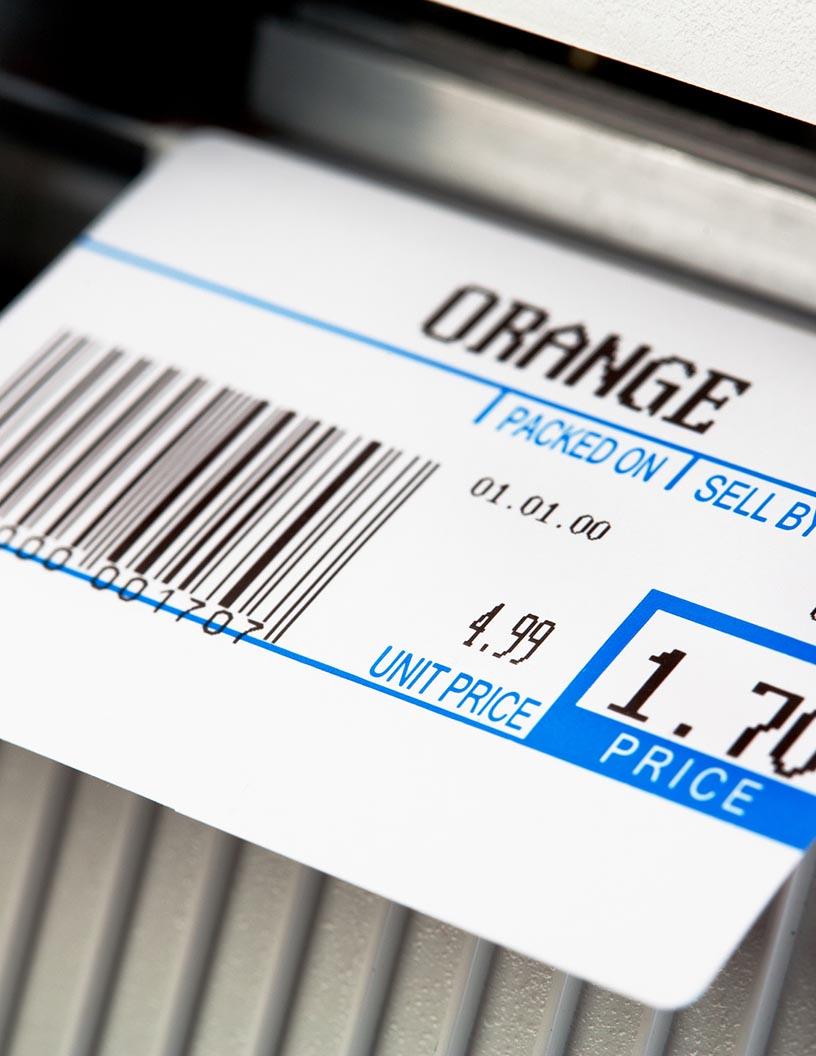
  • The market is a significant segment In the larger printing industry, primarily used for various applications in retail, logistics, healthcare, education, and food industries. This market is driven by the increasing demand for efficient labeling and ticketing solutions in various sectors. They play a crucial role in various industries, including retail stores, warehouses, and POS terminals. In retail, tit is extensively used for producing cash register receipts, price tags, and labels. In logistics, it is used for creating shipping labels and tracking documents. In healthcare, it is used for producing patient records and labels.
  • In education, it is used for creating attendance records and labels for student belongings. In the food industry, particularly in packaged food, it is used for printing expiration dates and nutritional information. The market is witnessing growth due to several factors. The need for efficient labeling and ticketing solutions is driving the demand. Retail chains, grocery chains, and inventory systems rely heavily on thermal paper for their labeling processes. The use of thermal paper in POS systems is also increasing due to its direct heat solutions, which provide quick and accurate results. Moreover, the trend towards eco-friendly and renewable processes is influencing the market.

How is this Thermal Paper Industry segmented and which is the largest segment?

The industry research report provides comprehensive data (region-wise segment analysis), with forecasts and estimates in "USD million" for the period 2024-2028, as well as historical data from 2018-2022 for the following segments.

  • Application
    • PoS
    • Tags and labels
    • Lottery and gaming
    • Others
  • Geography
    • North America
      • US
    • Europe
      • Germany
      • UK
      • France
    • APAC
      • China
    • South America
    • Middle East and Africa

By Application Insights

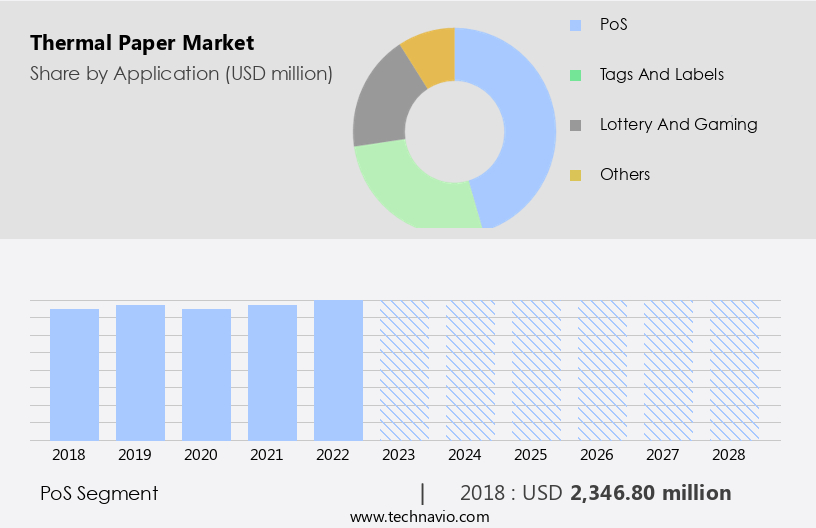
  • The PoS segment is estimated to witness significant growth during the forecast period.

In the business world, Point of Sale (PoS) receipts have become an essential component of transactions, whether it's a purchase of goods or a service. These receipts are generated at various retail outlets, including grocery stores, supermarkets, hypermarkets, convenience stores, restaurants, clubs, gas pumps, and parking lots. PoS receipts come in various forms, such as grocery receipts, restaurant receipts, and parking receipts. Thermal paper is the primary material used to produce these receipts due to its ability to produce high-quality prints. companies provide thermal paper with advanced features, including imaging on both sides, graphics capabilities, and barcode and logo imaging.

The market caters to various industries, including pharmaceuticals, commercial printing, and educational materials. Direct thermal technology is widely used in the production of thermal paper, making it an ideal choice for PoS receipts due to its ability to produce high-quality images without the need for additional heat or pressure. Moreover, thermal paper is suitable for flexographic and ultraviolet (UV) lithography printing, further expanding its applications. Additionally, it is used in other industries, such as shipping labels, kiosk cards, tourist tags, and RFID identification. Noise reduction is a crucial factor In thermal paper production, ensuring clear and legible prints.

Thermal Paper Market Size

Get a glance at the  Industry report of share of various segments Request Free Sample

The PoS segment was valued at USD 2.35 billion in 2018 and showed a gradual increase during the forecast period.

Regional Analysis

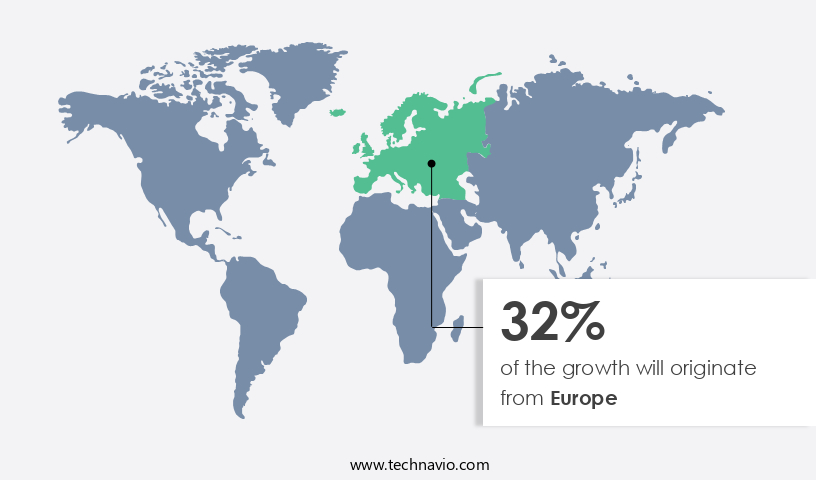
  • Europe is estimated to contribute 32% to the growth of the global market during the forecast period.

Technavio's analysts have elaborately explained the regional trends and drivers that shape the market during the forecast period.

Thermal Paper Market Share by Geography

For more insights on the market share of various regions, Request Free Sample

In the United States, Canada, and Mexico, the retail sector has experienced significant expansion, leading to an increase In the number of retail outlets, particularly from multinational fast-food chains, supermarkets, and hypermarkets. This growth has resulted in a heightened demand for billing operations. Moreover, there is a rising trend In the consumption of pharmaceutical and healthcare products, including medications and dietary supplements, due to the growing health concerns among consumers In the region. Thermal paper plays a crucial role In the pharmaceutical industry, where it is utilized for tagging, labeling applications, and barcodes on medical device packaging.

Market Dynamics

Our researchers analyzed the data with 2023 as the base year, along with the key drivers, trends, and challenges. A holistic analysis of drivers will help companies refine their marketing strategies to gain a competitive advantage.

What are the key market drivers leading to the rise In the adoption of Thermal Paper Industry?

Growing preference for cashless transactions is the key driver of the market.

  • In today's digital age, the use of cashless transactions through POS terminals is becoming increasingly prevalent in various industries, including retail stores, warehouses, and e-commerce platforms. The adoption of cashless payments is on the rise and other developed countries due to the convenience and efficiency they offer. Thermal paper, a crucial component of this trend, is extensively used for printing receipts, labels, and tags In these transactions. Thermal paper is a significant requirement for retail chains, as it is used for producing E-receipts, which are becoming increasingly popular. Paper manufacturers are continually innovating to meet the growing demand for thermal paper with enhanced thermal stability and the integration of recycled fibers.
  • Additionally, RFID tags are increasingly being used in place of traditional barcode labels, further increasing the demand. The growth of e-commerce and the shift towards digital transactions have significantly impacted the market. With the increasing number of retail stores and warehouses adopting digital payment systems, the demand is expected to remain strong. The integration of advanced technologies such as RFID tags and the increasing popularity of e-receipts are expected to drive the growth of the market In the US and other developed countries.

What are the market trends shaping the Thermal Paper Industry?

Favorable government initiatives is the upcoming market trend.

  • In response to the global push toward a cashless economy, governments worldwide have been advocating for the expansion of Point of Sale (PoS) systems in various sectors, including public utilities, transportation, and retail markets. Consequently, there has been a significant increase In the production of thermal paper for tickets and inventory management systems. To further promote the adoption of PoS infrastructure in underdeveloped areas, the RBI established the Payments Infrastructure Development Fund (PIDF) in January 2021. This initiative aims to encourage the deployment of PoS terminals in Tier-3 to Tier-6 cities and the northeastern states of India.
  • Thus, the demand is expected to continue growing as PoS systems become more prevalent. However, there is a growing concern about the environmental impact of thermal paper, which is not recyclable and requires direct heat solutions for printing. To address this issue, renewable processes for thermal paper production and the use of recycled thermal paper are gaining popularity. Moreover, eco-friendly alternatives, such as color retention and durable surface thermal papers, are being developed to enhance the sustainability of thermal paper. 

What challenges does the Thermal Paper Industry face during its growth?

Growing preference for e-receipts is a key challenge affecting the industry growth.

  • In today's digital age, the use of e-receipts as an alternative to traditional paper receipts is becoming increasingly popular among consumers and businesses alike. E-receipts, which are electronic versions of sales receipts, are sent to consumers via SMS or email after a purchase is made. The shift towards e-receipts is driven by several factors, including the convenience of contactless payments and the elimination of the risk of losing paper receipts. Moreover, e-receipts offer various advantages over paper receipts, particularly in Point of Sale (POS) applications and warehousing activities. For instance, POS systems can process transactions faster with e-receipts, reducing wait times for customers.
  • In addition, e-receipts can be easily stored and accessed for future reference, making it easier for businesses to manage their records and for consumers to keep track of their expenses. Furthermore, e-receipts are also gaining traction in leisure gaming activities and online ticketing platforms. Thermal paper, which has traditionally been used for printing receipts, is being replaced by alternative printing technologies such as direct transfer and thermal transfer. These technologies offer advantages such as faster printing speeds, higher resolution, and the ability to print on various substrates. Additionally, the use of eco-friendly coatings is becoming more common as businesses seek to reduce their carbon footprint.

Exclusive Customer Landscape

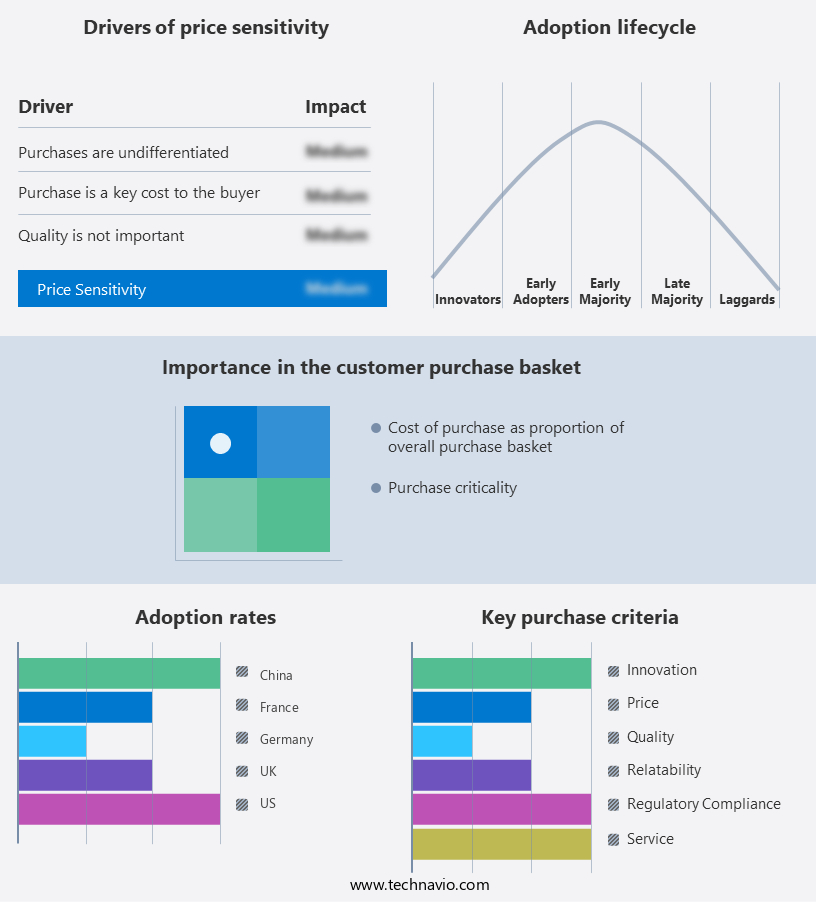
The market forecasting report includes the adoption lifecycle of the market, covering from the innovator's stage to the laggard's stage. It focuses on adoption rates in different regions based on penetration. Furthermore, the market report also includes key purchase criteria and drivers of price sensitivity to help companies evaluate and develop their market growth analysis strategies.

Thermal Paper Market Share by Geography

 Customer Landscape

Key Companies & Market Insights

Companies are implementing various strategies, such as strategic alliances, market forecast, partnerships, mergers and acquisitions, geographical expansion, and product/service launches, to enhance their presence In the industry.

The industry research and growth report includes detailed analyses of the competitive landscape of the market and information about key companies, including:

  • Appvion Operations Inc.
  • Domtar Corp.
  • Guangdong Guanhao High-tech Co., Ltd.
  • Hansol Paper Ltd.
  • Henan JiangHE Paper Co. Ltd.
  • Iconex LLC
  • Kanzaki Specialty Papers Inc.
  • Koehler Paper SE
  • Mitsubishi Paper Mills Ltd.
  • Nakagawa Manufacturing (USA), Inc
  • Nippon Paper Industries Co. Ltd.
  • Oji Holdings Corp.
  • PG Paper Co. Ltd.
  • Ricoh Co. Ltd.
  • Rotolificio Bergamasco Srl
  • Shandong Chenming Paper Group Co., Ltd.
  • Shandong Ultra Paper Co. Ltd.
  • Telemark Corp
  • Thermal Solutions International Inc.
  • Torraspapel S.A.

Qualitative and quantitative analysis of companies has been conducted to help clients understand the wider business environment as well as the strengths and weaknesses of key industry players. Data is qualitatively analyzed to categorize companies as pure play, category-focused, industry-focused, and diversified; it is quantitatively analyzed to categorize companies as dominant, leading, strong, tentative, and weak.

Research Analyst Overview

The market caters to various industries such as retail, logistics, healthcare, and leisure activities. In retail environments, thermal paper is extensively used for POS terminals, labels and tags, and e-receipts. Warehouses and industrial applications utilize thermal paper for inventory systems, shipping labels, and kiosk cards. E-commerce platforms and online ticketing platforms also rely on thermal paper for printing tickets and labels. The manufacturers produce papers with thermal stability, ensuring color retention and a durable surface for barcodes and product labels. The use of recycled fibers and eco-friendly coatings has gained popularity In the market, aligning with the growing demand for environmentally friendly solutions.

Moreover, direct heat solutions, such as direct thermal and thermal transfer technology, enable fast printing speeds and are widely adopted in various industries. Direct thermal technology is particularly popular in applications where no ink is required, such as cash register receipts and healthcare records. Thermal paper is also used In the pharmaceutical industry for labeling and in lottery and gaming activities for tickets and tourist tags. Noise reduction and graphics capabilities are essential features for commercial printing applications. Alternative printing technologies, such as dispersible direct thermal and digital receipts, are gaining traction due to their environmental benefits and cost-effectiveness.

Furthermore, renewable processes and eco-friendly coatings are also being explored to reduce greenhouse gas emissions. The market encompasses a wide range of applications, from cashless transactions in retail stores to labeling processes in warehousing activities. It is a dynamic and evolving market, with ongoing advancements in technology and sustainability.

Market Scope

Report Coverage

Details

Page number

139

Base year

2023

Historic period

2018-2022

Forecast period

2024-2028

Growth momentum & CAGR

Accelerate at a CAGR of 3.4%

Market Growth 2024-2028

USD 909.2 million

Market structure

Fragmented

YoY growth 2023-2024(%)

3.3

Key countries

US, Germany, France, UK, and China

Competitive landscape

Leading Companies, Market Positioning of Companies, Competitive Strategies, and Industry Risks

Request Free Sample

What are the Key Data Covered in this Market Research and Growth Report?

  • CAGR of the industry during the forecast period
  • Detailed information on factors that will drive the market growth and forecasting between 2024 and 2028
  • Precise estimation of the size of the market and its contribution to the industry in focus on the parent market
  • Accurate predictions about upcoming growth and trends and changes in consumer behaviour
  • Growth of the market across North America, Europe, APAC, South America, and Middle East and Africa
  • A thorough analysis of the market's competitive landscape and detailed information about companies
  • Comprehensive analysis of factors that will challenge the market growth of industry companies

We can help! Our analysts can customize this market research report to meet your requirements.

Get in touch

1 Executive Summary

  • 1.1 Market overview
    • Executive Summary - Chart on Market Overview
    • Executive Summary - Data Table on Market Overview
    • Executive Summary - Chart on Global Market Characteristics
    • Executive Summary - Chart on Market by Geography
    • Executive Summary - Chart on Market Segmentation by Application
    • Executive Summary - Chart on Incremental Growth
    • Executive Summary - Data Table on Incremental Growth
    • Executive Summary - Chart on Company Market Positioning

2 Market Landscape

  • 2.1 Market ecosystem
    • Parent Market
    • Data Table on - Parent Market
  • 2.2 Market characteristics
    • Market characteristics analysis
  • 2.3 Value chain analysis
    • Value Chain Analysis

3 Market Sizing

  • 3.1 Market definition
    • Offerings of companies included in the market definition
  • 3.2 Market segment analysis
    • Market segments
  • 3.3 Market size 2023
    • 3.4 Market outlook: Forecast for 2023-2028
      • Chart on Global - Market size and forecast 2023-2028 ($ million)
      • Data Table on Global - Market size and forecast 2023-2028 ($ million)
      • Chart on Global Market: Year-over-year growth 2023-2028 (%)
      • Data Table on Global Market: Year-over-year growth 2023-2028 (%)

    4 Historic Market Size

    • 4.1 Global Thermal Paper Market 2018 - 2022
      • Historic Market Size - Data Table on Global Thermal Paper Market 2018 - 2022 ($ million)
    • 4.2 Application segment analysis 2018 - 2022
      • Historic Market Size - Application Segment 2018 - 2022 ($ million)
    • 4.3 Geography segment analysis 2018 - 2022
      • Historic Market Size - Geography Segment 2018 - 2022 ($ million)
    • 4.4 Country segment analysis 2018 - 2022
      • Historic Market Size - Country Segment 2018 - 2022 ($ million)

    5 Five Forces Analysis

    • 5.1 Five forces summary
      • Five forces analysis - Comparison between 2023 and 2028
    • 5.2 Bargaining power of buyers
      • Bargaining power of buyers - Impact of key factors 2023 and 2028
    • 5.3 Bargaining power of suppliers
      • Bargaining power of suppliers - Impact of key factors in 2023 and 2028
    • 5.4 Threat of new entrants
      • Threat of new entrants - Impact of key factors in 2023 and 2028
    • 5.5 Threat of substitutes
      • Threat of substitutes - Impact of key factors in 2023 and 2028
    • 5.6 Threat of rivalry
      • Threat of rivalry - Impact of key factors in 2023 and 2028
    • 5.7 Market condition
      • Chart on Market condition - Five forces 2023 and 2028

    6 Market Segmentation by Application

    • 6.1 Market segments
      • Chart on Application - Market share 2023-2028 (%)
      • Data Table on Application - Market share 2023-2028 (%)
    • 6.2 Comparison by Application
      • Chart on Comparison by Application
      • Data Table on Comparison by Application
    • 6.3 PoS - Market size and forecast 2023-2028
      • Chart on PoS - Market size and forecast 2023-2028 ($ million)
      • Data Table on PoS - Market size and forecast 2023-2028 ($ million)
      • Chart on PoS - Year-over-year growth 2023-2028 (%)
      • Data Table on PoS - Year-over-year growth 2023-2028 (%)
    • 6.4 Tags and labels - Market size and forecast 2023-2028
      • Chart on Tags and labels - Market size and forecast 2023-2028 ($ million)
      • Data Table on Tags and labels - Market size and forecast 2023-2028 ($ million)
      • Chart on Tags and labels - Year-over-year growth 2023-2028 (%)
      • Data Table on Tags and labels - Year-over-year growth 2023-2028 (%)
    • 6.5 Lottery and gaming - Market size and forecast 2023-2028
      • Chart on Lottery and gaming - Market size and forecast 2023-2028 ($ million)
      • Data Table on Lottery and gaming - Market size and forecast 2023-2028 ($ million)
      • Chart on Lottery and gaming - Year-over-year growth 2023-2028 (%)
      • Data Table on Lottery and gaming - Year-over-year growth 2023-2028 (%)
    • 6.6 Others - Market size and forecast 2023-2028
      • Chart on Others - Market size and forecast 2023-2028 ($ million)
      • Data Table on Others - Market size and forecast 2023-2028 ($ million)
      • Chart on Others - Year-over-year growth 2023-2028 (%)
      • Data Table on Others - Year-over-year growth 2023-2028 (%)
    • 6.7 Market opportunity by Application
      • Market opportunity by Application ($ million)
      • Data Table on Market opportunity by Application ($ million)

    7 Customer Landscape

    • 7.1 Customer landscape overview
      • Analysis of price sensitivity, lifecycle, customer purchase basket, adoption rates, and purchase criteria

    8 Geographic Landscape

    • 8.1 Geographic segmentation
      • Chart on Market share by geography 2023-2028 (%)
      • Data Table on Market share by geography 2023-2028 (%)
    • 8.2 Geographic comparison
      • Chart on Geographic comparison
      • Data Table on Geographic comparison
    • 8.3 North America - Market size and forecast 2023-2028
      • Chart on North America - Market size and forecast 2023-2028 ($ million)
      • Data Table on North America - Market size and forecast 2023-2028 ($ million)
      • Chart on North America - Year-over-year growth 2023-2028 (%)
      • Data Table on North America - Year-over-year growth 2023-2028 (%)
    • 8.4 Europe - Market size and forecast 2023-2028
      • Chart on Europe - Market size and forecast 2023-2028 ($ million)
      • Data Table on Europe - Market size and forecast 2023-2028 ($ million)
      • Chart on Europe - Year-over-year growth 2023-2028 (%)
      • Data Table on Europe - Year-over-year growth 2023-2028 (%)
    • 8.5 APAC - Market size and forecast 2023-2028
      • Chart on APAC - Market size and forecast 2023-2028 ($ million)
      • Data Table on APAC - Market size and forecast 2023-2028 ($ million)
      • Chart on APAC - Year-over-year growth 2023-2028 (%)
      • Data Table on APAC - Year-over-year growth 2023-2028 (%)
    • 8.6 South America - Market size and forecast 2023-2028
      • Chart on South America - Market size and forecast 2023-2028 ($ million)
      • Data Table on South America - Market size and forecast 2023-2028 ($ million)
      • Chart on South America - Year-over-year growth 2023-2028 (%)
      • Data Table on South America - Year-over-year growth 2023-2028 (%)
    • 8.7 Middle East and Africa - Market size and forecast 2023-2028
      • Chart on Middle East and Africa - Market size and forecast 2023-2028 ($ million)
      • Data Table on Middle East and Africa - Market size and forecast 2023-2028 ($ million)
      • Chart on Middle East and Africa - Year-over-year growth 2023-2028 (%)
      • Data Table on Middle East and Africa - Year-over-year growth 2023-2028 (%)
    • 8.8 US - Market size and forecast 2023-2028
      • Chart on US - Market size and forecast 2023-2028 ($ million)
      • Data Table on US - Market size and forecast 2023-2028 ($ million)
      • Chart on US - Year-over-year growth 2023-2028 (%)
      • Data Table on US - Year-over-year growth 2023-2028 (%)
    • 8.9 Germany - Market size and forecast 2023-2028
      • Chart on Germany - Market size and forecast 2023-2028 ($ million)
      • Data Table on Germany - Market size and forecast 2023-2028 ($ million)
      • Chart on Germany - Year-over-year growth 2023-2028 (%)
      • Data Table on Germany - Year-over-year growth 2023-2028 (%)
    • 8.10 France - Market size and forecast 2023-2028
      • Chart on France - Market size and forecast 2023-2028 ($ million)
      • Data Table on France - Market size and forecast 2023-2028 ($ million)
      • Chart on France - Year-over-year growth 2023-2028 (%)
      • Data Table on France - Year-over-year growth 2023-2028 (%)
    • 8.11 UK - Market size and forecast 2023-2028
      • Chart on UK - Market size and forecast 2023-2028 ($ million)
      • Data Table on UK - Market size and forecast 2023-2028 ($ million)
      • Chart on UK - Year-over-year growth 2023-2028 (%)
      • Data Table on UK - Year-over-year growth 2023-2028 (%)
    • 8.12 China - Market size and forecast 2023-2028
      • Chart on China - Market size and forecast 2023-2028 ($ million)
      • Data Table on China - Market size and forecast 2023-2028 ($ million)
      • Chart on China - Year-over-year growth 2023-2028 (%)
      • Data Table on China - Year-over-year growth 2023-2028 (%)
    • 8.13 Market opportunity by geography
      • Market opportunity by geography ($ million)
      • Data Tables on Market opportunity by geography ($ million)

    9 Drivers, Challenges, and Opportunity/Restraints

    • 9.1 Market drivers
      • 9.2 Market challenges
        • 9.3 Impact of drivers and challenges
          • Impact of drivers and challenges in 2023 and 2028
        • 9.4 Market opportunities/restraints

          10 Competitive Landscape

          • 10.1 Overview
            • 10.2 Competitive Landscape
              • Overview on criticality of inputs and factors of differentiation
            • 10.3 Landscape disruption
              • Overview on factors of disruption
            • 10.4 Industry risks
              • Impact of key risks on business

            11 Competitive Analysis

            • 11.1 Companies profiled
              • Companies covered
            • 11.2 Market positioning of companies
              • Matrix on companies position and classification
            • 11.3 Appvion Operations Inc.
              • Appvion Operations Inc. - Overview
              • Appvion Operations Inc. - Product / Service
              • Appvion Operations Inc. - Key offerings
            • 11.4 Domtar Corp.
              • Domtar Corp. - Overview
              • Domtar Corp. - Product / Service
              • Domtar Corp. - Key offerings
            • 11.5 Koehler Paper SE
              • Koehler Paper SE - Overview
              • Koehler Paper SE - Product / Service
              • Koehler Paper SE - Key offerings
            • 11.6 Mitsubishi Paper Mills Ltd.
              • Mitsubishi Paper Mills Ltd. - Overview
              • Mitsubishi Paper Mills Ltd. - Product / Service
              • Mitsubishi Paper Mills Ltd. - Key offerings
            • 11.7 Nippon Paper Industries Co. Ltd.
              • Nippon Paper Industries Co. Ltd. - Overview
              • Nippon Paper Industries Co. Ltd. - Business segments
              • Nippon Paper Industries Co. Ltd. - Key news
              • Nippon Paper Industries Co. Ltd. - Key offerings
              • Nippon Paper Industries Co. Ltd. - Segment focus
            • 11.8 Oji Holdings Corp.
              • Oji Holdings Corp. - Overview
              • Oji Holdings Corp. - Business segments
              • Oji Holdings Corp. - Key offerings
              • Oji Holdings Corp. - Segment focus
            • 11.9 Ricoh Co. Ltd.
              • Ricoh Co. Ltd. - Overview
              • Ricoh Co. Ltd. - Business segments
              • Ricoh Co. Ltd. - Key news
              • Ricoh Co. Ltd. - Key offerings
              • Ricoh Co. Ltd. - Segment focus
            • 11.10 Shandong Chenming Paper Group Co., Ltd.
              • Shandong Chenming Paper Group Co., Ltd. - Overview
              • Shandong Chenming Paper Group Co., Ltd. - Product / Service
              • Shandong Chenming Paper Group Co., Ltd. - Key offerings
            • 11.11 Thermal Solutions International Inc.
              • Thermal Solutions International Inc. - Overview
              • Thermal Solutions International Inc. - Product / Service
              • Thermal Solutions International Inc. - Key offerings
            • 11.12 Torraspapel S.A.
              • Torraspapel S.A. - Overview
              • Torraspapel S.A. - Business segments
              • Torraspapel S.A. - Key offerings
              • Torraspapel S.A. - Segment focus

            12 Appendix

            • 12.1 Scope of the report
              • 12.2 Inclusions and exclusions checklist
                • Inclusions checklist
                • Exclusions checklist
              • 12.3 Currency conversion rates for US$
                • Currency conversion rates for US$
              • 12.4 Research methodology
                • Research methodology
              • 12.5 Data procurement
                • Information sources
              • 12.6 Data validation
                • Data validation
              • 12.7 Validation techniques employed for market sizing
                • Validation techniques employed for market sizing
              • 12.8 Data synthesis
                • Data synthesis
              • 12.9 360 degree market analysis
                • 360 degree market analysis
              • 12.10 List of abbreviations
                • List of abbreviations

              Research Methodology

              Technavio presents a detailed picture of the market by way of study, synthesis, and summation of data from multiple sources. The analysts have presented the various facets of the market with a particular focus on identifying the key industry influencers. The data thus presented is comprehensive, reliable, and the result of extensive research, both primary and secondary.

              INFORMATION SOURCES

              Primary sources

              • Manufacturers and suppliers
              • Channel partners
              • Industry experts
              • Strategic decision makers

              Secondary sources

              • Industry journals and periodicals
              • Government data
              • Financial reports of key industry players
              • Historical data
              • Press releases

              DATA ANALYSIS

              Data Synthesis

              • Collation of data
              • Estimation of key figures
              • Analysis of derived insights

              Data Validation

              • Triangulation with data models
              • Reference against proprietary databases
              • Corroboration with industry experts

              REPORT WRITING

              Qualitative

              • Market drivers
              • Market challenges
              • Market trends
              • Five forces analysis

              Quantitative

              • Market size and forecast
              • Market segmentation
              • Geographical insights
              • Competitive landscape

              Interested in this report?

              Get your sample now to see our research methodology and insights!

              Download Now

              Frequently Asked Questions

              Thermal Paper market growth will increase by $ 909.2 mn during 2024-2028 .

              The Thermal Paper market is expected to grow at a CAGR of 3.4% during 2024-2028 .

              Thermal Paper market is segmented by Application( PoS, Tags and labels, Lottery and gaming, Others)

              Appvion Operations Inc., Domtar Corp., Guangdong Guanhao High-tech Co., Ltd., Hansol Paper Ltd., Henan JiangHE Paper Co. Ltd., Iconex LLC, Kanzaki Specialty Papers Inc., Koehler Paper SE, Mitsubishi Paper Mills Ltd., Nakagawa Manufacturing (USA), Inc, Nippon Paper Industries Co. Ltd., Oji Holdings Corp., PG Paper Co. Ltd., Ricoh Co. Ltd., Rotolificio Bergamasco Srl, Shandong Chenming Paper Group Co., Ltd., Shandong Ultra Paper Co. Ltd., Telemark Corp, Thermal Solutions International Inc., Torraspapel S.A. are a few of the key vendors in the Thermal Paper market.

              Europe will register the highest growth rate of 32% among the other regions. Therefore, the Thermal Paper market in Europe is expected to garner significant business opportunities for the vendors during the forecast period.

              US, Germany, France, UK, China

              • Growing preference for cashless transactionsIn developing countries such as India and China is the driving factor this market.
              • cashless payments through cards and digital wallets are rising in prominence. These payments for cashless transactions are accepted at various grocery stores is the driving factor this market.
              • supermarkets is the driving factor this market.
              • convenience stores is the driving factor this market.
              • restaurants is the driving factor this market.
              • clubs is the driving factor this market.
              • parking lots is the driving factor this market.
              • and gas pumps. A wide range of cashless payment methods is available for consumers is the driving factor this market.
              • including debit cards is the driving factor this market.
              • credit cards is the driving factor this market.
              • and digital wallets such as Amazon Pay is the driving factor this market.
              • Google Pay is the driving factor this market.
              • Samsung Pay is the driving factor this market.
              • and Apple Pay. In recent years is the driving factor this market.
              • digital payment mode has witnessed tremendous growth over other alternatives such as payment through cash.The growth in cashless transactions can be attributed to the increasing number of retail outlets and shopping malls in Saudi Arabia. Additionally is the driving factor this market.
              • government initiatives in India is the driving factor this market.
              • such as the Digital India campaign is the driving factor this market.
              • have significantly promoted digital payment methods like banking cards is the driving factor this market.
              • the Unified Payments Interface (UPI) is the driving factor this market.
              • and mobile wallets. The Indian government continues to offer incentives and discounts for cashless transactions. For example is the driving factor this market.
              • in recent years is the driving factor this market.
              • the government has provided tax exemptions and caps on digital payment pricing to encourage digital transactions.The Bharat Interface for Money (BHIM) app is the driving factor this market.
              • developed by the National Payments Corporation of India is the driving factor this market.
              • remains a key tool in promoting cashless transactions. As a result is the driving factor this market.
              • payments in these countries are increasingly being made through cards and digital wallets is the driving factor this market.
              • leading to the generation of payment receipts. This shift has subsequently increased the demand for thermal paper to produce these receipts.In recent years is the driving factor this market.
              • the growth in cashless transactions can be attributed to consumers following the social distancing protocols enforced by the government of countries across the world to curb the spread of COVID-19. Consumers added fears of getting infected with the disease can be attributed to the increased preference for cashless transactions. The pandemic thus accelerated the shift from cash to digital transactions due to consumer demand for contactless payments. A payment receipt is generated when purchases are made through cards and digital wallets. As a result is the driving factor this market.
              • there is an increased usage of thermal paper to generate these receipts. Therefore is the driving factor this market.
              • the growing preference for cashless transactions will drive the growth of the global thermal paper market during the forecast period. is the driving factor this market.

              The Thermal Paper market vendors should focus on grabbing business opportunities from the PoS segment as it accounted for the largest market share in the base year.