
Third-Party Banking Software Market Size 2025-2029
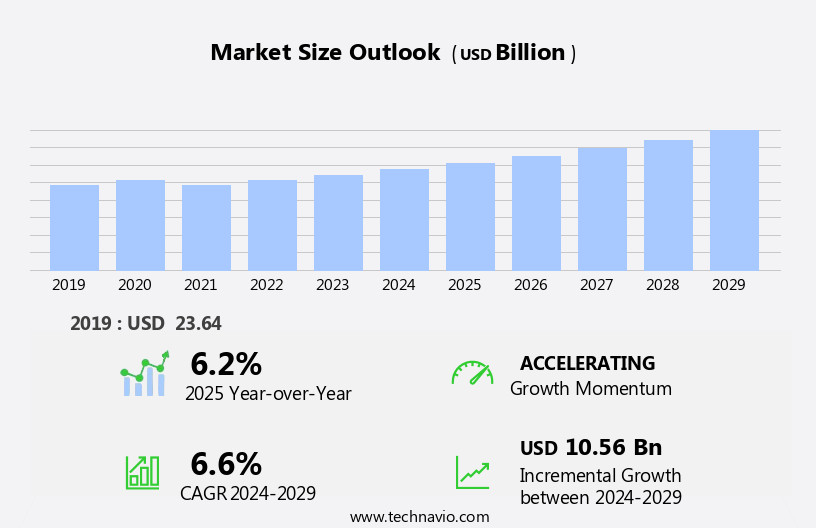
The third-party banking software market size is forecast to increase by USD 10.56 billion at a CAGR of 6.6% between 2024 and 2029.
- The market is witnessing significant growth, driven by the increasing adoption of digital payment solutions and the incorporation of advanced analytics capabilities. Digital transformation in the banking sector is leading to a surge in demand for third-party banking software that enables seamless integration with various digital payment platforms and provides real-time transaction processing and analysis. Furthermore, the integration of analytics into third-party banking software is enabling financial institutions to gain valuable insights into customer behavior and preferences, thereby enhancing customer experience and loyalty. However, the market also faces challenges related to data privacy and security.
- With the increasing use of digital channels for banking transactions, ensuring the security and privacy of customer data is paramount. Breaches and cyber-attacks pose a significant threat to financial institutions and can result in reputational damage and financial losses. Therefore, third-party banking software providers must prioritize data security and privacy to gain the trust of financial institutions and their customers. Additionally, regulatory compliance is another challenge, with financial institutions requiring third-party software providers to adhere to stringent regulatory frameworks to ensure data security and privacy. Companies seeking to capitalize on market opportunities and navigate challenges effectively must focus on providing robust data security and privacy features and ensuring regulatory compliance.
What will be the Size of the Third-Party Banking Software Market during the forecast period?
- The market continues to evolve, driven by the ever-changing needs of financial institutions and their customers. User interfaces are becoming more intuitive, enabling seamless customer acquisition and retention. Open banking and financial wellness initiatives are integrating personalized services, data analytics, and payment processing to enhance the digital banking experience. Businesses are leveraging real-time data, API integration, and machine learning to optimize financial planning and investment management. Workflow automation and artificial intelligence are streamlining customer relationship management and wealth management processes. Digital transformation is also revolutionizing enterprise resource planning and financial education. Moreover, the integration of loan origination, data visualization, and agile development is enabling financial institutions to provide more efficient and effective services.
- Fraud detection and financial inclusion are also becoming essential components of the market, ensuring security and accessibility for all customers. The ongoing digital banking revolution is transforming the financial landscape, with mobile banking and cloud computing playing a significant role. The market's continuous dynamism is reflected in its ability to adapt to emerging trends, such as financial literacy and account aggregation, and incorporate them into its offerings. The future of the market is bright, with endless possibilities for innovation and growth.
How is this Third-Party Banking Software Industry segmented?
The third-party banking software industry research report provides comprehensive data (region-wise segment analysis), with forecasts and estimates in "USD billion" for the period 2025-2029, as well as historical data from 2019-2023 for the following segments.
- Type
- Core banking software
- Omnichannel banking software
- Business intelligence software
- Wealth management software
- Deployment
- On-premises
- Cloud
- Application
- Risk Management
- Information Security
- Business Intelligence
- Service Model
- Managed Services
- Professional Services
- Implementation Services
- Geography
- North America
- US
- Canada
- South America
- Brazil
- Argentina
- Middle East and Africa
- UAE
- Europe
- France
- Germany
- Italy
- UK
- APAC
- China
- India
- Japan
- South Korea
- Rest of World (ROW)
- North America
By Type Insights
The core banking software segment is estimated to witness significant growth during the forecast period.
The market encompasses various solutions that empower financial institutions to enhance their operations and deliver superior customer experiences. Core banking software, a significant segment, focuses on essential banking processes such as loan, credit, deposit, and funds transfer. Multi-channel access via ATMs, Internet banking, and phone banking are also facilitated through this software. The retail banking sector's expansion, driven by government initiatives encouraging account opening, is fueling the demand for core banking software. This growth will encourage companies to offer advanced solutions that cater to user interface customization, customer acquisition, credit cards, open banking, financial wellness, personalized services, data analytics, payment processing, mobile banking, customer retention, financial planning, user experience, business intelligence, workflow automation, artificial intelligence, digital banking, customer experience, fraud detection, financial inclusion, real-time data, API integration, investment management, customer relationship management, wealth management, digital transformation, enterprise resource planning, financial education, loan origination, data visualization, machine learning, cloud computing, financial technology, personal finance management, account aggregation, and agile development.
These features will enable financial institutions to provide financial literacy, loan origination, and fraud detection while ensuring a harmonious user experience.
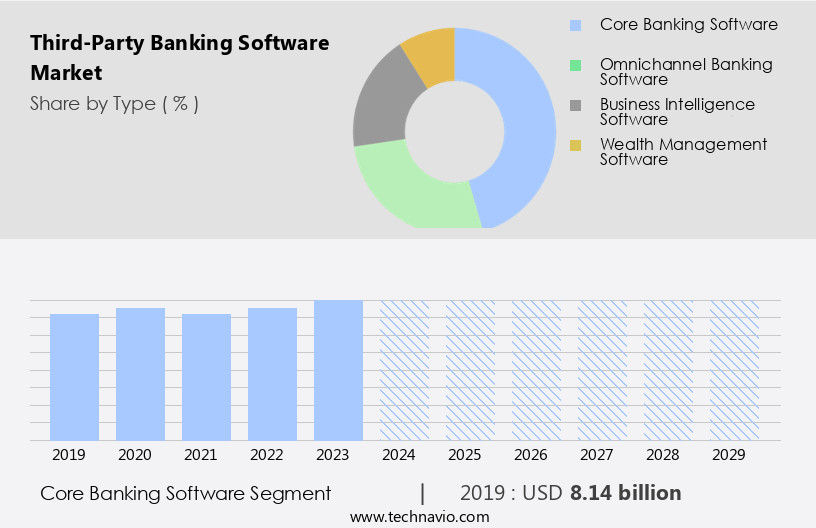
The Core banking software segment was valued at USD 8.14 billion in 2019 and showed a gradual increase during the forecast period.
Regional Analysis
North America is estimated to contribute 29% to the growth of the global market during the forecast period.Technavio's analysts have elaborately explained the regional trends and drivers that shape the market during the forecast period.
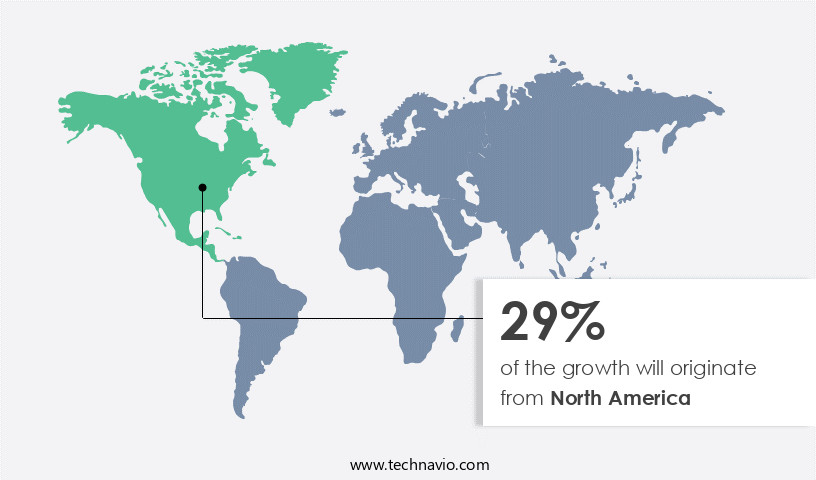
The market in North America is experiencing significant growth due to the region's technological advancements and early adoption of innovative technologies. For example, JPMorgan Chase and Co. Have launched an investing app to cater to the growing number of Millennial investors. User interfaces are being redesigned to provide a more personalized experience, with financial wellness and open banking gaining prominence. Digital banking solutions are increasingly being integrated with credit cards, payment processing, and mobile banking to offer seamless services.
Real-time data and API integration enable financial institutions to offer real-time transaction processing and personalized financial planning. Business intelligence, data analytics, and machine learning are being employed to gain insights into customer behavior and preferences, enhancing customer retention. Workflow automation and artificial intelligence are streamlining processes and improving operational efficiency. Fraud detection and financial inclusion are other key areas of focus, with real-time data and advanced analytics helping to mitigate risks and expand financial services to underserved populations. Digital transformation is driving the adoption of cloud computing, financial technology, and agile development methodologies. Financial education and loan origination are also being integrated into banking software to promote financial literacy and expand access to credit.
Data visualization tools and investment management solutions are helping customers make informed financial decisions. Overall, the market in North America is witnessing a harmonious blend of technology and finance, offering immersive and harmonious digital banking experiences.
Market Dynamics
The Third-Party Banking Software Market is driven by demand for third-party banking software, including core banking software and omnichannel banking software, to enhance operational efficiency. Cloud-based banking software and AI-driven banking software enable scalability and personalization, with AI-driven banking software for fraud detection and real-time fraud detection software for banks addressing security needs. Blockchain banking solutions ensure secure transactions, while mobile banking software supports consumer access. Regulatory compliant software and third-party banking software for compliance meet stringent standards like PSD2. Hyper-personalized banking and omnichannel banking software for customer engagement drive customer retention, with open banking API integration fostering innovation. Scalable banking software for large enterprises, cloud-based banking software for SMEs, and core banking software for digital transformation align with market trends like best third-party banking software for retail and regulatory compliant banking software 2025.
Our researchers analyzed the data with 2024 as the base year, along with the key drivers, trends, and challenges. A holistic analysis of drivers will help companies refine their marketing strategies to gain a competitive advantage.
What are the key market drivers leading to the rise in the adoption of Third-Party Banking Software Industry?
- The increasing prevalence of digital payment solutions serves as the primary catalyst for market growth.
- The market is witnessing significant growth due to the increasing adoption of digital payment solutions in the banking industry. With digital payments projected to account for nearly 90% of total transactions in certain regions by 2030, businesses worldwide are integrating digital payment options into their offerings to streamline processes and gain a competitive edge. One such example is American Express Company's American Express vPayment, a digital payment solution that offers virtual account numbers, enabling businesses to pay and settle various corporate expenses seamlessly. Moreover, financial technology advancements, such as loan origination, data visualization, machine learning, and personal finance management, are driving the market's growth.
- Account aggregation, agile development, and cloud computing are other essential trends contributing to the market's expansion. Furthermore, financial literacy initiatives are fostering increased demand for user-friendly banking software, creating opportunities for market participants. Overall, the market is poised for continued growth as digital transformation continues to reshape the banking sector.
What are the market trends shaping the Third-Party Banking Software Industry?
- The integration of analytics is becoming standard in third-party banking software, reflecting a notable market trend. This enhancement enables more effective data analysis and improved financial management for users.
- The banking industry is experiencing a digital transformation, with customers increasingly relying on mobile devices and technology for accessing financial services. This shift has resulted in an explosion of customer data for enterprises, necessitating advanced analytics capabilities. Third-party banking software with data analytics offers a solution, enabling businesses to make informed decisions, enhance efficiency, mitigate risk, and gain valuable customer insights. Furthermore, personalized services, user-friendly interfaces, open banking, and payment processing are key features driving the adoption of such software.
- Credit card issuers, in particular, can leverage third-party solutions to provide financial wellness services, catering to the evolving needs of their customers. Overall, the integration of third-party banking software with data analytics is a strategic investment for businesses aiming to optimize performance and drive profitability.
What challenges does the Third-Party Banking Software Industry face during its growth?
- Data privacy and security concerns represent a significant challenge to the growth of the industry, necessitating the implementation of robust measures to protect sensitive information and maintain trust with customers.
- Third-party banking software adoption in the banking industry faces significant challenges due to data privacy and security risks. With the increasing use of big data and Artificial Intelligence (AI) in financial planning and customer experience, there is a growing need to securely manage and analyze enterprise data. However, the IT infrastructure, primarily based on open-source codes, poses a threat due to potential vulnerabilities and glitches. Cloud infrastructure, which is popular for its ease of access and cost-effectiveness, is particularly susceptible to cyber attacks due to its open architecture and shared resources.
- Hackers can easily exploit loopholes and vulnerabilities within a system, putting financial data at risk. Workflow automation and business intelligence tools integrated into third-party banking software can offer numerous benefits, but the priority must be given to data security. Ensuring robust security measures and user experience remains essential for customer retention and trust in the digital banking era.
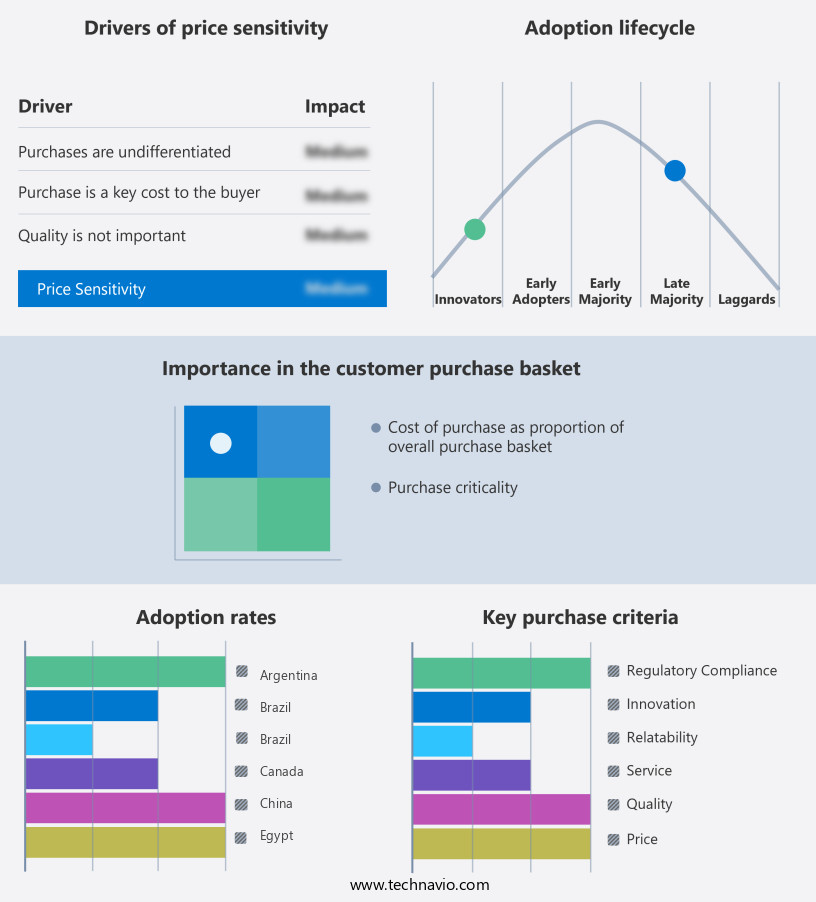
Exclusive Customer Landscape
The third-party banking software market forecasting report includes the adoption lifecycle of the market, covering from the innovator's stage to the laggard's stage. It focuses on adoption rates in different regions based on penetration. Furthermore, the third-party banking software market report also includes key purchase criteria and drivers of price sensitivity to help companies evaluate and develop their market growth analysis strategies.
Customer Landscape
Key Companies & Market Insights
Companies are implementing various strategies, such as strategic alliances, third-party banking software market forecast, partnerships, mergers and acquisitions, geographical expansion, and product/service launches, to enhance their presence in the industry.
Accenture PLC - This company specializes in providing third-party banking solutions for merchants, enabling them to securely process and route various payment types, including major credit and debit cards, through their website or virtual terminal.
The industry research and growth report includes detailed analyses of the competitive landscape of the market and information about key companies, including:
- Accenture PLC
- Capgemini SE
- Fidelity National Information Services Inc.
- Finastra
- Fiserv Inc.
- HCL Technologies Ltd.
- IBM Corporation
- Infosys Ltd.
- Intellect Design Arena Ltd.
- Mambu BV
- Microsoft Corporation
- Nucleus Software Exports Ltd.
- Oracle Corporation
- Q2 Holdings Inc.
- SAP SE
- Sopra Steria Group SA
- Tata Consultancy Services Ltd.
- Temenos AG
- Wipro Ltd.
- ZKAPITOL Technologies Ltd.
Qualitative and quantitative analysis of companies has been conducted to help clients understand the wider business environment as well as the strengths and weaknesses of key industry players. Data is qualitatively analyzed to categorize companies as pure play, category-focused, industry-focused, and diversified; it is quantitatively analyzed to categorize companies as dominant, leading, strong, tentative, and weak.
Recent Development and News in Third-Party Banking Software Market
- In February 2024, Finastra, a leading provider of financial software, announced the launch of its new open platform, Fusion Essence, designed specifically for small and mid-sized banks. This innovative solution offers a range of third-party banking applications, enabling institutions to easily integrate best-of-breed solutions to meet their unique needs (Finastra Press Release).
- In October 2024, Mastercard and Marqeta, a modern card issuing and processing platform, announced a strategic partnership to accelerate the growth of open banking and embedded finance. This collaboration aims to provide financial institutions with faster access to innovative solutions and services, enhancing their digital offerings (Mastercard Newsroom).
- In January 2025, Temenos, a leading banking software company, announced a significant investment of USD250 million in its Temenos Infinity platform. This investment will support the continued development of the platform, enabling banks to deliver superior digital experiences to their customers (Temenos Press Release).
- In March 2025, Nucleus Commercial Bank, based in the UAE, became the first bank in the region to implement the cloud-native, third-party banking software from Mambu. This implementation will enable Nucleus to offer advanced digital banking services to its customers, positioning the bank as a technology leader in the market (Mambu Press Release).
Research Analyst Overview
The market is witnessing significant innovation, with marketing automation and digital marketing playing crucial roles in customer engagement. Payment Gateways and digital wallets facilitate seamless transactions, while fintech startups leverage open APIs for embedded finance and service-oriented architecture. Blockchain technology ensures data encryption and API security, enhancing data-driven decision making and regulatory compliance. Risk management and customer support are essential components, with microservices architecture enabling scalability and continuous delivery. Merchant services and e-commerce integration cater to businesses, while customer onboarding and biometric authentication streamline the customer journey.
Agile methodology and continuous integration ensure timely product development, and cloud security safeguards sensitive data. Challenger banks and financial services innovation continue to disrupt the industry, with multi-factor authentication and regulatory compliance maintaining trust and security. The market's future lies in harnessing the power of customer segmentation, data security, and continuous improvement.
Dive into Technavio's robust research methodology, blending expert interviews, extensive data synthesis, and validated models for unparalleled Third-Party Banking Software Market insights. See full methodology.
|
Market Scope |
|
|
Report Coverage |
Details |
|
Page number |
214 |
|
Base year |
2024 |
|
Historic period |
2019-2023 |
|
Forecast period |
2025-2029 |
|
Growth momentum & CAGR |
Accelerate at a CAGR of 6.6% |
|
Market growth 2025-2029 |
USD 10.56 billion |
|
Market structure |
Fragmented |
|
YoY growth 2024-2025(%) |
6.2 |
|
Key countries |
US, China, UK, Germany, Canada, India, South Korea, Japan, France, and Italy |
|
Competitive landscape |
Leading Companies, Market Positioning of Companies, Competitive Strategies, and Industry Risks |
What are the Key Data Covered in this Third-Party Banking Software Market Research and Growth Report?
- CAGR of the Third-Party Banking Software industry during the forecast period
- Detailed information on factors that will drive the growth and forecasting between 2025 and 2029
- Precise estimation of the size of the market and its contribution of the industry in focus to the parent market
- Accurate predictions about upcoming growth and trends and changes in consumer behaviour
- Growth of the market across North America, Europe, APAC, South America, and Middle East and Africa
- Thorough analysis of the market's competitive landscape and detailed information about companies
- Comprehensive analysis of factors that will challenge the third-party banking software market growth of industry companies
We can help! Our analysts can customize this third-party banking software market research report to meet your requirements.
 RIA -
RIA - 
