Third-Party Chemical Distribution Market Analysis APAC, Europe, North America, South America, Middle East and Africa - US, China, Germany, Canada, UK, India, France, Japan, Italy, South Korea - Size and Forecast 2025-2029

Third-Party Chemical Distribution Market Analysis APAC, Europe, North America, South America, Middle East and Africa - US, China, Germany, Canada, UK, India, France, Japan, Italy, South Korea - Size and Forecast 2025-2029

Published: Jan 2025 203 Pages SKU: IRTNTR41550

Market Overview at a Glance

$156.7 Mn
Market Opportunity
8.4%
CAGR
7.6
YoY growth 2024-2025(%)

Third-Party Chemical Distribution Market Size 2025-2029

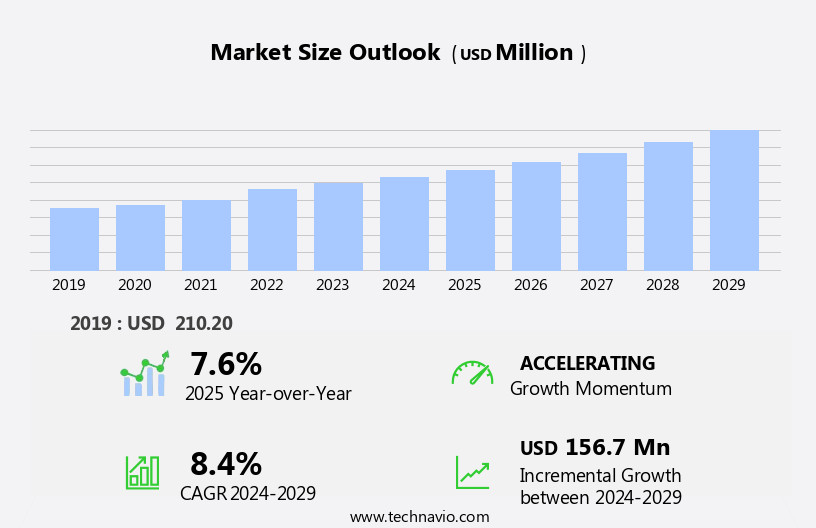
The third-party chemical distribution market size is forecast to increase by USD 156.7 million at a CAGR of 8.4% between 2024 and 2029.

  • The market is experiencing significant growth, driven by the increasing demand for efficient and cost-effective chemical supply solutions. The market is witnessing an uptick in mergers and acquisitions as major players seek to expand their reach and enhance their offerings. Additionally, the advent of innovative distribution channels, such as e-commerce platforms and digital marketplaces, is revolutionizing the way chemicals are bought and sold. However, regulatory hurdles impact adoption, with stringent regulations governing the transportation, storage, and handling of chemicals posing challenges for market participants.
  • Furthermore, supply chain inconsistencies, including logistical challenges and price volatility, temper growth potential. Companies seeking to capitalize on market opportunities must navigate these challenges effectively by investing in robust regulatory compliance frameworks and implementing agile supply chain strategies. By staying abreast of industry trends and regulatory developments, third-party chemical distributors can position themselves for long-term success in this dynamic market.

What will be the Size of the Third-Party Chemical Distribution Market during the forecast period?

Third-Party Chemical Distribution Market Size

 Request Free Sample

  • In the dynamic chemical distribution market, businesses seek enhanced traceability and technical expertise to ensure supply chain visibility. The pharmaceutical segment and specialty chemicals continue to dominate, with electronics and automotive and transportation sectors also driving growth. Logistics plays a crucial role, particularly for synthetic rubbers and sealants, as digital technologies streamline operations and e-commerce platforms expand. Agrochemicals and bulk chemicals are likewise impacted by regulations, pushing industry verticals to prioritize environmental responsibility.
  • Artificial intelligence and automation optimize laboratory processes, while SMEs leverage digital solutions to compete. Regulations and safety training remain essential, as businesses navigate the complexities of chemical transportation.

How is this Third-Party Chemical Distribution Industry segmented?

The third-party chemical distribution industry research report provides comprehensive data (region-wise segment analysis), with forecasts and estimates in "USD million" for the period 2025-2029, as well as historical data from 2019-2023 for the following segments.

  • Type
    • Commodity chemicals
    • Specialty chemicals
  • Application
    • Textiles
    • Automotive and transportation
    • Agriculture
    • Pharmaceuticals
    • Industrial
  • Geography
    • North America
      • US
      • Canada
    • Europe
      • France
      • Germany
      • Italy
      • UK
    • APAC
      • China
      • India
      • Japan
      • South Korea
    • Rest of World (ROW)

    By Type Insights

    The commodity chemicals segment is estimated to witness significant growth during the forecast period.

    The market encompasses various industry verticals, including automotive and transportation, agriculture, textiles, electronics, pharmaceuticals, and more. Commodity chemicals, a significant segment, are bulk chemicals used to produce a broad spectrum of end-products, such as construction materials, adhesives, plastics, and synthetic rubbers. These chemicals, which include polymers, petrochemicals, and basic inorganic chemicals and fertilizers, are manufactured at lower prices than specialty chemicals. Commodity chemicals are integral to numerous applications, including personal care products, aerospace industries, and industrial manufacturing processes for plastics, synthetic fibers, synthetic rubbers, fertilizers, pesticides, and more. The automotive and transportation sector relies on commodity chemicals for fuel, lubricants, and tire production.

    In agriculture, they are used for fertilizers and pesticides. Technological advancements, such as digital technologies, artificial intelligence, and automation, are transforming the chemical distribution landscape. These innovations improve efficiency, supply chain visibility, and safety training, ensuring environmental responsibility and waste reduction. E-commerce platforms facilitate seamless transactions between chemical manufacturers and businesses, enabling real-time tracking and traceability. Regulations play a crucial role in the market, ensuring safety and environmental impact. Logistics and storage solutions optimize the transportation of chemicals, minimizing risks and maximizing efficiency. SMEs and laboratories benefit from technical expertise and specialized services offered by third-party chemical distributors. The pharmaceutical segment, a growing sector, requires stringent quality control and regulatory compliance.

    Specialty chemicals cater to niche markets, offering unique properties and applications. Construction chemicals ensure the durability and sustainability of infrastructure projects. Adhesives and sealants provide essential bonding solutions across industries. In conclusion, the market is a dynamic and diverse landscape, driven by technological advancements, regulatory requirements, and the evolving needs of various industry verticals. Commodity chemicals, a dominant segment, continue to play a crucial role in manufacturing and production processes, while technological innovations and regulatory compliance shape the future of the market.

    Third-Party Chemical Distribution Market Size

     Download Free Sample Report

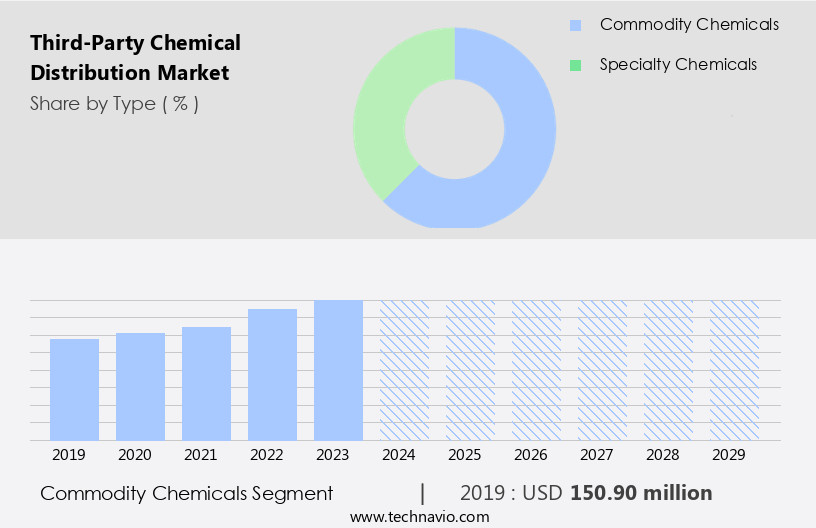
    The Commodity chemicals segment was valued at USD 150.90 million in 2019 and showed a gradual increase during the forecast period.

    Regional Analysis

    APAC is estimated to contribute 50% to the growth of the global market during the forecast period.Technavio’s analysts have elaborately explained the regional trends and drivers that shape the market during the forecast period.

    Third-Party Chemical Distribution Market Share by Geography

    View Free PDF Sample

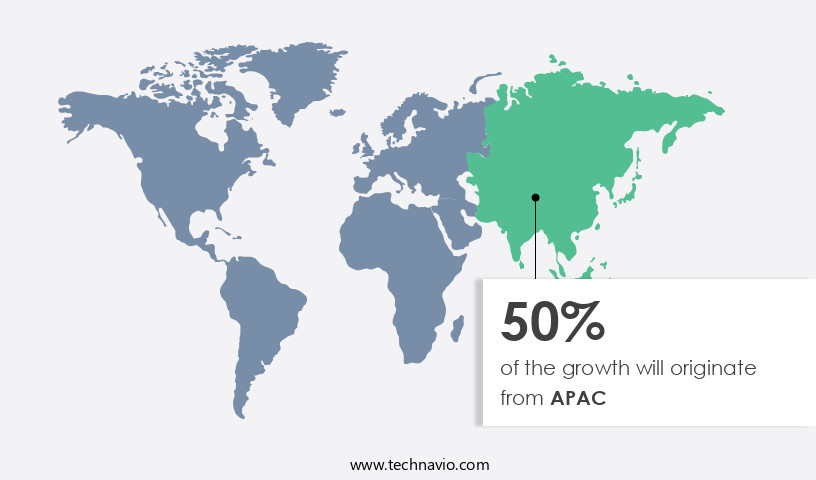
    The market in Asia Pacific is experiencing notable growth due to the rising demand for specialty and commodity chemicals from various emerging economies in the region. China, Japan, South Korea, India, and Australia are major contributors to this expansion. Increased spending power among the rising middle class has attracted significant investments from distributors seeking to capitalize on the market potential. Digital technologies are transforming the industry, with automation and supply chain visibility improving efficiency and reducing waste. Synthetic rubbers and plastics are in high demand for automotive and transportation applications, while safety training is essential for handling chemicals safely.

    Agrochemicals and bulk chemicals are vital for agriculture, and e-commerce platforms facilitate convenient sales and distribution. Environmental responsibility is a priority, with manufacturers focusing on reducing their environmental impact. Artificial intelligence and technical expertise are essential for optimizing operations and meeting regulatory requirements. Logistics and storage solutions are crucial for ensuring timely and safe delivery of chemicals. Specialty chemicals, including sealants, coatings, adhesives, and elastomers, are gaining popularity due to their unique properties. Construction chemicals and polymers are essential for the construction industry. The pharmaceutical segment relies on chemical transportation and traceability for the delivery of essential medicines. Regulations governing the transportation and handling of chemicals are stringent, and compliance is essential.

    Textiles and explosives are other industry verticals that rely on third-party chemical distribution. Overall, the market is dynamic, with various entities collaborating to meet the evolving needs of businesses and consumers.

    Market Dynamics

    Our researchers analyzed the data with 2024 as the base year, along with the key drivers, trends, and challenges. A holistic analysis of drivers will help companies refine their marketing strategies to gain a competitive advantage.

    What are the Third-Party Chemical Distribution market drivers leading to the rise in the adoption of Industry?

    • The increasing importance of chemical distribution serves as the primary market driver. 

    • The chemical industry is experiencing a digital transformation, with manufacturers and distributors increasingly adopting technology to meet changing business needs and customer expectations. IoT and analytics enable the analysis of large data volumes, automation of processes, and empowerment of the workforce, leading to increased agility, operational optimization, regulatory compliance, and innovation. The rise of e-commerce also provides third-party chemical distributors with opportunities to partner with digital retailers, expanding their reach and increasing the demand for their services. Polymers, elastomers, construction chemicals, adhesives, and other chemical product categories are benefiting from these trends, with businesses in various industry verticals seeking technical expertise and reliable supply chains.
    • The digitalization of the chemical distribution market is a significant development, enhancing efficiency, flexibility, and competitiveness in the industry.

    What are the Third-Party Chemical Distribution market trends shaping the Industry?

    • The trend in the market is characterized by an escalating number of mergers and acquisitions. This phenomenon is a common occurrence in business, particularly during periods of economic growth.

    • The market is experiencing significant consolidation as large and international companies acquire smaller companies to expand their market reach and fill portfolio gaps. In June 2023, SABO S.P.A. Announced its agreement with Elastribution for the distribution of polymer additives in the UK and Ireland markets. Similarly, in October 2022, Barentz International acquired Maroon Group, a North American specialty chemical distributor, to strengthen its presence in the US and Canada. Digital technologies are revolutionizing the industry, enabling efficient logistics and supply chain management. This is particularly important for bulk chemicals, sealants, synthetic rubbers, agrochemicals, and automotive and transportation applications.
    • Safety training and environmental responsibility are also crucial considerations for companies and SMEs alike. Artificial intelligence and other advanced technologies are being adopted to optimize operations and improve customer service. For instance, predictive analytics can help identify potential supply chain disruptions and enable proactive responses. The market for third-party chemical distribution is expected to grow significantly in the coming years, driven by these trends and the increasing demand for specialized chemicals across various industries.

    How does Third-Party Chemical Distribution market faces challenges face during its growth?

    • The emergence of innovative distribution channels poses a significant challenge to the industry's growth trajectory. This trend necessitates continuous adaptation and strategic planning for businesses to remain competitive in the market. 

    • The market faces challenges from the increasing trend of direct sales by chemical manufacturers and the adoption of advanced technologies. Traditionally, chemical producers have controlled the distribution of their products, with direct supply accounting for approximately 90% of global distribution. Technologies like Blockchain facilitate smart contracts between manufacturers and end-users, enabling automatic contract execution and validation, thereby eliminating the need for third-party intermediaries. This trend is particularly significant in industries such as laboratories, specialty chemicals, agriculture, plastics, coatings, electronics, and waste reduction, where efficiency and storage are crucial.
    • Automation in these sectors further reduces the need for intermediaries, contributing to the market's challenges. Despite these obstacles, the market continues to play a vital role in the chemicals industry by offering value-added services, including logistics, marketing, and technical expertise.

    Exclusive Customer Landscape

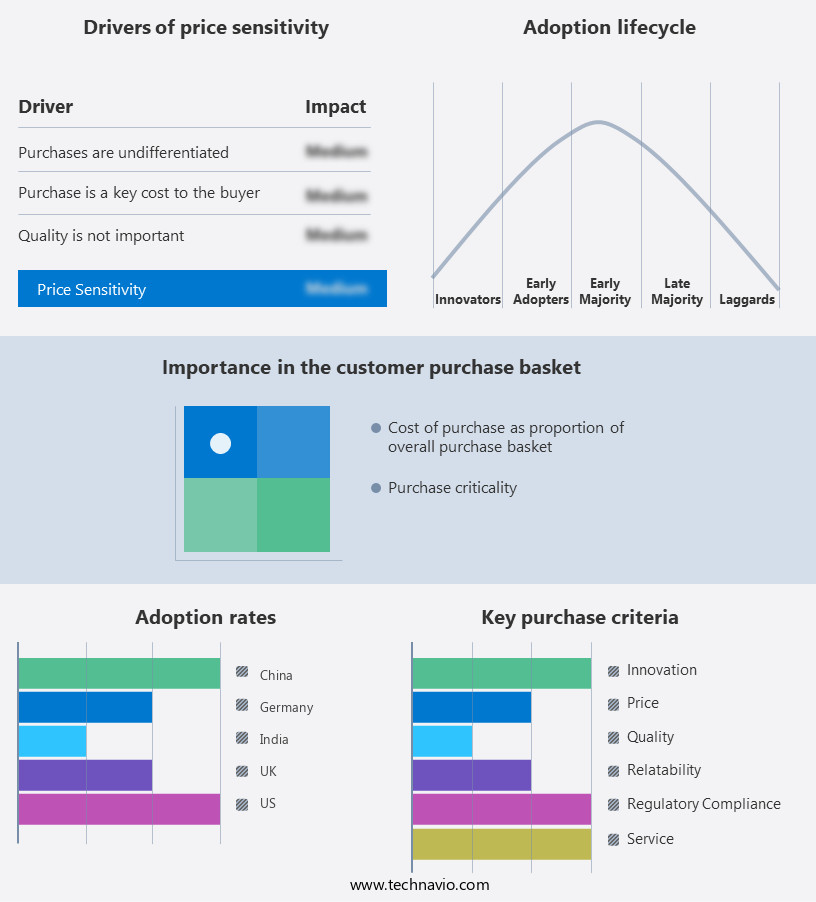
    The third-party chemical distribution market forecasting report includes the adoption lifecycle of the market, covering from the innovator’s stage to the laggard’s stage. It focuses on adoption rates in different regions based on penetration. Furthermore, the third-party chemical distribution market report also includes key purchase criteria and drivers of price sensitivity to help companies evaluate and develop their market growth analysis strategies.

    Third-Party Chemical Distribution Market Share by Geography

     Customer Landscape

    Key Companies & Market Insights

    Companies are implementing various strategies, such as strategic alliances, third-party chemical distribution market forecast, partnerships, mergers and acquisitions, geographical expansion, and product/service launches, to enhance their presence in the industry.

    Barentz International BV - This company specializes in providing third-party chemical distribution services and advanced IT solutions to enterprises worldwide. By leveraging a vast network of suppliers and innovative technology, we facilitate seamless chemical procurement and distribution processes for businesses. Our IT offerings include customized software solutions designed to streamline operations, enhance efficiency, and improve data management for our clients. With a commitment to excellence and a customer-centric approach, we help enterprises optimize their chemical supply chains and gain a competitive edge in their industries.

    The industry research and growth report includes detailed analyses of the competitive landscape of the market and information about key companies, including:

    • Barentz International BV
    • Biesterfeld AG
    • BRENNTAG SE
    • HELM AG
    • ICC Chemical Corp.
    • IMCD NV
    • Jebsen and Jessen Pte Ltd.
    • Manuchar NV
    • Obegi Group
    • Omya International AG
    • Petrochem
    • Protea Chemicals
    • REDA Chemicals
    • Redox Ltd.
    • Sea Land Chemical Co.
    • Snetor SA
    • Stockmeier Holding GmbH
    • Tricon Energy Inc.
    • Univar Solutions Inc.
    • Wilbur Ellis Holdings Inc.

    Qualitative and quantitative analysis of companies has been conducted to help clients understand the wider business environment as well as the strengths and weaknesses of key industry players. Data is qualitatively analyzed to categorize companies as pure play, category-focused, industry-focused, and diversified; it is quantitatively analyzed to categorize companies as dominant, leading, strong, tentative, and weak.

    Recent Development and News in Third-Party Chemical Distribution Market

    • In February 2024, INEOS Styrolution, the world's leading styrenics supplier, announced the launch of its new service, 'Styrolution Circular Solutions'. This initiative aims to provide a closed-loop solution for polystyrene and styrene monomer, enabling customers to recycle their post-consumer waste and sell it back to INEOS Styrolution for reuse (INEOS Styrolution press release, 2024).
    • In June 2025, BASF and SABIC, two major chemical companies, signed a memorandum of understanding (MoU) to collaborate on the development of a new integrated Verbund site in Europe. This strategic partnership is expected to strengthen their positions in the European chemical market and create a more sustainable and integrated production network (BASF press release, 2025).
    • In September 2024, Dow Inc. Completed the acquisition of DuPont's specialty products division for approximately USD6.2 billion. This deal expanded Dow Inc.'s portfolio in the specialty chemicals sector and increased its market share in various industries, including electronics, transportation, and building and construction (Dow Inc. Press release, 2024).
    • In March 2025, the European Union (EU) approved the Chemicals Strategy for Sustainability, which includes the European Green Deal's ambition to transform the EU into a circular economy. This regulatory initiative will significantly impact the market, as it sets new targets for the reduction of hazardous chemicals, the promotion of sustainable alternatives, and the enhancement of recycling and reuse systems (European Commission press release, 2025).

    Research Analyst Overview

    The market is characterized by its ongoing dynamics and evolving patterns, shaped by various factors. Digital technologies play a pivotal role in this sector, revolutionizing the way businesses operate. Synthetic rubbers, for instance, are now produced using advanced manufacturing techniques, enabling greater efficiency and consistency. In the automotive and transportation sector, safety training is a critical aspect of chemical distribution. Companies are investing in digital solutions to enhance training programs, ensuring their workforce is well-equipped to handle the complexities of the industry. The integration of artificial intelligence (AI) in safety training programs is a notable trend, providing real-time feedback and analysis to improve performance and reduce risks.

    The agrochemicals and bulk chemicals segments are also undergoing significant changes. Environmental responsibility is a top priority for chemical manufacturers, leading to the development of eco-friendly alternatives and more sustainable production methods. E-commerce platforms are increasingly being used to streamline the distribution process, providing greater convenience and accessibility to businesses in various industry verticals. Logistics and supply chain visibility are essential components of the chemical distribution market. Automation and waste reduction are key areas of focus, with companies leveraging AI and advanced analytics to optimize their operations and reduce costs. Specialty chemicals, including sealants, coatings, adhesives, and construction chemicals, are also experiencing growth, driven by their unique properties and applications.

    The pharmaceutical segment is another significant market for chemical distribution. Regulations and traceability are critical factors, with stringent quality control measures in place to ensure the safety and efficacy of pharmaceutical products. The use of AI and automation in the production and distribution of pharmaceuticals is increasing, enabling greater efficiency and accuracy. The textiles industry is another vertical that relies heavily on chemical distribution. Polymers and plastics are essential raw materials, and the ongoing research and development in this area is driving innovation and growth. The use of e-commerce platforms and technical expertise is also increasing, enabling businesses to access a wider range of products and services.

    The transportation of chemicals is a complex and critical aspect of the distribution process. Chemical manufacturers and distributors must adhere to strict regulations to ensure the safe and efficient transportation of chemicals. The use of AI and real-time monitoring systems is becoming more prevalent, providing greater visibility and control over the transportation process. The SMEs in the chemical distribution market are also embracing digital technologies, with e-commerce platforms and automation solutions becoming increasingly popular. This trend is expected to continue, with SMEs leveraging these technologies to improve their operations and compete with larger players in the market.

    In the electronics industry, the demand for chemicals is growing, driven by the increasing production of electronic devices. The use of AI and advanced analytics is also increasing, enabling greater efficiency and accuracy in the production and distribution of chemicals for the electronics industry. The environmental impact of chemical production and distribution is a significant concern, with businesses focusing on reducing their carbon footprint and minimizing waste. Waste reduction and recycling initiatives are becoming more common, with companies investing in new technologies and processes to minimize their environmental impact. In conclusion, the market is a dynamic and evolving sector, shaped by various factors including digital technologies, regulations, sustainability, and industry trends.

    The integration of AI and automation is a notable trend, enabling greater efficiency, accuracy, and safety in the production and distribution of chemicals across various industry verticals.

    Dive into Technavio’s robust research methodology, blending expert interviews, extensive data synthesis, and validated models for unparalleled Third-Party Chemical Distribution Market insights. See full methodology.

    Market Scope

    Report Coverage

    Details

    Page number

    203

    Base year

    2024

    Historic period

    2019-2023

    Forecast period

    2025-2029

    Growth momentum & CAGR

    Accelerate at a CAGR of 8.4%

    Market growth 2025-2029

    USD 156.7 million

    Market structure

    Fragmented

    YoY growth 2024-2025(%)

    7.6

    Key countries

    US, China, Germany, Canada, UK, India, France, Japan, Italy, and South Korea

    Competitive landscape

    Leading Companies, Market Positioning of Companies, Competitive Strategies, and Industry Risks

    Request Free Sample

    What are the Key Data Covered in this Third-Party Chemical Distribution Market Research and Growth Report?

    • CAGR of the Third-Party Chemical Distribution industry during the forecast period
    • Detailed information on factors that will drive the growth and forecasting between 2025 and 2029
    • Precise estimation of the size of the market and its contribution of the industry in focus to the parent market
    • Accurate predictions about upcoming growth and trends and changes in consumer behaviour
    • Growth of the market across APAC, Europe, North America, South America, and Middle East and Africa
    • Thorough analysis of the market’s competitive landscape and detailed information about companies
    • Comprehensive analysis of factors that will challenge the third-party chemical distribution market growth of industry companies

    We can help! Our analysts can customize this third-party chemical distribution market research report to meet your requirements.

    Get in touch


    1 Executive Summary

    • 1.1 Market overview
      • Executive Summary - Chart on Market Overview
      • Executive Summary - Data Table on Market Overview
      • Executive Summary - Chart on Global Market Characteristics
      • Executive Summary - Chart on Market by Geography
      • Executive Summary - Chart on Market Segmentation by Type
      • Executive Summary - Chart on Market Segmentation by Application
      • Executive Summary - Chart on Incremental Growth
      • Executive Summary - Data Table on Incremental Growth
      • Executive Summary - Chart on Company Market Positioning

    2 Technavio Analysis

    • 2.1 Analysis of price sensitivity, lifecycle, customer purchase basket, adoption rates, and purchase criteria
      • Analysis of price sensitivity, lifecycle, customer purchase basket, adoption rates, and purchase criteria
    • 2.2 Criticality of inputs and Factors of differentiation
      • Overview on criticality of inputs and factors of differentiation
    • 2.3 Factors of disruption
      • Overview on factors of disruption
    • 2.4 Impact of drivers and challenges
      • Impact of drivers and challenges in 2024 and 2029

    3 Market Landscape

    • 3.1 Market ecosystem
      • Parent Market
      • Data Table on - Parent Market
    • 3.2 Market characteristics
      • Market characteristics analysis
    • 3.3 Value chain analysis
      • Value chain analysis

    4 Market Sizing

    • 4.1 Market definition
      • Offerings of companies included in the market definition
    • 4.2 Market segment analysis
      • Market segments
    • 4.3 Market size 2024
      • 4.4 Market outlook: Forecast for 2024-2029
        • Chart on Global - Market size and forecast 2024-2029 ($ million)
        • Data Table on Global - Market size and forecast 2024-2029 ($ million)
        • Chart on Global Market: Year-over-year growth 2024-2029 (%)
        • Data Table on Global Market: Year-over-year growth 2024-2029 (%)

      5 Historic Market Size

      • 5.1 Global Third-Party Chemical Distribution 2019 - 2023
        • Historic Market Size - Data Table on Global Third-Party Chemical Distribution 2019 - 2023 ($ million)
      • 5.2 Type segment analysis 2019 - 2023
        • Historic Market Size - Type Segment 2019 - 2023 ($ million)
      • 5.3 Application segment analysis 2019 - 2023
        • Historic Market Size - Application Segment 2019 - 2023 ($ million)
      • 5.4 Geography segment analysis 2019 - 2023
        • Historic Market Size - Geography Segment 2019 - 2023 ($ million)
      • 5.5 Country segment analysis 2019 - 2023
        • Historic Market Size - Country Segment 2019 - 2023 ($ million)

      6 Qualitative Analysis

      • 6.1 Impact of AI on third-party chemical distribution market

        7 Five Forces Analysis

        • 7.1 Five forces summary
          • Five forces analysis - Comparison between 2024 and 2029
        • 7.2 Bargaining power of buyers
          • Bargaining power of buyers - Impact of key factors 2024 and 2029
        • 7.3 Bargaining power of suppliers
          • Bargaining power of suppliers - Impact of key factors in 2024 and 2029
        • 7.4 Threat of new entrants
          • Threat of new entrants - Impact of key factors in 2024 and 2029
        • 7.5 Threat of substitutes
          • Threat of substitutes - Impact of key factors in 2024 and 2029
        • 7.6 Threat of rivalry
          • Threat of rivalry - Impact of key factors in 2024 and 2029
        • 7.7 Market condition
          • Chart on Market condition - Five forces 2024 and 2029

        8 Market Segmentation by Type

        • 8.1 Market segments
          • Chart on Type - Market share 2024-2029 (%)
          • Data Table on Type - Market share 2024-2029 (%)
        • 8.2 Comparison by Type
          • Chart on Comparison by Type
          • Data Table on Comparison by Type
        • 8.3 Commodity chemicals - Market size and forecast 2024-2029
          • Chart on Commodity chemicals - Market size and forecast 2024-2029 ($ million)
          • Data Table on Commodity chemicals - Market size and forecast 2024-2029 ($ million)
          • Chart on Commodity chemicals - Year-over-year growth 2024-2029 (%)
          • Data Table on Commodity chemicals - Year-over-year growth 2024-2029 (%)
        • 8.4 Specialty chemicals - Market size and forecast 2024-2029
          • Chart on Specialty chemicals - Market size and forecast 2024-2029 ($ million)
          • Data Table on Specialty chemicals - Market size and forecast 2024-2029 ($ million)
          • Chart on Specialty chemicals - Year-over-year growth 2024-2029 (%)
          • Data Table on Specialty chemicals - Year-over-year growth 2024-2029 (%)
        • 8.5 Market opportunity by Type
          • Market opportunity by Type ($ million)
          • Data Table on Market opportunity by Type ($ million)

        9 Market Segmentation by Application

        • 9.1 Market segments
          • Chart on Application - Market share 2024-2029 (%)
          • Data Table on Application - Market share 2024-2029 (%)
        • 9.2 Comparison by Application
          • Chart on Comparison by Application
          • Data Table on Comparison by Application
        • 9.3 Textiles - Market size and forecast 2024-2029
          • Chart on Textiles - Market size and forecast 2024-2029 ($ million)
          • Data Table on Textiles - Market size and forecast 2024-2029 ($ million)
          • Chart on Textiles - Year-over-year growth 2024-2029 (%)
          • Data Table on Textiles - Year-over-year growth 2024-2029 (%)
        • 9.4 Automotive and transportation - Market size and forecast 2024-2029
          • Chart on Automotive and transportation - Market size and forecast 2024-2029 ($ million)
          • Data Table on Automotive and transportation - Market size and forecast 2024-2029 ($ million)
          • Chart on Automotive and transportation - Year-over-year growth 2024-2029 (%)
          • Data Table on Automotive and transportation - Year-over-year growth 2024-2029 (%)
        • 9.5 Agriculture - Market size and forecast 2024-2029
          • Chart on Agriculture - Market size and forecast 2024-2029 ($ million)
          • Data Table on Agriculture - Market size and forecast 2024-2029 ($ million)
          • Chart on Agriculture - Year-over-year growth 2024-2029 (%)
          • Data Table on Agriculture - Year-over-year growth 2024-2029 (%)
        • 9.6 Pharmaceuticals - Market size and forecast 2024-2029
          • Chart on Pharmaceuticals - Market size and forecast 2024-2029 ($ million)
          • Data Table on Pharmaceuticals - Market size and forecast 2024-2029 ($ million)
          • Chart on Pharmaceuticals - Year-over-year growth 2024-2029 (%)
          • Data Table on Pharmaceuticals - Year-over-year growth 2024-2029 (%)
        • 9.7 Industrial - Market size and forecast 2024-2029
          • Chart on Industrial - Market size and forecast 2024-2029 ($ million)
          • Data Table on Industrial - Market size and forecast 2024-2029 ($ million)
          • Chart on Industrial - Year-over-year growth 2024-2029 (%)
          • Data Table on Industrial - Year-over-year growth 2024-2029 (%)
        • 9.8 Market opportunity by Application
          • Market opportunity by Application ($ million)
          • Data Table on Market opportunity by Application ($ million)

        10 Customer Landscape

        • 10.1 Customer landscape overview
          • Analysis of price sensitivity, lifecycle, customer purchase basket, adoption rates, and purchase criteria

        11 Geographic Landscape

        • 11.1 Geographic segmentation
          • Chart on Market share by geography 2024-2029 (%)
          • Data Table on Market share by geography 2024-2029 (%)
        • 11.2 Geographic comparison
          • Chart on Geographic comparison
          • Data Table on Geographic comparison
        • 11.3 APAC - Market size and forecast 2024-2029
          • Chart on APAC - Market size and forecast 2024-2029 ($ million)
          • Data Table on APAC - Market size and forecast 2024-2029 ($ million)
          • Chart on APAC - Year-over-year growth 2024-2029 (%)
          • Data Table on APAC - Year-over-year growth 2024-2029 (%)
        • 11.4 Europe - Market size and forecast 2024-2029
          • Chart on Europe - Market size and forecast 2024-2029 ($ million)
          • Data Table on Europe - Market size and forecast 2024-2029 ($ million)
          • Chart on Europe - Year-over-year growth 2024-2029 (%)
          • Data Table on Europe - Year-over-year growth 2024-2029 (%)
        • 11.5 North America - Market size and forecast 2024-2029
          • Chart on North America - Market size and forecast 2024-2029 ($ million)
          • Data Table on North America - Market size and forecast 2024-2029 ($ million)
          • Chart on North America - Year-over-year growth 2024-2029 (%)
          • Data Table on North America - Year-over-year growth 2024-2029 (%)
        • 11.6 South America - Market size and forecast 2024-2029
          • Chart on South America - Market size and forecast 2024-2029 ($ million)
          • Data Table on South America - Market size and forecast 2024-2029 ($ million)
          • Chart on South America - Year-over-year growth 2024-2029 (%)
          • Data Table on South America - Year-over-year growth 2024-2029 (%)
        • 11.7 Middle East and Africa - Market size and forecast 2024-2029
          • Chart on Middle East and Africa - Market size and forecast 2024-2029 ($ million)
          • Data Table on Middle East and Africa - Market size and forecast 2024-2029 ($ million)
          • Chart on Middle East and Africa - Year-over-year growth 2024-2029 (%)
          • Data Table on Middle East and Africa - Year-over-year growth 2024-2029 (%)
        • 11.8 US - Market size and forecast 2024-2029
          • Chart on US - Market size and forecast 2024-2029 ($ million)
          • Data Table on US - Market size and forecast 2024-2029 ($ million)
          • Chart on US - Year-over-year growth 2024-2029 (%)
          • Data Table on US - Year-over-year growth 2024-2029 (%)
        • 11.9 China - Market size and forecast 2024-2029
          • Chart on China - Market size and forecast 2024-2029 ($ million)
          • Data Table on China - Market size and forecast 2024-2029 ($ million)
          • Chart on China - Year-over-year growth 2024-2029 (%)
          • Data Table on China - Year-over-year growth 2024-2029 (%)
        • 11.10 Germany - Market size and forecast 2024-2029
          • Chart on Germany - Market size and forecast 2024-2029 ($ million)
          • Data Table on Germany - Market size and forecast 2024-2029 ($ million)
          • Chart on Germany - Year-over-year growth 2024-2029 (%)
          • Data Table on Germany - Year-over-year growth 2024-2029 (%)
        • 11.11 Canada - Market size and forecast 2024-2029
          • Chart on Canada - Market size and forecast 2024-2029 ($ million)
          • Data Table on Canada - Market size and forecast 2024-2029 ($ million)
          • Chart on Canada - Year-over-year growth 2024-2029 (%)
          • Data Table on Canada - Year-over-year growth 2024-2029 (%)
        • 11.12 India - Market size and forecast 2024-2029
          • Chart on India - Market size and forecast 2024-2029 ($ million)
          • Data Table on India - Market size and forecast 2024-2029 ($ million)
          • Chart on India - Year-over-year growth 2024-2029 (%)
          • Data Table on India - Year-over-year growth 2024-2029 (%)
        • 11.13 UK - Market size and forecast 2024-2029
          • Chart on UK - Market size and forecast 2024-2029 ($ million)
          • Data Table on UK - Market size and forecast 2024-2029 ($ million)
          • Chart on UK - Year-over-year growth 2024-2029 (%)
          • Data Table on UK - Year-over-year growth 2024-2029 (%)
        • 11.14 France - Market size and forecast 2024-2029
          • Chart on France - Market size and forecast 2024-2029 ($ million)
          • Data Table on France - Market size and forecast 2024-2029 ($ million)
          • Chart on France - Year-over-year growth 2024-2029 (%)
          • Data Table on France - Year-over-year growth 2024-2029 (%)
        • 11.15 Japan - Market size and forecast 2024-2029
          • Chart on Japan - Market size and forecast 2024-2029 ($ million)
          • Data Table on Japan - Market size and forecast 2024-2029 ($ million)
          • Chart on Japan - Year-over-year growth 2024-2029 (%)
          • Data Table on Japan - Year-over-year growth 2024-2029 (%)
        • 11.16 Italy - Market size and forecast 2024-2029
          • Chart on Italy - Market size and forecast 2024-2029 ($ million)
          • Data Table on Italy - Market size and forecast 2024-2029 ($ million)
          • Chart on Italy - Year-over-year growth 2024-2029 (%)
          • Data Table on Italy - Year-over-year growth 2024-2029 (%)
        • 11.17 South Korea - Market size and forecast 2024-2029
          • Chart on South Korea - Market size and forecast 2024-2029 ($ million)
          • Data Table on South Korea - Market size and forecast 2024-2029 ($ million)
          • Chart on South Korea - Year-over-year growth 2024-2029 (%)
          • Data Table on South Korea - Year-over-year growth 2024-2029 (%)
        • 11.18 Market opportunity by geography
          • Market opportunity by geography ($ million)
          • Data Tables on Market opportunity by geography ($ million)

        12 Drivers, Challenges, and Opportunity/Restraints

        • 12.1 Market drivers
          • 12.2 Market challenges
            • 12.3 Impact of drivers and challenges
              • Impact of drivers and challenges in 2024 and 2029
            • 12.4 Market opportunities/restraints

              13 Competitive Landscape

              • 13.1 Overview
                • 13.2 Competitive Landscape
                  • Overview on criticality of inputs and factors of differentiation
                • 13.3 Landscape disruption
                  • Overview on factors of disruption
                • 13.4 Industry risks
                  • Impact of key risks on business

                14 Competitive Analysis

                • 14.1 Companies profiled
                  • Companies covered
                • 14.2 Company ranking index
                  • Company ranking index
                • 14.3 Market positioning of companies
                  • Matrix on companies position and classification
                • 14.4 Barentz International BV
                  • Barentz International BV - Overview
                  • Barentz International BV - Product / Service
                  • Barentz International BV - Key offerings
                  • SWOT
                • 14.5 Biesterfeld AG
                  • Biesterfeld AG - Overview
                  • Biesterfeld AG - Product / Service
                  • Biesterfeld AG - Key offerings
                  • SWOT
                • 14.6 BRENNTAG SE
                  • BRENNTAG SE - Overview
                  • BRENNTAG SE - Business segments
                  • BRENNTAG SE - Key news
                  • BRENNTAG SE - Key offerings
                  • BRENNTAG SE - Segment focus
                  • SWOT
                • 14.7 HELM AG
                  • HELM AG - Overview
                  • HELM AG - Product / Service
                  • HELM AG - Key news
                  • HELM AG - Key offerings
                  • SWOT
                • 14.8 ICC Chemical Corp.
                  • ICC Chemical Corp. - Overview
                  • ICC Chemical Corp. - Product / Service
                  • ICC Chemical Corp. - Key offerings
                  • SWOT
                • 14.9 IMCD NV
                  • IMCD NV - Overview
                  • IMCD NV - Business segments
                  • IMCD NV - Key offerings
                  • IMCD NV - Segment focus
                  • SWOT
                • 14.10 Jebsen and Jessen Pte Ltd.
                  • Jebsen and Jessen Pte Ltd. - Overview
                  • Jebsen and Jessen Pte Ltd. - Product / Service
                  • Jebsen and Jessen Pte Ltd. - Key offerings
                  • SWOT
                • 14.11 Omya International AG
                  • Omya International AG - Overview
                  • Omya International AG - Product / Service
                  • Omya International AG - Key offerings
                  • SWOT
                • 14.12 Redox Ltd.
                  • Redox Ltd. - Overview
                  • Redox Ltd. - Product / Service
                  • Redox Ltd. - Key offerings
                  • SWOT
                • 14.13 Sea Land Chemical Co.
                  • Sea Land Chemical Co. - Overview
                  • Sea Land Chemical Co. - Product / Service
                  • Sea Land Chemical Co. - Key offerings
                  • SWOT
                • 14.14 Snetor SA
                  • Snetor SA - Overview
                  • Snetor SA - Product / Service
                  • Snetor SA - Key offerings
                  • SWOT
                • 14.15 Stockmeier Holding GmbH
                  • Stockmeier Holding GmbH - Overview
                  • Stockmeier Holding GmbH - Product / Service
                  • Stockmeier Holding GmbH - Key offerings
                  • SWOT
                • 14.16 Tricon Energy Inc.
                  • Tricon Energy Inc. - Overview
                  • Tricon Energy Inc. - Product / Service
                  • Tricon Energy Inc. - Key offerings
                  • SWOT
                • 14.17 Univar Solutions Inc.
                  • Univar Solutions Inc. - Overview
                  • Univar Solutions Inc. - Business segments
                  • Univar Solutions Inc. - Key news
                  • Univar Solutions Inc. - Key offerings
                  • Univar Solutions Inc. - Segment focus
                  • SWOT
                • 14.18 Wilbur Ellis Holdings Inc.
                  • Wilbur Ellis Holdings Inc. - Overview
                  • Wilbur Ellis Holdings Inc. - Product / Service
                  • Wilbur Ellis Holdings Inc. - Key offerings
                  • SWOT

                15 Appendix

                • 15.1 Scope of the report
                  • 15.2 Inclusions and exclusions checklist
                    • Inclusions checklist
                    • Exclusions checklist
                  • 15.3 Currency conversion rates for US$
                    • Currency conversion rates for US$
                  • 15.4 Research methodology
                    • Research methodology
                  • 15.5 Data procurement
                    • Information sources
                  • 15.6 Data validation
                    • Data validation
                  • 15.7 Validation techniques employed for market sizing
                    • Validation techniques employed for market sizing
                  • 15.8 Data synthesis
                    • Data synthesis
                  • 15.9 360 degree market analysis
                    • 360 degree market analysis
                  • 15.10 List of abbreviations
                    • List of abbreviations

                  Research Methodology

                  Technavio presents a detailed picture of the market by way of study, synthesis, and summation of data from multiple sources. The analysts have presented the various facets of the market with a particular focus on identifying the key industry influencers. The data thus presented is comprehensive, reliable, and the result of extensive research, both primary and secondary.

                  INFORMATION SOURCES

                  Primary sources

                  • Manufacturers and suppliers
                  • Channel partners
                  • Industry experts
                  • Strategic decision makers

                  Secondary sources

                  • Industry journals and periodicals
                  • Government data
                  • Financial reports of key industry players
                  • Historical data
                  • Press releases

                  DATA ANALYSIS

                  Data Synthesis

                  • Collation of data
                  • Estimation of key figures
                  • Analysis of derived insights

                  Data Validation

                  • Triangulation with data models
                  • Reference against proprietary databases
                  • Corroboration with industry experts

                  REPORT WRITING

                  Qualitative

                  • Market drivers
                  • Market challenges
                  • Market trends
                  • Five forces analysis

                  Quantitative

                  • Market size and forecast
                  • Market segmentation
                  • Geographical insights
                  • Competitive landscape

                  Interested in this report?

                  Get your sample now to see our research methodology and insights!

                  Download Now

                  Frequently Asked Questions

                  Third-Party Chemical Distribution market growth will increase by $ 156.7 mn during 2025-2029.

                  The Third-Party Chemical Distribution market is expected to grow at a CAGR of 8.4% during 2025-2029.

                  Third-Party Chemical Distribution market is segmented by Type( Commodity chemicals, Specialty chemicals) Application( Textiles, Automotive and transportation, Agriculture, Pharmaceuticals, Industrial)

                  Barentz International BV, Biesterfeld AG, BRENNTAG SE, HELM AG, ICC Chemical Corp., IMCD NV, Jebsen and Jessen Pte Ltd., Manuchar NV, Obegi Group, Omya International AG, Petrochem, Protea Chemicals, REDA Chemicals, Redox Ltd., Sea Land Chemical Co., Snetor SA, Stockmeier Holding GmbH, Tricon Energy Inc., Univar Solutions Inc., Wilbur Ellis Holdings Inc. are a few of the key vendors in the Third-Party Chemical Distribution market.

                  APAC will register the highest growth rate of 50% among the other regions. Therefore, the Third-Party Chemical Distribution market in APAC is expected to garner significant business opportunities for the vendors during the forecast period.

                  US, China, Germany, Canada, UK, India, France, Japan, Italy, South Korea

                  • Growing focus on chemical distributionOwing to the advent of modern technologies in the global chemical market is the driving factor this market.
                  • there is a considerable demand for digitalization of the overall chemical distribution supply chain. Business requirements have changed with evolving customer expectations is the driving factor this market.
                  • thereby resulting in increased adoption of digital technologies by chemical manufacturers as well as chemical distributors. The advent of digital technologies such as the Internet of Things (IoT) and analytics can enable manufacturers and distributors to analyze large data volumes is the driving factor this market.
                  • automate processes is the driving factor this market.
                  • and empower the workforce. The adoption aids in instilling agility into the system is the driving factor this market.
                  • optimizing operations is the driving factor this market.
                  • adhering to regulations is the driving factor this market.
                  • and developing innovative business models. In addition is the driving factor this market.
                  • the advent of online commerce also enables third-party chemical distributors to enter partnerships with digital retailers is the driving factor this market.
                  • thereby increasing the need for third-party chemical distributors.Companies such as Univar are increasingly opting for increased investment in the digitization of their supply chain and are one of the leading e-commerce platforms for chemical distribution. Various initiatives in the direction of digitizing the supply chain are another major factor that is expected to drive the digitization process in the market. Chemical distributors today are embracing digitization as it offers an effective business model to achieve operational excellence by creating bigger efficiencies in the supply chain along with an opportunity to rethink relationships with customers. Consequently is the driving factor this market.
                  • third-party chemical distributors are increasingly opting for digital enterprise business management solutions such as Sage Enterprise Management solutions offered by SWYPE Technologies to achieve goals is the driving factor this market.
                  • optimize inventory is the driving factor this market.
                  • and control cash flow. These various digitization solutions is the driving factor this market.
                  • as well as digitization initiatives is the driving factor this market.
                  • are expected to drive the adoption of digital solutions in the third-party chemical distribution market is the driving factor this market.
                  • which will drive the growth of the global third-party chemical distribution market during the forecast period. is the driving factor this market.

                  The Third-Party Chemical Distribution market vendors should focus on grabbing business opportunities from the Commodity chemicals segment as it accounted for the largest market share in the base year.