Tidal Energy Generation Systems Market Analysis, Size, and Forecast 2026-2030: Europe (UK, France, and Spain), APAC (China, South Korea, and Japan), North America (US, Canada, and Mexico), Middle East and Africa (South Africa), South America (Brazil and Argentina), and Rest of World (ROW)

Tidal Energy Generation Systems Market Analysis, Size, and Forecast 2026-2030:
Europe (UK, France, and Spain), APAC (China, South Korea, and Japan), North America (US, Canada, and Mexico), Middle East and Africa (South Africa), South America (Brazil and Argentina), and Rest of World (ROW)

Published: Dec 2025 288 Pages SKU: IRTNTR80160

Market Overview at a Glance

$1.13 B
Market Opportunity
24.7%
CAGR 2025 - 2030
56.7%
Europe Growth
$344.10 Mn
Tidal stream systems segment 2024

Tidal Energy Generation Systems Market Size 2026-2030

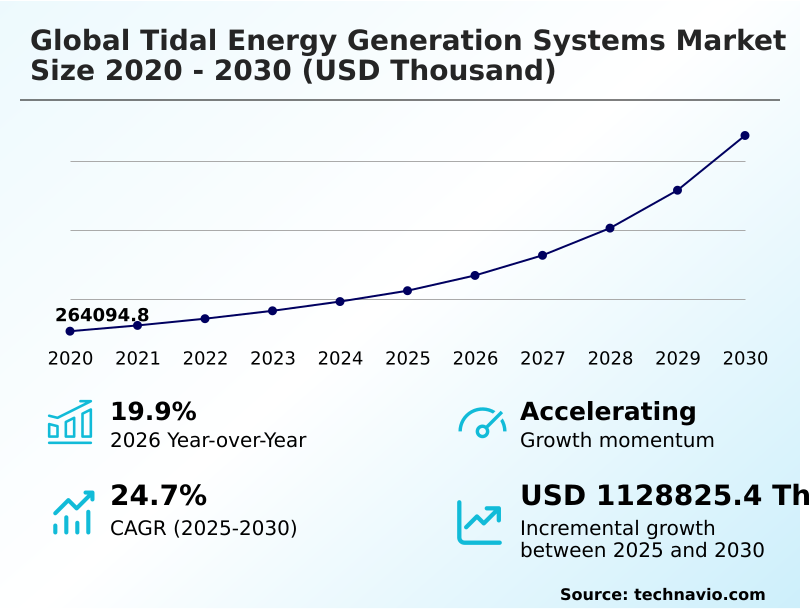
The tidal energy generation systems market size is valued to increase by USD 1.13 billion, at a CAGR of 24.7% from 2025 to 2030. Growing demand for electricity from renewable energy sources will drive the tidal energy generation systems market.

Major Market Trends & Insights

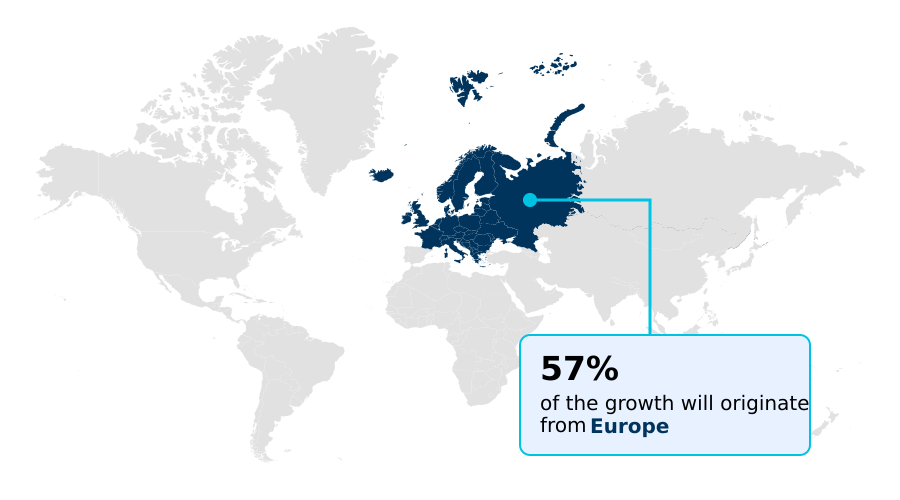
  • Europe dominated the market and accounted for a 56.7% growth during the forecast period.
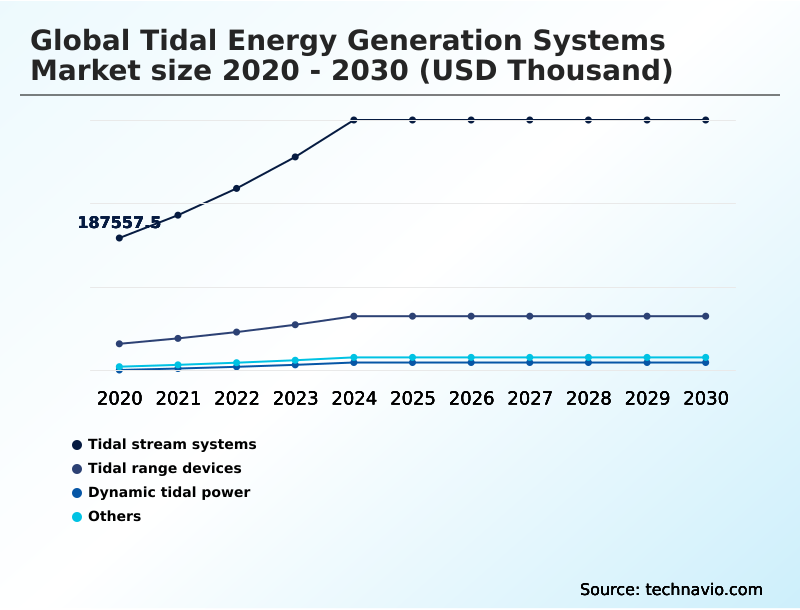
  • By Type - Tidal stream systems segment was valued at USD 344.10 million in 2024
  • By Application - Utility-scale projects segment accounted for the largest market revenue share in 2024

Market Size & Forecast

  • Market Opportunities:
  • Market Future Opportunities: USD 1.13 billion
  • CAGR from 2025 to 2030 : 24.7%

Market Summary

  • The tidal energy generation systems market is defined by a persistent drive toward innovation to harness a predictable and sustainable power source. Key market drivers include increasing government support for renewable projects and the global mandate for decarbonization, which positions tidal power as a critical component in a diversified energy portfolio.
  • A pivotal trend is the integration of AI and machine learning in predictive maintenance models, optimizing operational uptime and enhancing energy capture efficiency. For instance, a utility-scale project can leverage these technologies to analyze real-time operational data, identifying potential equipment failures and reducing downtime, thereby improving the economic viability of offshore installations.
  • However, the industry grapples with significant challenges, including the high upfront manufacturing and installation costs of underwater turbines and the intense competition from more established renewables like solar and wind.
  • Overcoming these financial and competitive pressures through technological advancements, such as the development of cost-effective floating tidal power plants and improved grid connection solutions, is crucial for achieving large-scale commercial deployment.

What will be the Size of the Tidal Energy Generation Systems Market during the forecast period?

Get Key Insights on Market Forecast (PDF) Request Free Sample

How is the Tidal Energy Generation Systems Market Segmented?

The tidal energy generation systems industry research report provides comprehensive data (region-wise segment analysis), with forecasts and estimates in "USD thousand" for the period 2026-2030, as well as historical data from 2020-2024 for the following segments.

  • Type
    • Tidal stream systems
    • Tidal range devices
    • Dynamic tidal power
    • Others
  • Application
    • Utility-scale projects
    • Microgrid systems
    • Off-grid systems
  • Installation sites
    • Offshore installation
    • Onshore installation
  • Geography
    • Europe
      • UK
      • France
      • Spain
    • APAC
      • China
      • South Korea
      • Japan
    • North America
      • US
      • Canada
      • Mexico
    • Middle East and Africa
      • South Africa
    • South America
      • Brazil
      • Argentina
    • Rest of World (ROW)

By Type Insights

The tidal stream systems segment is estimated to witness significant growth during the forecast period.

The tidal energy generation systems market is advancing, with tidal stream systems at the forefront of this evolution. These systems, which function like underwater wind turbines, are becoming crucial for providing baseload power.

Their adoption is driven by the need for predictable renewable energy to enhance grid stability and support decarbonization efforts. Innovations in mooring systems and AI-driven control systems are improving energy capture efficiency, making these solutions more viable for utility-scale projects.

As part of a broader shift towards sustainable energy practices, the development of tidal stream technology contributes to achieving energy transition goals, with some projects demonstrating a 50% increase in renewable capacity contribution to local grids, showcasing their potential in a diversified energy portfolio.

Request Free Sample

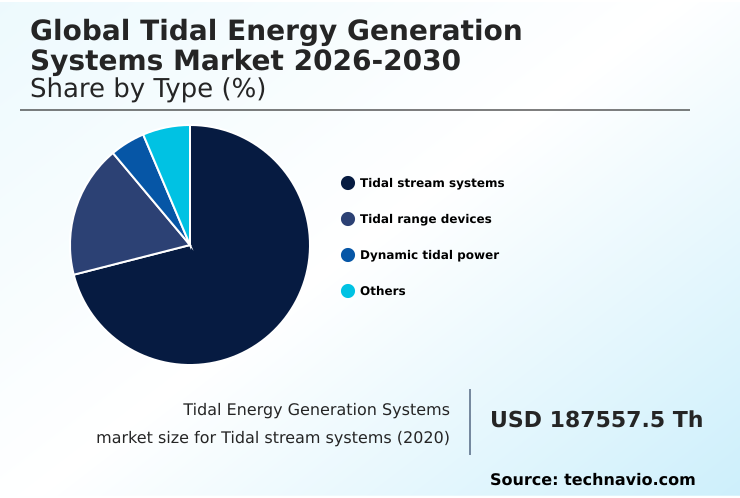
The Tidal stream systems segment was valued at USD 344.10 million in 2024 and showed a gradual increase during the forecast period.

Request Free Sample

Regional Analysis

Europe is estimated to contribute 56.7% to the growth of the global market during the forecast period.Technavio’s analysts have elaborately explained the regional trends and drivers that shape the market during the forecast period.

See How Tidal Energy Generation Systems Market Demand is Rising in Europe Request Free Sample

The geographic landscape of the tidal energy generation systems market is led by Europe, which is projected to have the highest growth, driven by strong government support and ambitious decarbonization targets.

Countries like the UK and France are pioneering large-scale projects. The UK market is particularly advanced, leveraging its significant tidal resources with support from initiatives like the Contracts for Difference scheme.

This region's focus on marine renewable energy is accelerating the development of advanced power conversion systems and subsea electrical infrastructure.

Following Europe, APAC is emerging as a significant market, with countries like China and South Korea investing in both tidal barrage and tidal stream technologies to meet rising energy demands and enhance energy security.

North America, especially Canada, is also a key player due to its substantial tidal resources in areas like the Bay of Fundy, which are ideal for commercial-scale deployment.

Market Dynamics

Our researchers analyzed the data with 2025 as the base year, along with the key drivers, trends, and challenges. A holistic analysis of drivers will help companies refine their marketing strategies to gain a competitive advantage.

  • The global tidal energy generation systems market is navigating a complex path toward commercial maturity, with progress hinging on a delicate balance between technological innovation and economic feasibility. The debate over floating vs fixed tidal systems continues, as developers weigh the higher energy capture efficiency of fixed structures against the deployment flexibility of floating platforms.
  • A key focus is on advancements in turbine blade design and the use of smart materials in turbine construction to improve durability and reduce maintenance challenges in subsea turbines.
  • AI optimization in tidal power is proving essential for enhancing predictive maintenance for tidal turbines and implementing wake steering for tidal farms, which can improve the output of a turbine array by up to 10% compared to unmanaged configurations.
  • The core challenge remains the cost reduction in tidal energy, particularly addressing the environmental impact of tidal barrages and improving the economic viability of tidal lagoons. As regulatory hurdles for marine energy are gradually streamlined, the industry is better positioned to prove tidal turbine operational viability.
  • Integrating tidal power with grids remains a critical step, requiring sophisticated tidal energy resource assessment models. Ultimately, achieving widespread adoption depends on demonstrating how tidal energy for grid stability can be a reliable power source, especially for remote communities.

What are the key market drivers leading to the rise in the adoption of Tidal Energy Generation Systems Industry?

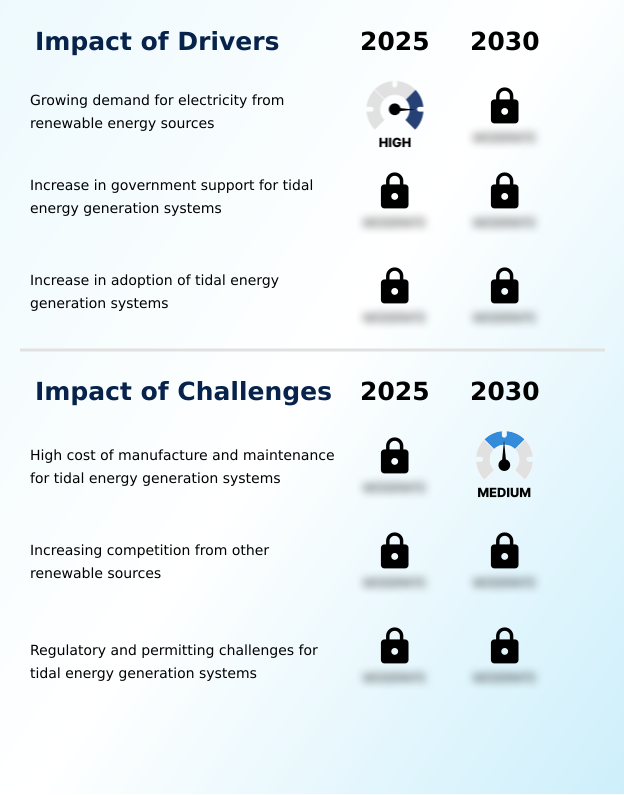
  • The market is primarily driven by the escalating global demand for electricity from renewable sources as part of the broader energy transition.

  • The primary driver for the tidal energy generation systems market is the urgent global push for decarbonization and energy security. Governments worldwide are intensifying support for low-carbon-emitting energy sources to meet stringent energy transition goals.
  • This has led to a significant increase in investments in marine renewable energy, with renewable capacity additions growing by 50% in the last year alone.
  • The demand for clean energy production is particularly high in coastal regions seeking to achieve energy autonomy and reduce reliance on fossil fuels.
  • This momentum is accelerating the development of utility-scale projects and innovative technologies like dynamic tidal power, underpinning the market’s expansion as part of a broader commitment to sustainable energy practices and achieving carbon neutrality.

What are the market trends shaping the Tidal Energy Generation Systems Industry?

  • A transformative trend shaping the market is the integration of artificial intelligence and machine learning to optimize the performance and reliability of tidal energy generation systems.

  • Key trends are transforming the tidal energy generation systems market, notably the integration of AI and the emergence of innovative hardware. The adoption of AI-driven control systems is enabling dynamic adjustments to turbine operations, which has improved energy capture efficiency by up to 12% in certain test deployments.
  • This trend is crucial for optimizing baseload power delivery and ensuring grid stability. Concurrently, the development of floating tidal power plants and tidal energy kites is expanding deployment possibilities into deeper waters, unlocking previously inaccessible energy resources.
  • These advancements in energy storage solutions, coupled with predictive maintenance models, are significantly enhancing the reliability of both offshore and onshore installations, making tidal energy an increasingly attractive option for achieving carbon neutrality.

What challenges does the Tidal Energy Generation Systems Industry face during its growth?

  • A key challenge restraining market growth is the high capital and maintenance costs associated with manufacturing and operating tidal energy generation systems.

  • Despite its potential, the tidal energy generation systems market faces significant challenges, primarily the high levelized cost of energy (LCOE) compared to other renewables. The substantial upfront investment required for hydrokinetic power generation technologies, including robust underwater turbines and tidal barrages, presents a major hurdle.
  • Operational and maintenance costs are also considerable, with some offshore installations reporting maintenance expenses that are 25% higher than initial projections due to the harsh marine environment. Furthermore, the industry contends with complex environmental impact assessments and regulatory processes that can delay projects by an average of 18-24 months.
  • These economic and regulatory obstacles temper the pace of commercial-scale deployment, even as the demand for predictable renewable energy grows.

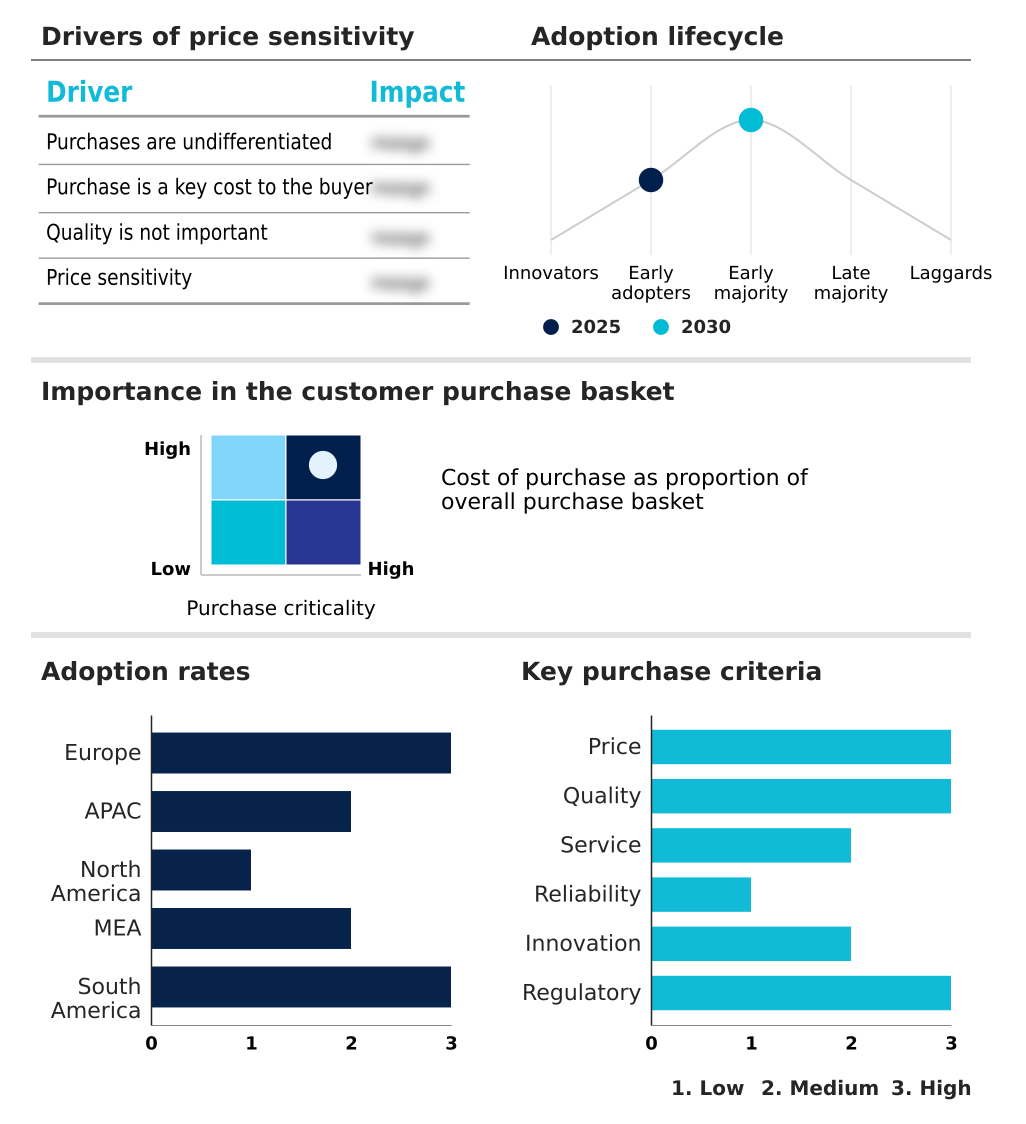
Exclusive Technavio Analysis on Customer Landscape

The tidal energy generation systems market forecasting report includes the adoption lifecycle of the market, covering from the innovator’s stage to the laggard’s stage. It focuses on adoption rates in different regions based on penetration. Furthermore, the tidal energy generation systems market report also includes key purchase criteria and drivers of price sensitivity to help companies evaluate and develop their market growth analysis strategies.

Customer Landscape of Tidal Energy Generation Systems Industry

Competitive Landscape

Companies are implementing various strategies, such as strategic alliances, tidal energy generation systems market forecast, partnerships, mergers and acquisitions, geographical expansion, and product/service launches, to enhance their presence in the industry.

ABB Ltd. - Analysis indicates a focus on floating tidal systems designed to convert mechanical rotation from sea currents into electrical power, addressing needs for modular and scalable energy solutions.

The industry research and growth report includes detailed analyses of the competitive landscape of the market and information about key companies, including:

  • ABB Ltd.
  • Andritz AG
  • BioPower Systems Pty Ltd.
  • Blue Energy Canada Inc.
  • Bluewater Energy Services BV
  • DP Energy
  • HydroWing
  • Instream Energy Systems Corp.
  • Inyanga Maritime Ltd
  • Minesto AB
  • Nova Innovation Ltd.
  • Ocean Renewable Power Co. Inc
  • Orbital Marine Power Ltd
  • Proteus Marine Renewables
  • QED Naval Ltd
  • SeaQurrent
  • Simec Atlantis Energy Ltd.
  • Verdant Power Inc.

Qualitative and quantitative analysis of companies has been conducted to help clients understand the wider business environment as well as the strengths and weaknesses of key industry players. Data is qualitatively analyzed to categorize companies as pure play, category-focused, industry-focused, and diversified; it is quantitatively analyzed to categorize companies as dominant, leading, strong, tentative, and weak.

Recent Development and News in Tidal energy generation systems market

  • In September 2024, the UK Department for Energy Security and Net Zero is anticipated to announce specific capacity allocations for tidal stream projects in its upcoming Contracts for Difference (CfD) auction, a move expected to provide revenue certainty and de-risk private investment.
  • In November 2024, Fisheries and Oceans Canada granted an authorization to Eauclaire Tidal Ltd. for deploying up to three Orbital O2-X tidal turbines at the Fundy Ocean Research Centre for Energy (FORCE) site, advancing renewable energy development in the Bay of Fundy.
  • In August 2024, Proteus Marine Renewables secured a contract to upgrade the AR500 tidal energy generation system to the more powerful AR1100 model, enhancing its capacity and operational efficiency.
  • In January 2025, San Bernardino Ocean Power Corp, a subsidiary of Energies PH Inc., announced a strategic partnership with Inyanga Marine Energy Group to develop a one-megawatt tidal power generation plant in the Philippines, marking a significant step for tidal energy in Southeast Asia.

Dive into Technavio’s robust research methodology, blending expert interviews, extensive data synthesis, and validated models for unparalleled Tidal Energy Generation Systems Market insights. See full methodology.

Market Scope
Page number 288
Base year 2025
Historic period 2020-2024
Forecast period 2026-2030
Growth momentum & CAGR Accelerate at a CAGR of 24.7%
Market growth 2026-2030 USD 1128825.4 thousand
Market structure Fragmented
YoY growth 2025-2026(%) 19.9%
Key countries UK, France, Norway, Portugal, Spain, The Netherlands, China, South Korea, Japan, India, Australia, Indonesia, US, Canada, Mexico, Morocco, South Africa, Egypt, Kenya, Oman, Chile, Brazil and Argentina
Competitive landscape Leading Companies, Market Positioning of Companies, Competitive Strategies, and Industry Risks

Request Free Sample

Research Analyst Overview

  • The tidal energy generation systems market is advancing through critical technological maturation, focused on enhancing reliability and economic viability. Core technologies like tidal stream systems and tidal range devices are being refined with innovations such as vertical axis hydrokinetic turbines and sophisticated power conversion systems.
  • The development of robust grid connection and subsea electrical infrastructure is essential for the success of utility-scale projects. A significant trend is the application of AI-driven control systems and predictive maintenance models to optimize performance and reduce operational costs, with some pilot projects demonstrating a potential 20% reduction in unscheduled maintenance.
  • This shift toward smarter energy systems directly influences boardroom decisions regarding capital expenditure on R&D for next-generation solutions like dynamic tidal power and tidal energy kites. The integration of smart materials and advanced mooring systems is further improving the durability and energy capture efficiency of underwater turbines, making them a more competitive option in the renewable energy landscape.

What are the Key Data Covered in this Tidal Energy Generation Systems Market Research and Growth Report?

  • What is the expected growth of the Tidal Energy Generation Systems Market between 2026 and 2030?

    • USD 1.13 billion, at a CAGR of 24.7%

  • What segmentation does the market report cover?

    • The report is segmented by Type (Tidal stream systems, Tidal range devices, Dynamic tidal power, and Others), Application (Utility-scale projects, Microgrid systems, and Off-grid systems), Installation Sites (Offshore installation, and Onshore installation) and Geography (Europe, APAC, North America, Middle East and Africa, South America)

  • Which regions are analyzed in the report?

    • Europe, APAC, North America, Middle East and Africa and South America

  • What are the key growth drivers and market challenges?

    • Growing demand for electricity from renewable energy sources, High cost of manufacture and maintenance for tidal energy generation systems

  • Who are the major players in the Tidal Energy Generation Systems Market?

    • ABB Ltd., Andritz AG, BioPower Systems Pty Ltd., Blue Energy Canada Inc., Bluewater Energy Services BV, DP Energy, HydroWing, Instream Energy Systems Corp., Inyanga Maritime Ltd, Minesto AB, Nova Innovation Ltd., Ocean Renewable Power Co. Inc, Orbital Marine Power Ltd, Proteus Marine Renewables, QED Naval Ltd, SeaQurrent, Simec Atlantis Energy Ltd. and Verdant Power Inc.

Market Research Insights

  • The tidal energy generation systems market is influenced by a dynamic interplay of technological progress and economic imperatives. The push for energy autonomy and carbon neutrality is accelerating the adoption of predictable renewable energy sources. This has led to a notable increase in commercial-scale deployment, where advancements have improved energy capture efficiency by over 15% in newer installations.
  • Furthermore, microgrid systems in remote coastal communities are benefiting from these technologies, with some achieving a 20% reduction in reliance on fossil fuels. The focus on lowering the levelized cost of energy (LCOE) through innovations in offshore installation techniques continues to shape investment decisions, ensuring tidal power contributes effectively to global energy security and grid stability.

We can help! Our analysts can customize this tidal energy generation systems market research report to meet your requirements.

Get in touch

1. Executive Summary

1.1 Market overview

Executive Summary - Chart on Market Overview
Executive Summary - Data Table on Market Overview
Executive Summary - Chart on Global Market Characteristics
Executive Summary - Chart on Market by Geography
Executive Summary - Chart on Market Segmentation by Type
Executive Summary - Chart on Market Segmentation by Application
Executive Summary - Chart on Market Segmentation by Installation Sites
Executive Summary - Chart on Incremental Growth
Executive Summary - Data Table on Incremental Growth
Executive Summary - Chart on Company Market Positioning

2. Technavio Analysis

2.1 Analysis of price sensitivity, lifecycle, customer purchase basket, adoption rates, and purchase criteria

2.2 Criticality of inputs and Factors of differentiation

Chart on Overview on criticality of inputs and factors of differentiation

2.3 Factors of disruption

Chart on Overview on factors of disruption

2.4 Impact of drivers and challenges

Chart on Impact of drivers and challenges in 2025 and 2030

3. Market Landscape

3.1 Market ecosystem

Chart on Parent Market
Data Table on - Parent Market

3.2 Market characteristics

Chart on Market characteristics analysis

3.3 Value chain analysis

Chart on Value chain analysis

4. Market Sizing

4.1 Market definition

Data Table on Offerings of companies included in the market definition

4.2 Market segment analysis

Market segments

4.3 Market size 2025

4.4 Market outlook: Forecast for 2025-2030

Chart on Global - Market size and forecast 2025-2030 ($ thousand)
Data Table on Global - Market size and forecast 2025-2030 ($ thousand)
Chart on Global Market: Year-over-year growth 2025-2030 (%)
Data Table on Global Market: Year-over-year growth 2025-2030 (%)

5. Historic Market Size

5.1 Global Tidal Energy Generation Systems Market 2020 - 2024

Historic Market Size - Data Table on Global Tidal Energy Generation Systems Market 2020 - 2024 ($ thousand)

5.2 Type segment analysis 2020 - 2024

Historic Market Size - Type Segment 2020 - 2024 ($ thousand)

5.3 Application segment analysis 2020 - 2024

Historic Market Size - Application Segment 2020 - 2024 ($ thousand)

5.4 Installation Sites segment analysis 2020 - 2024

Historic Market Size - Installation Sites Segment 2020 - 2024 ($ thousand)

5.5 Geography segment analysis 2020 - 2024

Historic Market Size - Geography Segment 2020 - 2024 ($ thousand)

5.6 Country segment analysis 2020 - 2024

Historic Market Size - Country Segment 2020 - 2024 ($ thousand)

6. Qualitative Analysis

6.1 Impact of AI on the Global Tidal Energy Generation Systems Market

7. Five Forces Analysis

7.1 Five forces summary

Five forces analysis - Comparison between 2025 and 2030

7.2 Bargaining power of buyers

Bargaining power of buyers - Impact of key factors 2025 and 2030

7.3 Bargaining power of suppliers

Bargaining power of suppliers - Impact of key factors in 2025 and 2030

7.4 Threat of new entrants

Threat of new entrants - Impact of key factors in 2025 and 2030

7.5 Threat of substitutes

Threat of substitutes - Impact of key factors in 2025 and 2030

7.6 Threat of rivalry

Threat of rivalry - Impact of key factors in 2025 and 2030

7.7 Market condition

Chart on Market condition - Five forces 2025 and 2030

8. Market Segmentation by Type

8.1 Market segments

Chart on Type - Market share 2025-2030 (%)
Data Table on Type - Market share 2025-2030 (%)

8.2 Comparison by Type

Chart on Comparison by Type
Data Table on Comparison by Type

8.3 Tidal stream systems - Market size and forecast 2025-2030

Chart on Tidal stream systems - Market size and forecast 2025-2030 ($ thousand)
Data Table on Tidal stream systems - Market size and forecast 2025-2030 ($ thousand)
Chart on Tidal stream systems - Year-over-year growth 2025-2030 (%)
Data Table on Tidal stream systems - Year-over-year growth 2025-2030 (%)

8.4 Tidal range devices - Market size and forecast 2025-2030

Chart on Tidal range devices - Market size and forecast 2025-2030 ($ thousand)
Data Table on Tidal range devices - Market size and forecast 2025-2030 ($ thousand)
Chart on Tidal range devices - Year-over-year growth 2025-2030 (%)
Data Table on Tidal range devices - Year-over-year growth 2025-2030 (%)

8.5 Dynamic tidal power - Market size and forecast 2025-2030

Chart on Dynamic tidal power - Market size and forecast 2025-2030 ($ thousand)
Data Table on Dynamic tidal power - Market size and forecast 2025-2030 ($ thousand)
Chart on Dynamic tidal power - Year-over-year growth 2025-2030 (%)
Data Table on Dynamic tidal power - Year-over-year growth 2025-2030 (%)

8.6 Others - Market size and forecast 2025-2030

Chart on Others - Market size and forecast 2025-2030 ($ thousand)
Data Table on Others - Market size and forecast 2025-2030 ($ thousand)
Chart on Others - Year-over-year growth 2025-2030 (%)
Data Table on Others - Year-over-year growth 2025-2030 (%)

8.7 Market opportunity by Type

Market opportunity by Type ($ thousand)
Data Table on Market opportunity by Type ($ thousand)

9. Market Segmentation by Application

9.1 Market segments

Chart on Application - Market share 2025-2030 (%)
Data Table on Application - Market share 2025-2030 (%)

9.2 Comparison by Application

Chart on Comparison by Application
Data Table on Comparison by Application

9.3 Utility-scale projects - Market size and forecast 2025-2030

Chart on Utility-scale projects - Market size and forecast 2025-2030 ($ thousand)
Data Table on Utility-scale projects - Market size and forecast 2025-2030 ($ thousand)
Chart on Utility-scale projects - Year-over-year growth 2025-2030 (%)
Data Table on Utility-scale projects - Year-over-year growth 2025-2030 (%)

9.4 Microgrid systems - Market size and forecast 2025-2030

Chart on Microgrid systems - Market size and forecast 2025-2030 ($ thousand)
Data Table on Microgrid systems - Market size and forecast 2025-2030 ($ thousand)
Chart on Microgrid systems - Year-over-year growth 2025-2030 (%)
Data Table on Microgrid systems - Year-over-year growth 2025-2030 (%)

9.5 Off-grid systems - Market size and forecast 2025-2030

Chart on Off-grid systems - Market size and forecast 2025-2030 ($ thousand)
Data Table on Off-grid systems - Market size and forecast 2025-2030 ($ thousand)
Chart on Off-grid systems - Year-over-year growth 2025-2030 (%)
Data Table on Off-grid systems - Year-over-year growth 2025-2030 (%)

9.6 Market opportunity by Application

Market opportunity by Application ($ thousand)
Data Table on Market opportunity by Application ($ thousand)

10. Market Segmentation by Installation Sites

10.1 Market segments

Chart on Installation Sites - Market share 2025-2030 (%)
Data Table on Installation Sites - Market share 2025-2030 (%)

10.2 Comparison by Installation Sites

Chart on Comparison by Installation Sites
Data Table on Comparison by Installation Sites

10.3 Offshore installation - Market size and forecast 2025-2030

Chart on Offshore installation - Market size and forecast 2025-2030 ($ thousand)
Data Table on Offshore installation - Market size and forecast 2025-2030 ($ thousand)
Chart on Offshore installation - Year-over-year growth 2025-2030 (%)
Data Table on Offshore installation - Year-over-year growth 2025-2030 (%)

10.4 Onshore installation - Market size and forecast 2025-2030

Chart on Onshore installation - Market size and forecast 2025-2030 ($ thousand)
Data Table on Onshore installation - Market size and forecast 2025-2030 ($ thousand)
Chart on Onshore installation - Year-over-year growth 2025-2030 (%)
Data Table on Onshore installation - Year-over-year growth 2025-2030 (%)

10.5 Market opportunity by Installation Sites

Market opportunity by Installation Sites ($ thousand)
Data Table on Market opportunity by Installation Sites ($ thousand)

11. Customer Landscape

11.1 Customer landscape overview

Analysis of price sensitivity, lifecycle, customer purchase basket, adoption rates, and purchase criteria

12. Geographic Landscape

12.1 Geographic segmentation

Chart on Market share by geography 2025-2030 (%)
Data Table on Market share by geography 2025-2030 (%)

12.2 Geographic comparison

Chart on Geographic comparison
Data Table on Geographic comparison

12.3 Europe - Market size and forecast 2025-2030

Chart on Europe - Market size and forecast 2025-2030 ($ thousand)
Data Table on Europe - Market size and forecast 2025-2030 ($ thousand)
Chart on Europe - Year-over-year growth 2025-2030 (%)
Data Table on Europe - Year-over-year growth 2025-2030 (%)
Chart on Regional Comparison - Europe
Data Table on Regional Comparison - Europe

12.3.1 UK - Market size and forecast 2025-2030

Chart on UK - Market size and forecast 2025-2030 ($ thousand)
Data Table on UK - Market size and forecast 2025-2030 ($ thousand)
Chart on UK - Year-over-year growth 2025-2030 (%)
Data Table on UK - Year-over-year growth 2025-2030 (%)

12.3.2 France - Market size and forecast 2025-2030

Chart on France - Market size and forecast 2025-2030 ($ thousand)
Data Table on France - Market size and forecast 2025-2030 ($ thousand)
Chart on France - Year-over-year growth 2025-2030 (%)
Data Table on France - Year-over-year growth 2025-2030 (%)

12.3.3 Norway - Market size and forecast 2025-2030

Chart on Norway - Market size and forecast 2025-2030 ($ thousand)
Data Table on Norway - Market size and forecast 2025-2030 ($ thousand)
Chart on Norway - Year-over-year growth 2025-2030 (%)
Data Table on Norway - Year-over-year growth 2025-2030 (%)

12.3.4 Portugal - Market size and forecast 2025-2030

Chart on Portugal - Market size and forecast 2025-2030 ($ thousand)
Data Table on Portugal - Market size and forecast 2025-2030 ($ thousand)
Chart on Portugal - Year-over-year growth 2025-2030 (%)
Data Table on Portugal - Year-over-year growth 2025-2030 (%)

12.3.5 Spain - Market size and forecast 2025-2030

Chart on Spain - Market size and forecast 2025-2030 ($ thousand)
Data Table on Spain - Market size and forecast 2025-2030 ($ thousand)
Chart on Spain - Year-over-year growth 2025-2030 (%)
Data Table on Spain - Year-over-year growth 2025-2030 (%)

12.3.6 The Netherlands - Market size and forecast 2025-2030

Chart on The Netherlands - Market size and forecast 2025-2030 ($ thousand)
Data Table on The Netherlands - Market size and forecast 2025-2030 ($ thousand)
Chart on The Netherlands - Year-over-year growth 2025-2030 (%)
Data Table on The Netherlands - Year-over-year growth 2025-2030 (%)

12.4 APAC - Market size and forecast 2025-2030

Chart on APAC - Market size and forecast 2025-2030 ($ thousand)
Data Table on APAC - Market size and forecast 2025-2030 ($ thousand)
Chart on APAC - Year-over-year growth 2025-2030 (%)
Data Table on APAC - Year-over-year growth 2025-2030 (%)
Chart on Regional Comparison - APAC
Data Table on Regional Comparison - APAC

12.4.1 China - Market size and forecast 2025-2030

Chart on China - Market size and forecast 2025-2030 ($ thousand)
Data Table on China - Market size and forecast 2025-2030 ($ thousand)
Chart on China - Year-over-year growth 2025-2030 (%)
Data Table on China - Year-over-year growth 2025-2030 (%)

12.4.2 South Korea - Market size and forecast 2025-2030

Chart on South Korea - Market size and forecast 2025-2030 ($ thousand)
Data Table on South Korea - Market size and forecast 2025-2030 ($ thousand)
Chart on South Korea - Year-over-year growth 2025-2030 (%)
Data Table on South Korea - Year-over-year growth 2025-2030 (%)

12.4.3 Japan - Market size and forecast 2025-2030

Chart on Japan - Market size and forecast 2025-2030 ($ thousand)
Data Table on Japan - Market size and forecast 2025-2030 ($ thousand)
Chart on Japan - Year-over-year growth 2025-2030 (%)
Data Table on Japan - Year-over-year growth 2025-2030 (%)

12.4.4 India - Market size and forecast 2025-2030

Chart on India - Market size and forecast 2025-2030 ($ thousand)
Data Table on India - Market size and forecast 2025-2030 ($ thousand)
Chart on India - Year-over-year growth 2025-2030 (%)
Data Table on India - Year-over-year growth 2025-2030 (%)

12.4.5 Australia - Market size and forecast 2025-2030

Chart on Australia - Market size and forecast 2025-2030 ($ thousand)
Data Table on Australia - Market size and forecast 2025-2030 ($ thousand)
Chart on Australia - Year-over-year growth 2025-2030 (%)
Data Table on Australia - Year-over-year growth 2025-2030 (%)

12.4.6 Indonesia - Market size and forecast 2025-2030

Chart on Indonesia - Market size and forecast 2025-2030 ($ thousand)
Data Table on Indonesia - Market size and forecast 2025-2030 ($ thousand)
Chart on Indonesia - Year-over-year growth 2025-2030 (%)
Data Table on Indonesia - Year-over-year growth 2025-2030 (%)

12.5 North America - Market size and forecast 2025-2030

Chart on North America - Market size and forecast 2025-2030 ($ thousand)
Data Table on North America - Market size and forecast 2025-2030 ($ thousand)
Chart on North America - Year-over-year growth 2025-2030 (%)
Data Table on North America - Year-over-year growth 2025-2030 (%)
Chart on Regional Comparison - North America
Data Table on Regional Comparison - North America

12.5.1 US - Market size and forecast 2025-2030

Chart on US - Market size and forecast 2025-2030 ($ thousand)
Data Table on US - Market size and forecast 2025-2030 ($ thousand)
Chart on US - Year-over-year growth 2025-2030 (%)
Data Table on US - Year-over-year growth 2025-2030 (%)

12.5.2 Canada - Market size and forecast 2025-2030

Chart on Canada - Market size and forecast 2025-2030 ($ thousand)
Data Table on Canada - Market size and forecast 2025-2030 ($ thousand)
Chart on Canada - Year-over-year growth 2025-2030 (%)
Data Table on Canada - Year-over-year growth 2025-2030 (%)

12.5.3 Mexico - Market size and forecast 2025-2030

Chart on Mexico - Market size and forecast 2025-2030 ($ thousand)
Data Table on Mexico - Market size and forecast 2025-2030 ($ thousand)
Chart on Mexico - Year-over-year growth 2025-2030 (%)
Data Table on Mexico - Year-over-year growth 2025-2030 (%)

12.6 Middle East and Africa - Market size and forecast 2025-2030

Chart on Middle East and Africa - Market size and forecast 2025-2030 ($ thousand)
Data Table on Middle East and Africa - Market size and forecast 2025-2030 ($ thousand)
Chart on Middle East and Africa - Year-over-year growth 2025-2030 (%)
Data Table on Middle East and Africa - Year-over-year growth 2025-2030 (%)
Chart on Regional Comparison - Middle East and Africa
Data Table on Regional Comparison - Middle East and Africa

12.6.1 Morocco - Market size and forecast 2025-2030

Chart on Morocco - Market size and forecast 2025-2030 ($ thousand)
Data Table on Morocco - Market size and forecast 2025-2030 ($ thousand)
Chart on Morocco - Year-over-year growth 2025-2030 (%)
Data Table on Morocco - Year-over-year growth 2025-2030 (%)

12.6.2 South Africa - Market size and forecast 2025-2030

Chart on South Africa - Market size and forecast 2025-2030 ($ thousand)
Data Table on South Africa - Market size and forecast 2025-2030 ($ thousand)
Chart on South Africa - Year-over-year growth 2025-2030 (%)
Data Table on South Africa - Year-over-year growth 2025-2030 (%)

12.6.3 Egypt - Market size and forecast 2025-2030

Chart on Egypt - Market size and forecast 2025-2030 ($ thousand)
Data Table on Egypt - Market size and forecast 2025-2030 ($ thousand)
Chart on Egypt - Year-over-year growth 2025-2030 (%)
Data Table on Egypt - Year-over-year growth 2025-2030 (%)

12.6.4 Kenya - Market size and forecast 2025-2030

Chart on Kenya - Market size and forecast 2025-2030 ($ thousand)
Data Table on Kenya - Market size and forecast 2025-2030 ($ thousand)
Chart on Kenya - Year-over-year growth 2025-2030 (%)
Data Table on Kenya - Year-over-year growth 2025-2030 (%)

12.6.5 Oman - Market size and forecast 2025-2030

Chart on Oman - Market size and forecast 2025-2030 ($ thousand)
Data Table on Oman - Market size and forecast 2025-2030 ($ thousand)
Chart on Oman - Year-over-year growth 2025-2030 (%)
Data Table on Oman - Year-over-year growth 2025-2030 (%)

12.7 South America - Market size and forecast 2025-2030

Chart on South America - Market size and forecast 2025-2030 ($ thousand)
Data Table on South America - Market size and forecast 2025-2030 ($ thousand)
Chart on South America - Year-over-year growth 2025-2030 (%)
Data Table on South America - Year-over-year growth 2025-2030 (%)
Chart on Regional Comparison - South America
Data Table on Regional Comparison - South America

12.7.1 Chile - Market size and forecast 2025-2030

Chart on Chile - Market size and forecast 2025-2030 ($ thousand)
Data Table on Chile - Market size and forecast 2025-2030 ($ thousand)
Chart on Chile - Year-over-year growth 2025-2030 (%)
Data Table on Chile - Year-over-year growth 2025-2030 (%)

12.7.2 Brazil - Market size and forecast 2025-2030

Chart on Brazil - Market size and forecast 2025-2030 ($ thousand)
Data Table on Brazil - Market size and forecast 2025-2030 ($ thousand)
Chart on Brazil - Year-over-year growth 2025-2030 (%)
Data Table on Brazil - Year-over-year growth 2025-2030 (%)

12.7.3 Argentina - Market size and forecast 2025-2030

Chart on Argentina - Market size and forecast 2025-2030 ($ thousand)
Data Table on Argentina - Market size and forecast 2025-2030 ($ thousand)
Chart on Argentina - Year-over-year growth 2025-2030 (%)
Data Table on Argentina - Year-over-year growth 2025-2030 (%)

12.8 Market opportunity by geography

Market opportunity by geography ($ thousand)
Data Tables on Market opportunity by geography ($ thousand)

13. Drivers, Challenges, and Opportunity

13.1 Market drivers

Growing demand for electricity from renewable energy sources
Increase in government support for tidal energy generation systems
Increase in adoption of tidal energy generation systems

13.2 Market challenges

High cost of manufacture and maintenance for tidal energy generation systems
Increasing competition from other renewable sources
Regulatory and permitting challenges for tidal energy generation systems

13.3 Impact of drivers and challenges

Impact of drivers and challenges in 2025 and 2030

13.4 Market opportunities

Integration of AI and ML into tidal energy generation systems
Emergence of floating tidal power plants
Technological innovations in turbine design

14. Competitive Landscape

14.1 Overview

14.2

Overview on criticality of inputs and factors of differentiation

14.3 Landscape disruption

Overview on factors of disruption

14.4 Industry risks

Impact of key risks on business

15. Competitive Analysis

15.1 Companies profiled

Companies covered

15.2 Company ranking index

15.3 Market positioning of companies

Matrix on companies position and classification

15.4 ABB Ltd.

ABB Ltd. - Overview
ABB Ltd. - Business segments
ABB Ltd. - Key news
ABB Ltd. - Key offerings
ABB Ltd. - Segment focus
SWOT

15.5 Andritz AG

Andritz AG - Overview
Andritz AG - Business segments
Andritz AG - Key news
Andritz AG - Key offerings
Andritz AG - Segment focus
SWOT

15.6 BioPower Systems Pty Ltd.

BioPower Systems Pty Ltd. - Overview
BioPower Systems Pty Ltd. - Product / Service
BioPower Systems Pty Ltd. - Key offerings
SWOT

15.7 Blue Energy Canada Inc.

Blue Energy Canada Inc. - Overview
Blue Energy Canada Inc. - Product / Service
Blue Energy Canada Inc. - Key offerings
SWOT

15.8 Bluewater Energy Services BV

Bluewater Energy Services BV - Overview
Bluewater Energy Services BV - Product / Service
Bluewater Energy Services BV - Key offerings
SWOT

15.9 DP Energy

DP Energy - Overview
DP Energy - Product / Service
DP Energy - Key offerings
SWOT

15.10 Instream Energy Systems Corp.

Instream Energy Systems Corp. - Overview
Instream Energy Systems Corp. - Product / Service
Instream Energy Systems Corp. - Key offerings
SWOT

15.11 Inyanga Maritime Ltd

Inyanga Maritime Ltd - Overview
Inyanga Maritime Ltd - Product / Service
Inyanga Maritime Ltd - Key offerings
SWOT

15.12 Nova Innovation Ltd.

Nova Innovation Ltd. - Overview
Nova Innovation Ltd. - Product / Service
Nova Innovation Ltd. - Key offerings
SWOT

15.13 Ocean Renewable Power Co. Inc

Ocean Renewable Power Co. Inc - Overview
Ocean Renewable Power Co. Inc - Product / Service
Ocean Renewable Power Co. Inc - Key offerings
SWOT

15.14 Orbital Marine Power Ltd

Orbital Marine Power Ltd - Overview
Orbital Marine Power Ltd - Product / Service
Orbital Marine Power Ltd - Key offerings
SWOT

15.15 QED Naval Ltd

QED Naval Ltd - Overview
QED Naval Ltd - Product / Service
QED Naval Ltd - Key offerings
SWOT

15.16 SeaQurrent

SeaQurrent - Overview
SeaQurrent - Product / Service
SeaQurrent - Key offerings
SWOT

15.17 Simec Atlantis Energy Ltd.

Simec Atlantis Energy Ltd. - Overview
Simec Atlantis Energy Ltd. - Product / Service
Simec Atlantis Energy Ltd. - Key offerings
SWOT

15.18 Verdant Power Inc.

Verdant Power Inc. - Overview
Verdant Power Inc. - Product / Service
Verdant Power Inc. - Key offerings
SWOT

16. Appendix

16.1 Scope of the report

Market definition
Objectives
Notes and caveats

16.2 Inclusions and exclusions checklist

Inclusions checklist
Exclusions checklist

16.3 Currency conversion rates for US$

16.4 Research methodology

16.5 Data procurement

Information sources

16.6 Data validation

16.7 Validation techniques employed for market sizing

16.8 Data synthesis

16.9 360 degree market analysis

16.10 List of abbreviations

Research Methodology

Technavio presents a detailed picture of the market by way of study, synthesis, and summation of data from multiple sources. The analysts have presented the various facets of the market with a particular focus on identifying the key industry influencers. The data thus presented is comprehensive, reliable, and the result of extensive research, both primary and secondary.

INFORMATION SOURCES

Primary sources

  • Manufacturers and suppliers
  • Channel partners
  • Industry experts
  • Strategic decision makers

Secondary sources

  • Industry journals and periodicals
  • Government data
  • Financial reports of key industry players
  • Historical data
  • Press releases

DATA ANALYSIS

Data Synthesis

  • Collation of data
  • Estimation of key figures
  • Analysis of derived insights

Data Validation

  • Triangulation with data models
  • Reference against proprietary databases
  • Corroboration with industry experts

REPORT WRITING

Qualitative

  • Market drivers
  • Market challenges
  • Market trends
  • Five forces analysis

Quantitative

  • Market size and forecast
  • Market segmentation
  • Geographical insights
  • Competitive landscape

Interested in this report?

Get your sample now to see our research methodology and insights!

Download Now

Frequently Asked Questions

Tidal Energy Generation Systems market growth will increase by USD 1128825.4 thousand thousand during 2026-2030.

The Tidal Energy Generation Systems market is expected to grow at a CAGR of 24.7% during 2026-2030.

Tidal Energy Generation Systems market is segmented by Type (Tidal stream systems, Tidal range devices, Dynamic tidal power, Others) Application (Utility-scale projects, Microgrid systems, Off-grid systems) Installation sites (Offshore installation, Onshore installation)

ABB Ltd., Andritz AG, BioPower Systems Pty Ltd., Blue Energy Canada Inc., Bluewater Energy Services BV, DP Energy, HydroWing, Instream Energy Systems Corp., Inyanga Maritime Ltd, Minesto AB, Nova Innovation Ltd., Ocean Renewable Power Co. Inc, Orbital Marine Power Ltd, Proteus Marine Renewables, QED Naval Ltd, SeaQurrent, Simec Atlantis Energy Ltd., Verdant Power Inc. are a few of the key vendors in the Tidal Energy Generation Systems market.

Europe will register the highest growth rate of 56.7% among the other regions. Therefore, the Tidal Energy Generation Systems market in Europe is expected to garner significant business opportunities for the vendors during the forecast period.

UK, France, Norway, Portugal, Spain, The Netherlands, China, South Korea, Japan, India, Australia, Indonesia, US, Canada, Mexico, Morocco, South Africa, Egypt, Kenya, Oman, Chile, Brazil, Argentina

  • Growing demand for electricity from renewable energy sources is the driving factor this market.

The Tidal Energy Generation Systems market vendors should focus on grabbing business opportunities from the Type segment as it accounted for the largest market share in the base year.