Tortilla Market Analysis, Size, and Forecast 2024-2028: North America (Canada and Mexico), Europe (France, Germany, and UK), Middle East and Africa (UAE), APAC (Indonesia, Malaysia, South Korea, and Thailand), South America (Argentina and Brazil), and Rest of World (ROW)

Tortilla Market Analysis, Size, and Forecast 2024-2028:
North America (Canada and Mexico), Europe (France, Germany, and UK), Middle East and Africa (UAE), APAC (Indonesia, Malaysia, South Korea, and Thailand), South America (Argentina and Brazil), and Rest of World (ROW)

Published: Nov 2023 165 Pages SKU: IRTNTR40228

Market Overview at a Glance

$10.43 B
Market Opportunity
5.25%
CAGR
4.84
YoY growth 2023-2024(%)

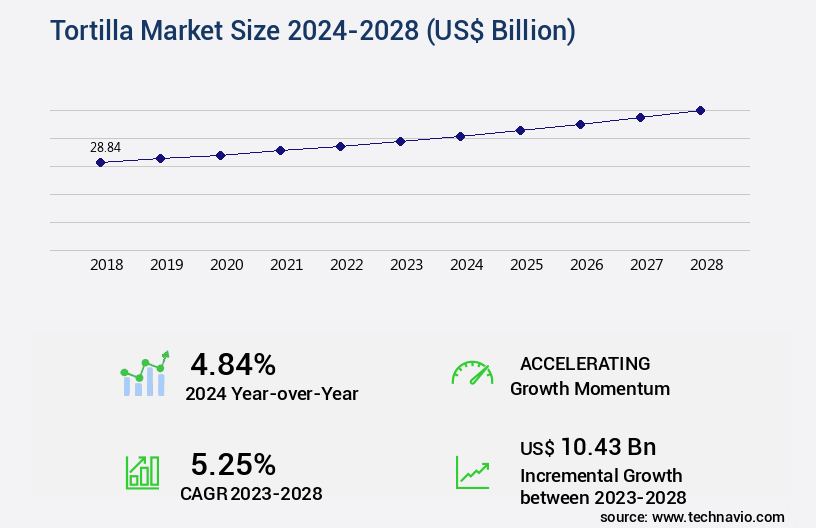
Tortilla Market Size 2024-2028

The tortilla market size is valued to increase by USD 10.43 billion, at a CAGR of 5.25% from 2023 to 2028. Increasing demand for convenience foods will drive the tortilla market.

Major Market Trends & Insights

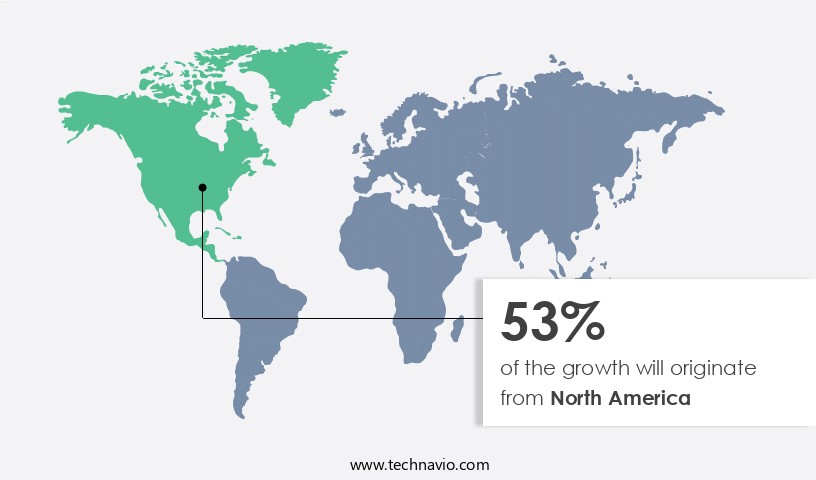
  • North America dominated the market and accounted for a 53% growth during the forecast period.
  • By Distribution Channel - Offline segment was valued at USD 21.88 billion in 2022
  • By Product - Tortilla chips segment accounted for the largest market revenue share in 2022

Market Size & Forecast

  • Market Opportunities: USD 60.33 billion
  • Market Future Opportunities: USD 10.43 billion
  • CAGR from 2023 to 2028 : 5.25%

Market Summary

  • The market is experiencing significant growth due to the increasing demand for convenient and versatile food options. One of the key trends driving this market is the rising preference for gluten-free foods, leading manufacturers to expand their product offerings and invest in research and development to cater to this consumer need. However, the market is not without its challenges. Fluctuations in food commodity prices, particularly those for corn and wheat, can significantly impact the cost structure of tortilla production. For instance, a leading tortilla manufacturer implemented a supply chain optimization strategy to mitigate the impact of price volatility.
  • By establishing strategic partnerships with farmers and suppliers, the company was able to secure long-term contracts and ensure a steady supply of raw materials at predictable prices. This not only improved operational efficiency but also helped the company maintain consistent product quality and meet customer demand. According to recent studies, the implementation of this strategy resulted in a reduction of raw material costs by 15%, leading to significant cost savings and increased profitability for the company. By staying agile and responsive to market trends and challenges, tortilla manufacturers can effectively navigate the complexities of the global market and maintain a competitive edge.

What will be the Size of the Tortilla Market during the forecast period?

Tortilla Market Size

Get Key Insights on Market Forecast (PDF) Request Free Sample

How is the Tortilla Market Segmented ?

The tortilla industry research report provides comprehensive data (region-wise segment analysis), with forecasts and estimates in "USD billion" for the period 2024-2028, as well as historical data from 2018-2022 for the following segments.

  • Distribution Channel
    • Offline
    • Online
  • Product
    • Tortilla chips
    • Pre-cooked tortilla
    • Tortilla mix
  • End-User
    • Household
    • Commercial (Restaurants, Catering)
    • Industrial
  • Application
    • Tacos
    • Burritos
    • Enchiladas
    • Quesadillas
  • Geography
    • North America
      • US
      • Canada
      • Mexico
    • Europe
      • France
      • Germany
      • UK
    • Middle East and Africa
      • UAE
    • APAC
      • Indonesia
      • Malaysia
      • South Korea
      • Thailand
    • South America
      • Argentina
      • Brazil
    • Rest of World (ROW)

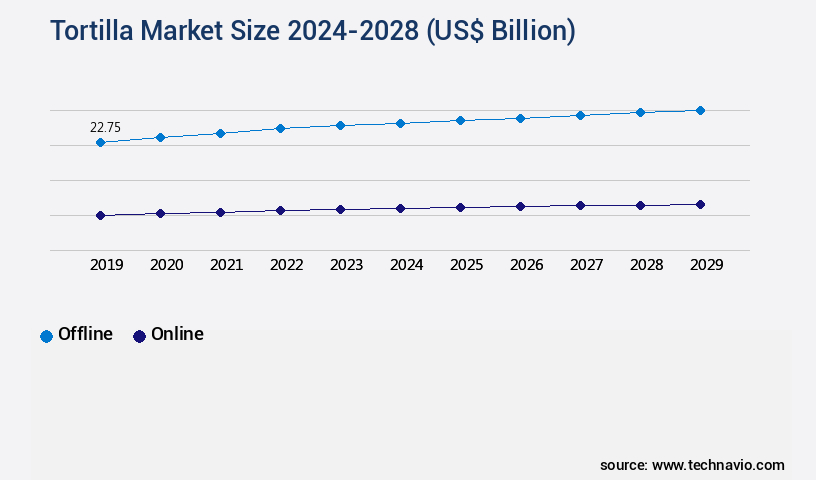
By Distribution Channel Insights

The offline segment is estimated to witness significant growth during the forecast period.

In the dynamic global the market, traditional offline distribution channels, including supermarkets, grocers, convenience stores, and local markets, remain significant contributors. These channels cater to consumers' preference for in-person purchasing, quality assessment, and diverse tortilla selection. Major retailers like Walmart and Kroger, neighborhood grocery stores, and specialty food merchants such as Mexican markets and bakeries illustrate this trend. Automation in production, process optimization, and ingredient sourcing strategies are crucial for enhancing yield, reducing costs, and ensuring product consistency. For instance, dough elasticity measurements, color stability improvement, and moisture content control are essential in tortilla manufacturing.

Furthermore, energy efficiency improvements, waste reduction strategies, and new product development are integral to market growth. According to recent studies, offline distribution channels account for approximately 75% of tortilla sales, underscoring their enduring importance.

Tortilla Market Size

Request Free Sample

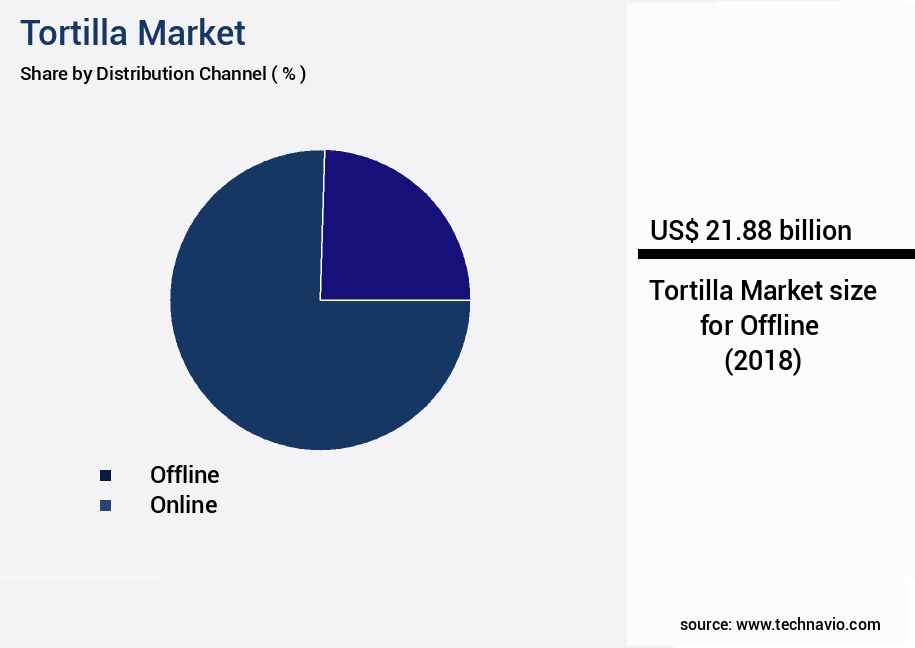
The Offline segment was valued at USD 21.88 billion in 2018 and showed a gradual increase during the forecast period.

Tortilla Market Size

Request Free Sample

Regional Analysis

North America is estimated to contribute 53% to the growth of the global market during the forecast period.Technavio's analysts have elaborately explained the regional trends and drivers that shape the market during the forecast period.

Tortilla Market Share by Geography

See How Tortilla Market Demand is Rising in North America Request Free Sample

The North American the market is experiencing significant growth, fueled by urbanization, a robust food industry, and high company penetration. The US, in particular, is a major contributor to this market's expansion. Rapid urbanization and increased disposable income, with the US GNI per capita reaching USD76,370 in 2022, are key factors driving this trend. The region's population shift from rural areas to cities creates a large consumer base for convenience foods like tortillas. With busy work schedules and hectic lifestyles, the demand for easy-to-prepare meals is on the rise.

Operational efficiency gains and cost reductions are also significant factors, as tortillas offer versatility and affordability. These underlying dynamics make the North American the market an intriguing and evolving sector in the global food industry.

Market Dynamics

Our researchers analyzed the data with 2023 as the base year, along with the key drivers, trends, and challenges. A holistic analysis of drivers will help companies refine their marketing strategies to gain a competitive advantage.

The global tortilla production market is undergoing steady transformation as both traditional methods and modern innovations shape product quality, efficiency, and consumer acceptance. Research on the effect of lime concentration on dough rheology and the optimization of baking parameters for tortilla texture highlights the critical role of ingredient formulation and processing in determining final product characteristics. Studies focusing on starch gelatinization during tortilla baking and evaluation of tortilla dough elasticity provide deeper insights into how texture and structure can be consistently managed to meet evolving consumer expectations.

Shelf life remains a central concern, with analysis of tortilla shelf life using different packaging and investigation of microbial growth in tortillas under various storage conditions emphasizing the importance of food safety and preservation. Comparative studies of traditional and modern tortilla production methods reveal opportunities for efficiency gains, particularly as automation is increasingly adopted to reduce costs and enhance scalability. Efforts to develop sustainable practices for tortilla production and strategies for minimizing tortilla production waste further align the market with broader environmental and resource efficiency goals.

Product innovation also focuses on consumer health and preferences. Methods for improving the nutritional value of tortillas, assessment of tortilla nutritional content and antioxidant properties, and correlation between dough properties and tortilla sensory attributes are shaping product differentiation. Controlling moisture content for optimal tortilla texture, assessing the impact of nixtamalization on tortilla quality, and studying consumer preferences for different tortilla characteristics reinforce the continuous unfolding of this market as it adapts to both operational efficiency needs and changing dietary demands.

Tortilla Market Size

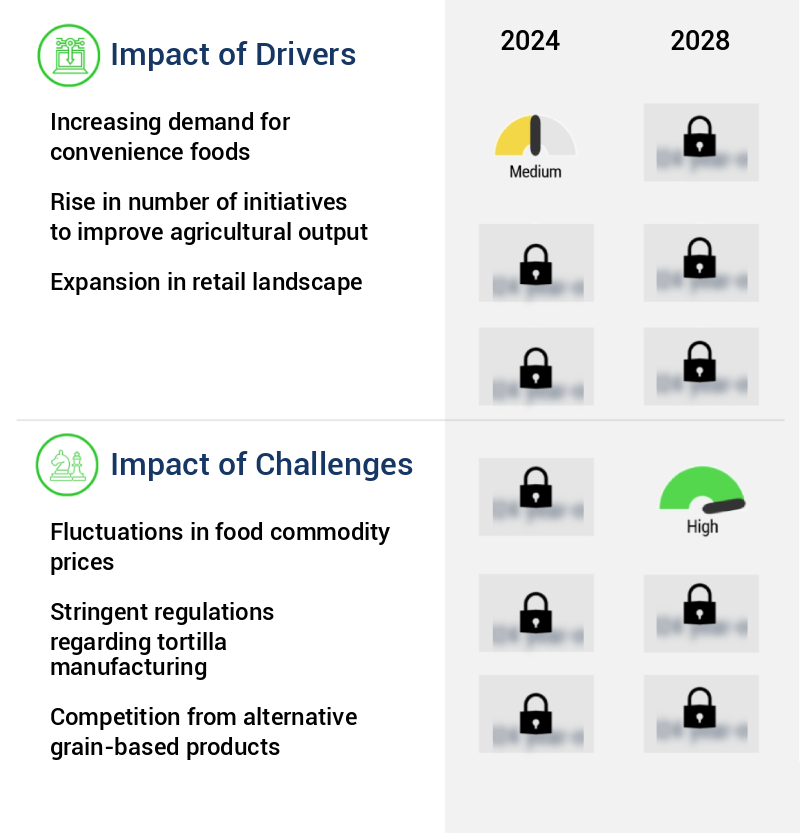
What are the key market drivers leading to the rise in the adoption of Tortilla Industry?

  • The significant surge in consumer preference for convenience foods serves as the primary market catalyst. 
  • The market has experienced significant growth due to the increasing urban population and the rising demand for convenient and easy-to-prepare food options. According to the World Bank, approximately 57% of the world's population resided in cities in 2022, a figure projected to reach 6 billion by 2045, representing a 1.5-fold increase. This urban expansion has led to improved job opportunities and a higher female workforce participation rate of 47%, as per The World Bank Group. As a result, the demand for tortillas and related products has surged, with their versatility and ease of use making them a staple in various industries, including foodservice, retail, and manufacturing.
  • This trend has led to increased efficiency and reduced downtime in these sectors, as well as improved forecasting accuracy for suppliers and distributors. The market's evolution reflects the broader societal shifts driven by urbanization and changing demographics.

What are the market trends shaping the Tortilla Industry?

  • The rising demand for gluten-free tortillas represents a notable market trend in the food industry.
  • In response to growing consumer health consciousness, the market is evolving to cater to the demand for gluten-free options. Approximately 80% of consumers experience gut inflammation due to gluten consumption, potentially leading to conditions like hypothyroidism and type 1 diabetes. Gluten's damaging effects on intestinal cells and the risk of autoimmune attacks have further fueled this trend. Consequently, food manufacturers are expanding their portfolios to include gluten-free tortillas.
  • This shift not only enhances product offerings but also contributes to faster regulatory compliance and cost optimization for businesses.

What challenges does the Tortilla Industry face during its growth?

  • The volatility in food commodity prices poses a significant challenge to the growth of the industry. 
  • The market experiences continuous evolution, with key applications including tortilla mix, pre-cooked tortillas, frozen tortillas, and tortilla chips. The market's growth is significantly influenced by the availability and price of raw materials, primarily corn and wheat. Adverse weather conditions and natural calamities pose challenges to the production of these essential ingredients, leading to supply shortages. The resulting gap between supply and demand has escalated the cost of raw materials, placing pressure on companies' profit margins.

Exclusive Technavio Analysis on Customer Landscape

The tortilla market forecasting report includes the adoption lifecycle of the market, covering from the innovator's stage to the laggard's stage. It focuses on adoption rates in different regions based on penetration. Furthermore, the tortilla market report also includes key purchase criteria and drivers of price sensitivity to help companies evaluate and develop their market growth analysis strategies.

Tortilla Market Share by Geography

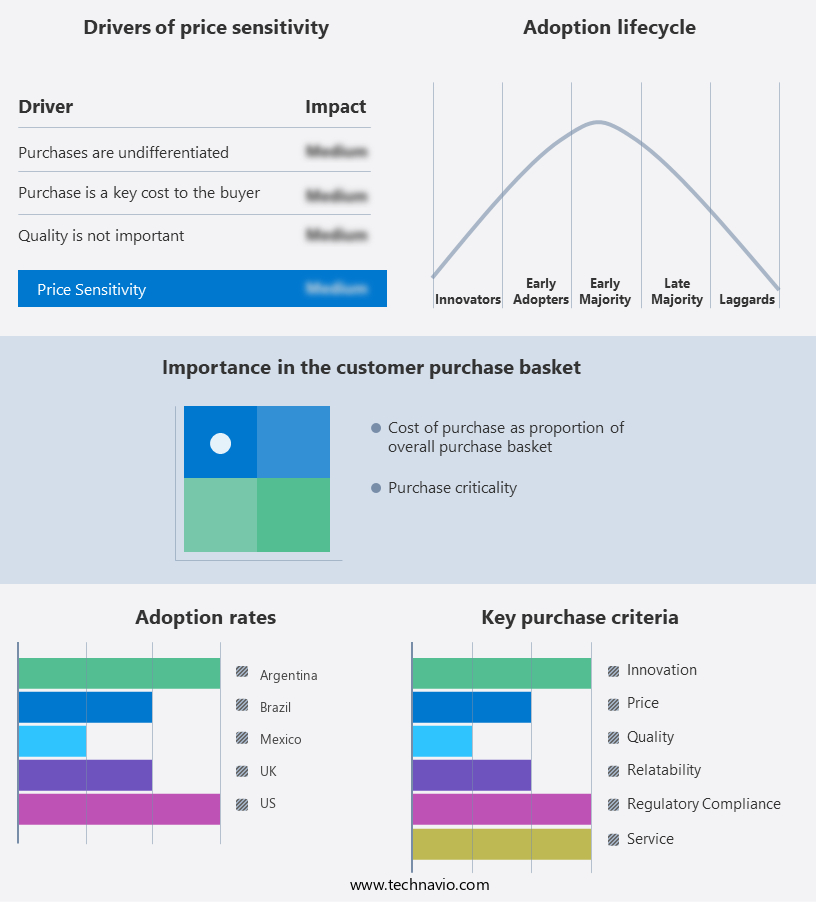
 Customer Landscape of Tortilla Industry

Competitive Landscape

Companies are implementing various strategies, such as strategic alliances, tortilla market forecast, partnerships, mergers and acquisitions, geographical expansion, and product/service launches, to enhance their presence in the industry.

Arandas Tortilla Co. Inc. - This company specializes in producing stone ground corn tortillas for salsa and guacamole, utilizing a 100% authentic process to deliver an authentic, delicious experience. Their commitment to traditional methods ensures a superior taste and texture, enhancing the enjoyment of these popular Mexican dishes.

The industry research and growth report includes detailed analyses of the competitive landscape of the market and information about key companies, including:

  • Arandas Tortilla Co. Inc.
  • Arevalo Foods Inc.
  • Azteca Foods Inc.
  • Bunge Ltd.
  • Cargill Inc.
  • Corporativo Bimbo SA de CV
  • Eagle Foods Australia
  • Easy Food Inc.
  • Fiesta Tortillas
  • Franco Whole Foods LLC
  • Gruma SAB de CV
  • La Tortilla Factory
  • LIVEN S.A.U.
  • MF Food
  • Ole Mexican Foods Inc.
  • PepsiCo Inc.
  • Teasdale Foods Inc.
  • Tyson Foods Inc.
  • Utz Brands Inc.
  • General Mills Inc.

Qualitative and quantitative analysis of companies has been conducted to help clients understand the wider business environment as well as the strengths and weaknesses of key industry players. Data is qualitatively analyzed to categorize companies as pure play, category-focused, industry-focused, and diversified; it is quantitatively analyzed to categorize companies as dominant, leading, strong, tentative, and weak.

Recent Development and News in Tortilla Market

  • In August 2024, Mission Foods, a leading tortilla manufacturer, announced the launch of their new line of low-carb tortillas in response to growing consumer demand for healthier alternatives (Mission Foods Press Release, 2024). This expansion marked a 10% increase in their product offerings.
  • In November 2024, Gruma S.A.B. De C.V., the world's largest tortilla manufacturer, entered into a strategic partnership with Whole Foods Market to supply their fresh tortillas to over 500 Whole Foods stores across the US (Gruma S.A.B. De C.V. Press Release, 2024). This collaboration significantly boosted Gruma's market presence in the US.
  • In February 2025, Herdez Del Fuerte, a prominent Mexican Food company, completed the acquisition of Guerrero Gold Corporation, a leading US tortilla manufacturer, for approximately USD250 million (Herdez Del Fuerte Press Release, 2025). This acquisition expanded Herdez's production capacity and market share in the US.
  • In May 2025, the European Union (EU) approved the use of genetically modified corn for tortilla production, paving the way for increased imports of US tortillas into the EU market (European Commission Press Release, 2025). This regulatory approval opened new opportunities for US tortilla manufacturers in the EU market.

Dive into Technavio's robust research methodology, blending expert interviews, extensive data synthesis, and validated models for unparalleled Tortilla Market insights. See full methodology.

Market Scope

Report Coverage

Details

Page number

165

Base year

2023

Historic period

2018-2022

Forecast period

2024-2028

Growth momentum & CAGR

Accelerate at a CAGR of 5.25%

Market growth 2024-2028

USD 10.43 billion

Market structure

Fragmented

YoY growth 2023-2024(%)

4.84

Key countries

US, Malaysia, Indonesia, Germany, UK, South Korea, France, Canada, Brazil, Thailand, UAE, Mexico, and Argentina

Competitive landscape

Leading Companies, Market Positioning of Companies, Competitive Strategies, and Industry Risks

Request Free Sample

Research Analyst Overview

  • The global tortilla production market is evolving as manufacturers focus on improving both quality and sustainability. Central to this evolution is the nixtamalization process, where lime treatment effects and alkaline treatment impact are carefully monitored to enhance dough handling properties, protein content analysis, and carbohydrate profiling. Enzyme activity analysis, fat content determination, and fiber content analysis provide insights into nutritional quality, while mineral content analysis, vitamin content analysis, and antioxidant capacity assessment help ensure the health benefits of the final product.
  • Production efficiency is increasingly driven by advanced baking temperature control and oven design optimization, alongside process optimization modeling to improve throughput and reduce waste. Storage stability studies, microbial growth kinetics, chemical preservation methods, and physical properties assessment ensure product safety and longevity. Sensory attribute mapping and consumer acceptability testing allow manufacturers to align products with market preferences, while packaging film properties and sustainable production practices support environmental responsibility.
  • Comparative analysis of production parameters shows that optimizing lime concentration during nixtamalization can increase dough elasticity by 15–20% while improving antioxidant retention by up to 12%, demonstrating measurable impacts on both quality and nutritional value. Combined with ingredient cost analysis and quality control protocols, these insights allow manufacturers to balance efficiency, consumer satisfaction, and sustainability in tortilla production. This holistic approach underscores the ongoing innovation in processing, packaging, and ingredient management across the market.

What are the Key Data Covered in this Tortilla Market Research and Growth Report?

  • What is the expected growth of the Tortilla Market between 2024 and 2028?

    • USD 10.43 billion, at a CAGR of 5.25%

  • What segmentation does the market report cover?

    • The report is segmented by Distribution Channel (Offline and Online), Product (Tortilla chips, Pre-cooked tortilla, and Tortilla mix), Geography (North America, South America, Europe, APAC, and Middle East and Africa), End-User (Household, Commercial (Restaurants, Catering), and Industrial), and Application (Tacos, Burritos, Enchiladas, and Quesadillas)

  • Which regions are analyzed in the report?

    • North America, South America, Europe, APAC, and Middle East and Africa

  • What are the key growth drivers and market challenges?

    • Increasing demand for convenience foods, Fluctuations in food commodity prices

  • Who are the major players in the Tortilla Market?

    • Arandas Tortilla Co. Inc., Arevalo Foods Inc., Azteca Foods Inc., Bunge Ltd., Cargill Inc., Corporativo Bimbo SA de CV, Eagle Foods Australia, Easy Food Inc., Fiesta Tortillas, Franco Whole Foods LLC, Gruma SAB de CV, La Tortilla Factory, LIVEN S.A.U., MF Food, Ole Mexican Foods Inc., PepsiCo Inc., Teasdale Foods Inc., Tyson Foods Inc., Utz Brands Inc., and General Mills Inc.

Market Research Insights

  • The market is a dynamic and ever-evolving industry, characterized by continuous growth and innovation. According to recent reports, The market size is estimated to reach over 30 billion units annually, with a significant portion consumed in North America. Furthermore, industry experts anticipate a compound annual growth rate of approximately 4% over the next decade. One notable trend in the market is the increasing demand for fiber-rich and nutrient-dense options.
  • For instance, a leading tortilla manufacturer experienced a 15% increase in sales by introducing a high-fiber variant. Additionally, the industry is projected to maintain its growth trajectory, driven by consumer preferences for convenient, portable, and versatile food solutions.

We can help! Our analysts can customize this tortilla market research report to meet your requirements.

Get in touch

1 Executive Summary

  • 1.1 Market overview
    • Exhibit 01: Executive Summary – Chart on Market Overview
    • Exhibit 02: Executive Summary – Data Table on Market Overview
    • Exhibit 03: Executive Summary – Chart on Global Market Characteristics
    • Exhibit 04: Executive Summary – Chart on Market by Geography
    • Exhibit 05: Executive Summary – Chart on Market Segmentation by Distribution Channel
    • Exhibit 06: Executive Summary – Chart on Market Segmentation by Product
    • Exhibit 07: Executive Summary – Chart on Incremental Growth
    • Exhibit 08: Executive Summary – Data Table on Incremental Growth
    • Exhibit 09: Executive Summary – Chart on Vendor Market Positioning

2 Market Landscape

  • 2.1 Market ecosystem
    • Exhibit 10: Parent market
    • Exhibit 11: Market Characteristics

3 Market Sizing

  • 3.1 Market definition
    • Exhibit 12: Offerings of vendors included in the market definition
  • 3.2 Market segment analysis
    • Exhibit 13: Market segments
  • 3.3 Market size 2023
    • 3.4 Market outlook: Forecast for 2023-2028
      • Exhibit 14: Chart on Global - Market size and forecast 2023-2028 ($ million)
      • Exhibit 15: Data Table on Global - Market size and forecast 2023-2028 ($ million)
      • Exhibit 16: Chart on Global Market: Year-over-year growth 2023-2028 (%)
      • Exhibit 17: Data Table on Global Market: Year-over-year growth 2023-2028 (%)

    4 Historic Market Size

    • 4.1 Global tortilla market 2018 - 2022
      • Exhibit 18: Historic Market Size – Data Table on global tortilla market 2018 - 2022 ($ million)
    • 4.2 Distribution Channel Segment Analysis 2018 - 2022
      • Exhibit 19: Historic Market Size – Distribution Channel Segment 2018 - 2022 ($ million)
    • 4.3 Product Segment Analysis 2018 - 2022
      • Exhibit 20: Historic Market Size – Product Segment 2018 - 2022 ($ million)
    • 4.4 Geography Segment Analysis 2018 - 2022
      • Exhibit 21: Historic Market Size – Geography Segment 2018 - 2022 ($ million)
    • 4.5 Country Segment Analysis 2018 - 2022
      • Exhibit 22: Historic Market Size – Country Segment 2018 - 2022 ($ million)

    5 Five Forces Analysis

    • 5.1 Five forces summary
      • Exhibit 23: Five forces analysis - Comparison between 2023 and 2028
    • 5.2 Bargaining power of buyers
      • Exhibit 24: Chart on Bargaining power of buyers – Impact of key factors 2023 and 2028
    • 5.3 Bargaining power of suppliers
      • Exhibit 25: Bargaining power of suppliers – Impact of key factors in 2023 and 2028
    • 5.4 Threat of new entrants
      • Exhibit 26: Threat of new entrants – Impact of key factors in 2023 and 2028
    • 5.5 Threat of substitutes
      • Exhibit 27: Threat of substitutes – Impact of key factors in 2023 and 2028
    • 5.6 Threat of rivalry
      • Exhibit 28: Threat of rivalry – Impact of key factors in 2023 and 2028
    • 5.7 Market condition
      • Exhibit 29: Chart on Market condition - Five forces 2023 and 2028

    6 Market Segmentation by Distribution Channel

    • 6.1 Market segments
      • Chart on Distribution Channel - Market share (2023-2028) (%)
      • Data Table on Distribution Channel - Market share (2023-2028) (%)
    • 6.2 Comparison by Distribution Channel
      • Chart on Comparison by Distribution Channel
      • Data Table on Comparison by Distribution Channel
    • 6.3 Offline - Market size and forecast (2023-2028)
      • Chart on Offline - Market size and forecast (2023-2028) ($ million)
      • Data Table on Offline - Market size and forecast (2023-2028) ($ million)
      • Chart on Offline - Year-over-year growth (2023-2028) (%)
      • Data Table on Offline - Year-over-year growth (2023-2028) (%)
    • 6.4 Online - Market size and forecast (2023-2028)
      • Chart on Online - Market size and forecast (2023-2028) ($ million)
      • Data Table on Online - Market size and forecast (2023-2028) ($ million)
      • Chart on Online - Year-over-year growth (2023-2028) (%)
      • Data Table on Online - Year-over-year growth (2023-2028) (%)
    • 6.5 Market opportunity by Distribution Channel
      • Market opportunity by Distribution Channel ($ million)
      • Data Table on Market opportunity by Distribution Channel ($ million)

    7 Market Segmentation by Product

    • 7.1 Market segments
      • Chart on Product - Market share (2023-2028) (%)
      • Data Table on Product - Market share (2023-2028) (%)
    • 7.2 Comparison by Product
      • Chart on Comparison by Product
      • Data Table on Comparison by Product
    • 7.3 Tortilla chips - Market size and forecast (2023-2028)
      • Chart on Tortilla chips - Market size and forecast (2023-2028) ($ million)
      • Data Table on Tortilla chips - Market size and forecast (2023-2028) ($ million)
      • Chart on Tortilla chips - Year-over-year growth (2023-2028) (%)
      • Data Table on Tortilla chips - Year-over-year growth (2023-2028) (%)
    • 7.4 Pre-cooked tortilla - Market size and forecast (2023-2028)
      • Chart on Pre-cooked tortilla - Market size and forecast (2023-2028) ($ million)
      • Data Table on Pre-cooked tortilla - Market size and forecast (2023-2028) ($ million)
      • Chart on Pre-cooked tortilla - Year-over-year growth (2023-2028) (%)
      • Data Table on Pre-cooked tortilla - Year-over-year growth (2023-2028) (%)
    • 7.5 Tortilla mix - Market size and forecast (2023-2028)
      • Chart on Tortilla mix - Market size and forecast (2023-2028) ($ million)
      • Data Table on Tortilla mix - Market size and forecast (2023-2028) ($ million)
      • Chart on Tortilla mix - Year-over-year growth (2023-2028) (%)
      • Data Table on Tortilla mix - Year-over-year growth (2023-2028) (%)
    • 7.6 Market opportunity by Product
      • Market opportunity by Product ($ million)
      • Data Table on Market opportunity by Product ($ million)

    8 Market Segmentation by End-User

    • 8.1 Market segments
      • Chart on End-User - Market share (2023-2028) (%)
      • Data Table on End-User - Market share (2023-2028) (%)
    • 8.2 Comparison by End-User
      • Chart on Comparison by End-User
      • Data Table on Comparison by End-User
    • 8.3 Household - Market size and forecast (2023-2028)
      • Chart on Household - Market size and forecast (2023-2028) ($ million)
      • Data Table on Household - Market size and forecast (2023-2028) ($ million)
      • Chart on Household - Year-over-year growth (2023-2028) (%)
      • Data Table on Household - Year-over-year growth (2023-2028) (%)
    • 8.4 Commercial (Restaurants, Catering) - Market size and forecast (2023-2028)
      • Chart on Commercial (Restaurants, Catering) - Market size and forecast (2023-2028) ($ million)
      • Data Table on Commercial (Restaurants, Catering) - Market size and forecast (2023-2028) ($ million)
      • Chart on Commercial (Restaurants, Catering) - Year-over-year growth (2023-2028) (%)
      • Data Table on Commercial (Restaurants, Catering) - Year-over-year growth (2023-2028) (%)
    • 8.5 Industrial - Market size and forecast (2023-2028)
      • Chart on Industrial - Market size and forecast (2023-2028) ($ million)
      • Data Table on Industrial - Market size and forecast (2023-2028) ($ million)
      • Chart on Industrial - Year-over-year growth (2023-2028) (%)
      • Data Table on Industrial - Year-over-year growth (2023-2028) (%)
    • 8.6 Market opportunity by End-User
      • Market opportunity by End-User ($ million)
      • Data Table on Market opportunity by End-User ($ million)

    9 Market Segmentation by Application

    • 9.1 Market segments
      • Chart on Application - Market share (2023-2028) (%)
      • Data Table on Application - Market share (2023-2028) (%)
    • 9.2 Comparison by Application
      • Chart on Comparison by Application
      • Data Table on Comparison by Application
    • 9.3 Tacos - Market size and forecast (2023-2028)
      • Chart on Tacos - Market size and forecast (2023-2028) ($ million)
      • Data Table on Tacos - Market size and forecast (2023-2028) ($ million)
      • Chart on Tacos - Year-over-year growth (2023-2028) (%)
      • Data Table on Tacos - Year-over-year growth (2023-2028) (%)
    • 9.4 Burritos - Market size and forecast (2023-2028)
      • Chart on Burritos - Market size and forecast (2023-2028) ($ million)
      • Data Table on Burritos - Market size and forecast (2023-2028) ($ million)
      • Chart on Burritos - Year-over-year growth (2023-2028) (%)
      • Data Table on Burritos - Year-over-year growth (2023-2028) (%)
    • 9.5 Enchiladas - Market size and forecast (2023-2028)
      • Chart on Enchiladas - Market size and forecast (2023-2028) ($ million)
      • Data Table on Enchiladas - Market size and forecast (2023-2028) ($ million)
      • Chart on Enchiladas - Year-over-year growth (2023-2028) (%)
      • Data Table on Enchiladas - Year-over-year growth (2023-2028) (%)
    • 9.6 Quesadillas - Market size and forecast (2023-2028)
      • Chart on Quesadillas - Market size and forecast (2023-2028) ($ million)
      • Data Table on Quesadillas - Market size and forecast (2023-2028) ($ million)
      • Chart on Quesadillas - Year-over-year growth (2023-2028) (%)
      • Data Table on Quesadillas - Year-over-year growth (2023-2028) (%)
    • 9.7 Market opportunity by Application
      • Market opportunity by Application ($ million)
      • Data Table on Market opportunity by Application ($ million)

    8 Customer Landscape

    • 8.1 Customer landscape overview
      • Exhibit 62: Analysis of price sensitivity, lifecycle, customer purchase basket, adoption rates, and purchase criteria

    9 Geographic Landscape

    • 9.1 Geographic segmentation
      • Exhibit 63: Chart on Market share by geography 2023-2028 (%)
      • Exhibit 64: Data Table on Market share by geography 2023-2028 (%)
    • 9.2 Geographic comparison
      • Exhibit 65: Chart on Geographic comparison
      • Exhibit 66: Data Table on Geographic comparison
    • 9.3 North America - Market size and forecast 2023-2028
      • Exhibit 67: Chart on North America - Market size and forecast 2023-2028 ($ million)
      • Exhibit 68: Data Table on North America - Market size and forecast 2023-2028 ($ million)
      • Exhibit 69: Chart on North America - Year-over-year growth 2023-2028 (%)
      • Exhibit 70: Data Table on North America - Year-over-year growth 2023-2028 (%)
    • 9.4 South America - Market size and forecast 2023-2028
      • Exhibit 71: Chart on South America - Market size and forecast 2023-2028 ($ million)
      • Exhibit 72: Data Table on South America - Market size and forecast 2023-2028 ($ million)
      • Exhibit 73: Chart on South America - Year-over-year growth 2023-2028 (%)
      • Exhibit 74: Data Table on South America - Year-over-year growth 2023-2028 (%)
    • 9.5 Europe - Market size and forecast 2023-2028
      • Exhibit 75: Chart on Europe - Market size and forecast 2023-2028 ($ million)
      • Exhibit 76: Data Table on Europe - Market size and forecast 2023-2028 ($ million)
      • Exhibit 77: Chart on Europe - Year-over-year growth 2023-2028 (%)
      • Exhibit 78: Data Table on Europe - Year-over-year growth 2023-2028 (%)
    • 9.6 APAC - Market size and forecast 2023-2028
      • Exhibit 79: Chart on APAC - Market size and forecast 2023-2028 ($ million)
      • Exhibit 80: Data Table on APAC - Market size and forecast 2023-2028 ($ million)
      • Exhibit 81: Chart on APAC - Year-over-year growth 2023-2028 (%)
      • Exhibit 82: Data Table on APAC - Year-over-year growth 2023-2028 (%)
    • 9.7 Middle East and Africa - Market size and forecast 2023-2028
      • Exhibit 83: Chart on Middle East and Africa - Market size and forecast 2023-2028 ($ million)
      • Exhibit 84: Data Table on Middle East and Africa - Market size and forecast 2023-2028 ($ million)
      • Exhibit 85: Chart on Middle East and Africa - Year-over-year growth 2023-2028 (%)
      • Exhibit 86: Data Table on Middle East and Africa - Year-over-year growth 2023-2028 (%)
    • 9.8 US - Market size and forecast 2023-2028
      • Exhibit 87: Chart on US - Market size and forecast 2023-2028 ($ million)
      • Exhibit 88: Data Table on US - Market size and forecast 2023-2028 ($ million)
      • Exhibit 89: Chart on US - Year-over-year growth 2023-2028 (%)
      • Exhibit 90: Data Table on US - Year-over-year growth 2023-2028 (%)
    • 9.9 Brazil - Market size and forecast 2023-2028
      • Exhibit 91: Chart on Brazil - Market size and forecast 2023-2028 ($ million)
      • Exhibit 92: Data Table on Brazil - Market size and forecast 2023-2028 ($ million)
      • Exhibit 93: Chart on Brazil - Year-over-year growth 2023-2028 (%)
      • Exhibit 94: Data Table on Brazil - Year-over-year growth 2023-2028 (%)
    • 9.10 Mexico - Market size and forecast 2023-2028
      • Exhibit 95: Chart on Mexico - Market size and forecast 2023-2028 ($ million)
      • Exhibit 96: Data Table on Mexico - Market size and forecast 2023-2028 ($ million)
      • Exhibit 97: Chart on Mexico - Year-over-year growth 2023-2028 (%)
      • Exhibit 98: Data Table on Mexico - Year-over-year growth 2023-2028 (%)
    • 9.11 Argentina - Market size and forecast 2023-2028
      • Exhibit 99: Chart on Argentina - Market size and forecast 2023-2028 ($ million)
      • Exhibit 100: Data Table on Argentina - Market size and forecast 2023-2028 ($ million)
      • Exhibit 101: Chart on Argentina - Year-over-year growth 2023-2028 (%)
      • Exhibit 102: Data Table on Argentina - Year-over-year growth 2023-2028 (%)
    • 9.12 UK - Market size and forecast 2023-2028
      • Exhibit 103: Chart on UK - Market size and forecast 2023-2028 ($ million)
      • Exhibit 104: Data Table on UK - Market size and forecast 2023-2028 ($ million)
      • Exhibit 105: Chart on UK - Year-over-year growth 2023-2028 (%)
      • Exhibit 106: Data Table on UK - Year-over-year growth 2023-2028 (%)
    • 9.13 Market opportunity by geography
      • Exhibit 107: Market opportunity by geography ($ million)
      • Exhibit 108: Data Tables on Market opportunity by geography ($ million)
    • 11.14 US - Market size and forecast (2023-2028)
      • Chart on US - Market size and forecast (2023-2028) ($ million)
      • Data Table on US - Market size and forecast (2023-2028) ($ million)
      • Chart on US - Year-over-year growth (2023-2028) (%)
      • Data Table on US - Year-over-year growth (2023-2028) (%)
    • 11.15 Malaysia - Market size and forecast (2023-2028)
      • Chart on Malaysia - Market size and forecast (2023-2028) ($ million)
      • Data Table on Malaysia - Market size and forecast (2023-2028) ($ million)
      • Chart on Malaysia - Year-over-year growth (2023-2028) (%)
      • Data Table on Malaysia - Year-over-year growth (2023-2028) (%)
    • 11.16 Indonesia - Market size and forecast (2023-2028)
      • Chart on Indonesia - Market size and forecast (2023-2028) ($ million)
      • Data Table on Indonesia - Market size and forecast (2023-2028) ($ million)
      • Chart on Indonesia - Year-over-year growth (2023-2028) (%)
      • Data Table on Indonesia - Year-over-year growth (2023-2028) (%)
    • 11.17 Germany - Market size and forecast (2023-2028)
      • Chart on Germany - Market size and forecast (2023-2028) ($ million)
      • Data Table on Germany - Market size and forecast (2023-2028) ($ million)
      • Chart on Germany - Year-over-year growth (2023-2028) (%)
      • Data Table on Germany - Year-over-year growth (2023-2028) (%)
    • 11.18 South Korea - Market size and forecast (2023-2028)
      • Chart on South Korea - Market size and forecast (2023-2028) ($ million)
      • Data Table on South Korea - Market size and forecast (2023-2028) ($ million)
      • Chart on South Korea - Year-over-year growth (2023-2028) (%)
      • Data Table on South Korea - Year-over-year growth (2023-2028) (%)
    • 11.19 France - Market size and forecast (2023-2028)
      • Chart on France - Market size and forecast (2023-2028) ($ million)
      • Data Table on France - Market size and forecast (2023-2028) ($ million)
      • Chart on France - Year-over-year growth (2023-2028) (%)
      • Data Table on France - Year-over-year growth (2023-2028) (%)
    • 11.20 Canada - Market size and forecast (2023-2028)
      • Chart on Canada - Market size and forecast (2023-2028) ($ million)
      • Data Table on Canada - Market size and forecast (2023-2028) ($ million)
      • Chart on Canada - Year-over-year growth (2023-2028) (%)
      • Data Table on Canada - Year-over-year growth (2023-2028) (%)
    • 11.21 Thailand - Market size and forecast (2023-2028)
      • Chart on Thailand - Market size and forecast (2023-2028) ($ million)
      • Data Table on Thailand - Market size and forecast (2023-2028) ($ million)
      • Chart on Thailand - Year-over-year growth (2023-2028) (%)
      • Data Table on Thailand - Year-over-year growth (2023-2028) (%)
    • 11.22 UAE - Market size and forecast (2023-2028)
      • Chart on UAE - Market size and forecast (2023-2028) ($ million)
      • Data Table on UAE - Market size and forecast (2023-2028) ($ million)
      • Chart on UAE - Year-over-year growth (2023-2028) (%)
      • Data Table on UAE - Year-over-year growth (2023-2028) (%)
    • 11.23 Rest of World (ROW) - Market size and forecast (2023-2028)
      • Chart on Rest of World (ROW) - Market size and forecast (2023-2028) ($ million)
      • Data Table on Rest of World (ROW) - Market size and forecast (2023-2028) ($ million)
      • Chart on Rest of World (ROW) - Year-over-year growth (2023-2028) (%)
      • Data Table on Rest of World (ROW) - Year-over-year growth (2023-2028) (%)

    10 Drivers, Challenges, and Trends

    • 10.1 Market drivers
      • 10.2 Market challenges
        • 10.3 Impact of drivers and challenges
          • Exhibit 109: Impact of drivers and challenges in 2023 and 2028
        • 10.4 Market trends

          11 Vendor Landscape

          • 11.1 Overview
            • 11.2 Vendor landscape
              • Exhibit 110: Overview on Criticality of inputs and Factors of differentiation
            • 11.3 Landscape disruption
              • Exhibit 111: Overview on factors of disruption
            • 11.4 Industry risks
              • Exhibit 112: Impact of key risks on business

            12 Vendor Analysis

            • 12.1 Vendors covered
              • Exhibit 113: Vendors covered
            • 12.2 Market positioning of vendors
              • Exhibit 114: Matrix on vendor position and classification
            • 12.3 Arandas Tortilla Co. Inc.
              • Exhibit 115: Arandas Tortilla Co. Inc. - Overview
              • Exhibit 116: Arandas Tortilla Co. Inc. - Product / Service
              • Exhibit 117: Arandas Tortilla Co. Inc. - Key offerings
            • 12.4 Arevalo Foods Inc.
              • Exhibit 118: Arevalo Foods Inc. - Overview
              • Exhibit 119: Arevalo Foods Inc. - Product / Service
              • Exhibit 120: Arevalo Foods Inc. - Key offerings
            • 12.5 Azteca Foods Inc.
              • Exhibit 121: Azteca Foods Inc. - Overview
              • Exhibit 122: Azteca Foods Inc. - Product / Service
              • Exhibit 123: Azteca Foods Inc. - Key offerings
            • 12.6 Bunge Ltd.
              • Exhibit 124: Bunge Ltd. - Overview
              • Exhibit 125: Bunge Ltd. - Business segments
              • Exhibit 126: Bunge Ltd. - Key news
              • Exhibit 127: Bunge Ltd. - Key offerings
              • Exhibit 128: Bunge Ltd. - Segment focus
            • 12.7 Cargill Inc.
              • Exhibit 129: Cargill Inc. - Overview
              • Exhibit 130: Cargill Inc. - Product / Service
              • Exhibit 131: Cargill Inc. - Key news
              • Exhibit 132: Cargill Inc. - Key offerings
            • 12.8 Corporativo Bimbo SA de CV
              • Exhibit 133: Corporativo Bimbo SA de CV - Overview
              • Exhibit 134: Corporativo Bimbo SA de CV - Business segments
              • Exhibit 135: Corporativo Bimbo SA de CV - Key news
              • Exhibit 136: Corporativo Bimbo SA de CV - Key offerings
              • Exhibit 137: Corporativo Bimbo SA de CV - Segment focus
            • 12.9 Eagle Foods Australia
              • Exhibit 138: Eagle Foods Australia - Overview
              • Exhibit 139: Eagle Foods Australia - Product / Service
              • Exhibit 140: Eagle Foods Australia - Key offerings
            • 12.10 Easy Food Inc.
              • Exhibit 141: Easy Food Inc. - Overview
              • Exhibit 142: Easy Food Inc. - Product / Service
              • Exhibit 143: Easy Food Inc. - Key offerings
            • 12.11 Fiesta Tortillas
              • Exhibit 144: Fiesta Tortillas - Overview
              • Exhibit 145: Fiesta Tortillas - Product / Service
              • Exhibit 146: Fiesta Tortillas - Key offerings
            • 12.12 Franco Whole Foods LLC
              • Exhibit 147: Franco Whole Foods LLC - Overview
              • Exhibit 148: Franco Whole Foods LLC - Product / Service
              • Exhibit 149: Franco Whole Foods LLC - Key offerings
            • 12.13 General Mills Inc.
              • Exhibit 150: General Mills Inc. - Overview
              • Exhibit 151: General Mills Inc. - Business segments
              • Exhibit 152: General Mills Inc. - Key news
              • Exhibit 153: General Mills Inc. - Key offerings
              • Exhibit 154: General Mills Inc. - Segment focus
            • 12.14 Gruma SAB de CV
              • Exhibit 155: Gruma SAB de CV - Overview
              • Exhibit 156: Gruma SAB de CV - Business segments
              • Exhibit 157: Gruma SAB de CV - Key offerings
              • Exhibit 158: Gruma SAB de CV - Segment focus
            • 12.15 La Tortilla Factory
              • Exhibit 159: La Tortilla Factory - Overview
              • Exhibit 160: La Tortilla Factory - Product / Service
              • Exhibit 161: La Tortilla Factory - Key offerings
            • 12.16 LIVEN S.A.U.
              • Exhibit 162: LIVEN S.A.U. - Overview
              • Exhibit 163: LIVEN S.A.U. - Product / Service
              • Exhibit 164: LIVEN S.A.U. - Key offerings
            • 12.17 PepsiCo Inc.
              • Exhibit 165: PepsiCo Inc. - Overview
              • Exhibit 166: PepsiCo Inc. - Business segments
              • Exhibit 167: PepsiCo Inc. - Key news
              • Exhibit 168: PepsiCo Inc. - Key offerings
              • Exhibit 169: PepsiCo Inc. - Segment focus

            13 Appendix

            • 13.1 Scope of the report
              • 13.2 Inclusions and exclusions checklist
                • Exhibit 170: Inclusions checklist
                • Exhibit 171: Exclusions checklist
              • 13.3 Currency conversion rates for US$
                • Exhibit 172: Currency conversion rates for US$
              • 13.4 Research methodology
                • Exhibit 173: Research methodology
                • Exhibit 174: Validation techniques employed for market sizing
                • Exhibit 175: Information sources
              • 13.5 List of abbreviations
                • Exhibit 176: List of abbreviations

              Research Methodology

              Technavio presents a detailed picture of the market by way of study, synthesis, and summation of data from multiple sources. The analysts have presented the various facets of the market with a particular focus on identifying the key industry influencers. The data thus presented is comprehensive, reliable, and the result of extensive research, both primary and secondary.

              INFORMATION SOURCES

              Primary sources

              • Manufacturers and suppliers
              • Channel partners
              • Industry experts
              • Strategic decision makers

              Secondary sources

              • Industry journals and periodicals
              • Government data
              • Financial reports of key industry players
              • Historical data
              • Press releases

              DATA ANALYSIS

              Data Synthesis

              • Collation of data
              • Estimation of key figures
              • Analysis of derived insights

              Data Validation

              • Triangulation with data models
              • Reference against proprietary databases
              • Corroboration with industry experts

              REPORT WRITING

              Qualitative

              • Market drivers
              • Market challenges
              • Market trends
              • Five forces analysis

              Quantitative

              • Market size and forecast
              • Market segmentation
              • Geographical insights
              • Competitive landscape

              Interested in this report?

              Get your sample now to see our research methodology and insights!

              Download Now

              Frequently Asked Questions

              Tortilla market growth will increase by $ 10.43 bn during 2024-2028.

              The Tortilla market is expected to grow at a CAGR of 5.25% during 2024-2028.

              Tortilla market is segmented by Distribution Channel( Offline, Online, Tortilla mix) Product( Tortilla chips, Pre-cooked tortilla, Tortilla mix, APAC, Middle East and Africa)

              Arandas Tortilla Co. Inc., Arevalo Foods Inc., Azteca Foods Inc., Bunge Ltd., Cargill Inc., Corporativo Bimbo SA de CV, Eagle Foods Australia, Easy Food Inc., Fiesta Tortillas, Franco Whole Foods LLC, Gruma SAB de CV, La Tortilla Factory, LIVEN S.A.U., MF Food, Ole Mexican Foods Inc., PepsiCo Inc., Teasdale Foods Inc., Tyson Foods Inc., Utz Brands Inc., General Mills Inc. are a few of the key vendors in the Tortilla market.

              North America will register the highest growth rate of 53% among the other regions. Therefore, the Tortilla market in North America is expected to garner significant business opportunities for the vendors during the forecast period.

              US, Malaysia, Indonesia, Germany, UK, South Korea, France, Canada, Brazil, Thailand, UAE, Mexico, Argentina

              • Increasing demand for convenience foodsRapid urbanization across the world has increased disposable incomes. In 2022 is the driving factor this market.
              • 57% of people on the planet reside in cities is the driving factor this market.
              • as per the World Bank. The number of people living in cities worldwide will rise to 6 billion by 2045 is the driving factor this market.
              • a 1.5-fold increase is the driving factor this market.
              • as per the World Bank. With rapid urbanization is the driving factor this market.
              • job prospects improve is the driving factor this market.
              • and people from rural areas migrate to urban areas. The demand for convenience and easy-to-prepare food products has increased owing to rapid urbanization and the high participation of women in the workforce. According to The World Bank Group is the driving factor this market.
              • in 2022 is the driving factor this market.
              • the percentage of women in the global labor workforce was 47%. Hence is the driving factor this market.
              • the demand for convenience foods and fast foods such as tortillas is increasing. The health benefits of tortillas are significant. Tortilla chips provide the required amount of sodium essential for maintaining the water balance in the body. Corn is the driving factor this market.
              • a major ingredient in tortilla products is the driving factor this market.
              • is rich in vitamin B. It contains pantothenic acid and folate that aid in the regulation of metabolism is the driving factor this market.
              • reduce fatigue is the driving factor this market.
              • and keep one physically active. The expansion of the urban population is inculcating new food habits and increasing the preference for international foods. Evolving lifestyles is the driving factor this market.
              • changing food preferences is the driving factor this market.
              • rapid urbanization is the driving factor this market.
              • and the rising number of nuclear families are some factors that are driving the growth of the global fast-food industry. Exposure to international cultures and lifestyles encourages people to experiment with different cuisines is the driving factor this market.
              • such as tortillas; it offers growth opportunities to the global fast-food industry. The popularity of tortillas is increasing in many developed and developing countries as on-the-go foods are widely preferred by the working population in such countries. The rise in consumer purchasing power in APAC and South America is also driving the growth of the tortilla market. Thus is the driving factor this market.
              • the growing demand for convenience foods is encouraging vendors to expand their tortilla offerings is the driving factor this market.
              • which is expected to drive the growth of the global tortilla market during the forecast period. is the driving factor this market.

              The Tortilla market vendors should focus on grabbing business opportunities from the Offline segment as it accounted for the largest market share in the base year.