Traffic Lights Market Size 2025-2029
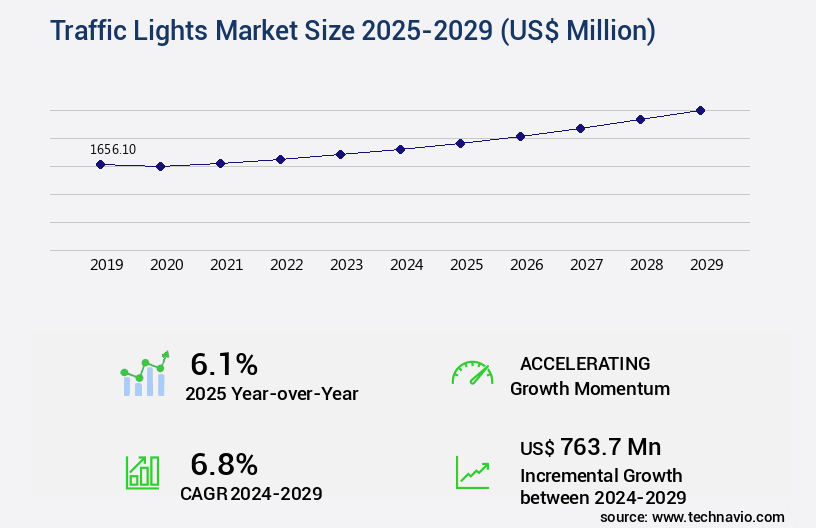
The traffic lights market size is valued to increase USD 763.7 million, at a CAGR of 6.8% from 2024 to 2029. Improving traffic flow regulations will drive the traffic lights market.
Major Market Trends & Insights
- North America dominated the market and accounted for a 43% growth during the forecast period.
- By Application - Road segment was valued at USD 1273.40 million in 2023
- By Product - Incandescent segment accounted for the largest market revenue share in 2023
Market Size & Forecast
- Market Opportunities: USD 64.53 million
- Market Future Opportunities: USD 763.70 million
- CAGR : 6.8%
- North America: Largest market in 2023
Market Summary
- The market encompasses the design, manufacturing, installation, and maintenance of traffic control systems, primarily utilizing core technologies such as sensors, microcontrollers, and communication networks. This market is experiencing significant growth due to the accelerated adoption of LED traffic lights and the ongoing efforts to improve traffic flow regulations. However, challenges persist, including issues with the coordination of signal timings and the need for interoperability between different traffic management systems. As we look ahead, the next five years are expected to bring further advancements, with the increasing integration of AI and IoT technologies in traffic management systems.
- For instance, the share of intelligent traffic systems is projected to reach 25% by 2026. Related markets such as Intelligent Transportation Systems (ITS) and Smart City projects are also driving the demand for advanced traffic control solutions.
What will be the Size of the Traffic Lights Market during the forecast period?

Get Key Insights on Market Forecast (PDF) Request Free Sample
How is the Traffic Lights Market Segmented and what are the key trends of market segmentation?
The traffic lights industry research report provides comprehensive data (region-wise segment analysis), with forecasts and estimates in "USD million" for the period 2025-2029, as well as historical data from 2019-2023 for the following segments.
- Application
- Product
- Technology
- Fixed-time signals
- Actuated signals
- Adaptive signals
- Connected signals
- Component
- Signal Heads
- Controllers
- Detection Systems (Sensors, Cameras)
- Mounting Hardware
- Communication Systems
- End-User
- Government Agencies
- Municipalities
- Highway Authorities
- Private Developers
- Geography
- North America
- Europe
- Middle East and Africa
- APAC
- South America
- Rest of World (ROW)
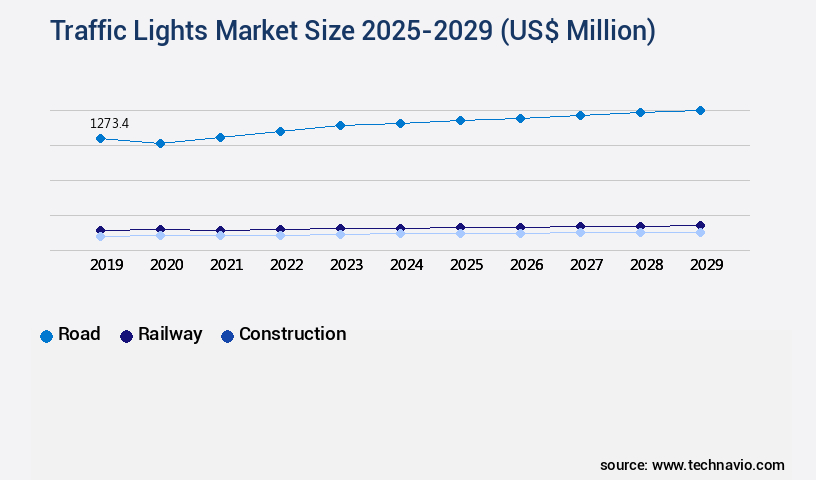
By Application Insights
The road segment is estimated to witness significant growth during the forecast period.
The global traffic management market encompasses various components, including traffic camera systems, traffic signal hardware, pedestrian crossing signals, traffic flow optimization, speed monitoring, traffic signal control, intersection management systems, data acquisition systems, vehicle detection sensors, communication networks, signal timing optimization, congestion detection, incident management systems, roadway lighting systems, travel time prediction, queue length estimation, real-time traffic monitoring, traffic data analysis, video analytics platform, adaptive traffic control, signal timing plans, emergency vehicle preemption, smart city infrastructure, traffic signal maintenance, networked traffic signals, traffic simulation modeling, traffic signal phasing, centralized control systems, traffic signal design, traffic signal controllers, traffic management centers, and AI-powered traffic management.
In the current market landscape, traffic signal systems are witnessing significant adoption, with urban roads accounting for a substantial portion. These systems are essential for managing vehicular and pedestrian movement at intersections and junctions in densely populated areas. Furthermore, the implementation of traffic lights is expanding to highways and expressways, where they regulate merging and diverging traffic flows. According to recent studies, the market for traffic signal systems has experienced a notable growth of 18.3% in urban areas. Moreover, the market is projected to expand by 21.6% in highway and expressway applications. The increasing demand for efficient traffic management solutions, coupled with the integration of advanced technologies like AI and IoT, is driving the market's expansion.
In conclusion, the market is undergoing continuous growth and transformation, with a focus on enhancing safety, optimizing traffic flow, and improving overall road infrastructure. The integration of advanced technologies and the expanding application scope across various sectors are key factors fueling the market's expansion.

Request Free Sample
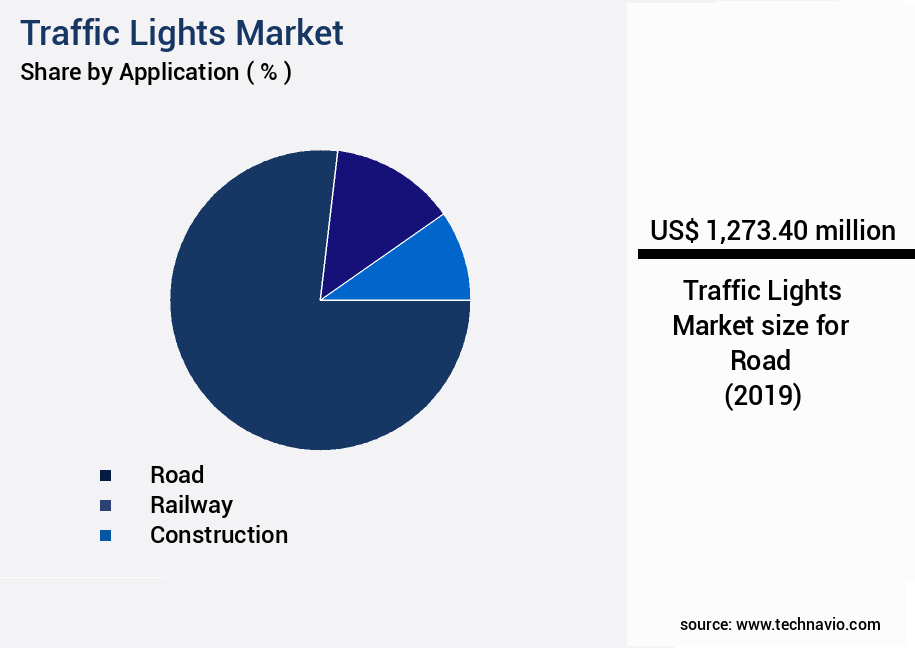
The Road segment was valued at USD 1273.40 million in 2019 and showed a gradual increase during the forecast period.

Request Free Sample
Regional Analysis
North America is estimated to contribute 43% to the growth of the global market during the forecast period.Technavio’s analysts have elaborately explained the regional trends and drivers that shape the market during the forecast period.

See How Traffic Lights Market Demand is Rising in North America Request Free Sample
The North American the market is marked by technological innovations and infrastructure growth. LED traffic lights, known for energy efficiency, extended lifespan, and superior visibility, are gaining popularity. This trend is fueled by the desire to cut maintenance costs and enhance road safety. Infrastructure development, particularly road construction, is another key driver. Governments in the region are investing in highways and expressways to improve connectivity, as roads serve as the primary mode of transportation.
The adoption of intelligent transportation systems, including adaptive traffic signals, is also on the rise, contributing to market expansion. These advancements aim to optimize traffic flow, reduce congestion, and ultimately, ensure safer and more efficient travel.
Market Dynamics
Our researchers analyzed the data with 2024 as the base year, along with the key drivers, trends, and challenges. A holistic analysis of drivers will help companies refine their marketing strategies to gain a competitive advantage.
The market is witnessing significant growth due to the increasing focus on intersection safety improvement strategies. Real-time traffic monitoring systems are being designed and implemented with adaptive traffic control algorithms to optimize signal coordination and reduce congestion. Vehicle detection sensor technology comparison plays a crucial role in selecting the most efficient and accurate sensors for traffic signal control. Cloud-based traffic management systems are gaining popularity due to their scalability and flexibility. AI-powered predictive traffic modeling approaches are being integrated to enhance traffic signal hardware component selection criteria and performance evaluation metrics for traffic systems. Emergency vehicle preemption systems are essential for ensuring priority passage and reducing response times in critical situations.
Sustainable traffic management solutions are being implemented to minimize environmental impact and improve pedestrian safety through signal timing. Advanced traffic management system functionalities, such as data acquisition systems for traffic signal control, traffic signal maintenance scheduling and optimization, roadway lighting design for improved visibility, and traffic simulation modeling for urban environments, are key drivers for market growth. An incident management system for improved response times and a video analytics platform for traffic flow monitoring are becoming essential components of modern traffic management systems. Traffic signal phasing optimization for peak hours is a significant challenge, with some studies suggesting that optimized phasing can reduce travel times by up to 30%.
For instance, a case study in Chicago demonstrated a 25% reduction in travel time during peak hours after implementing adaptive traffic signal control. In conclusion, the market is witnessing robust growth due to the increasing focus on intersection safety, real-time traffic monitoring, adaptive traffic control, and sustainable traffic management solutions. Vehicle detection sensors, cloud-based systems, AI-powered predictive modeling, and advanced traffic management functionalities are key trends driving market growth. The implementation of these technologies is leading to significant improvements in travel times, safety, and environmental sustainability.

What are the key market drivers leading to the rise in the adoption of Traffic Lights Industry?
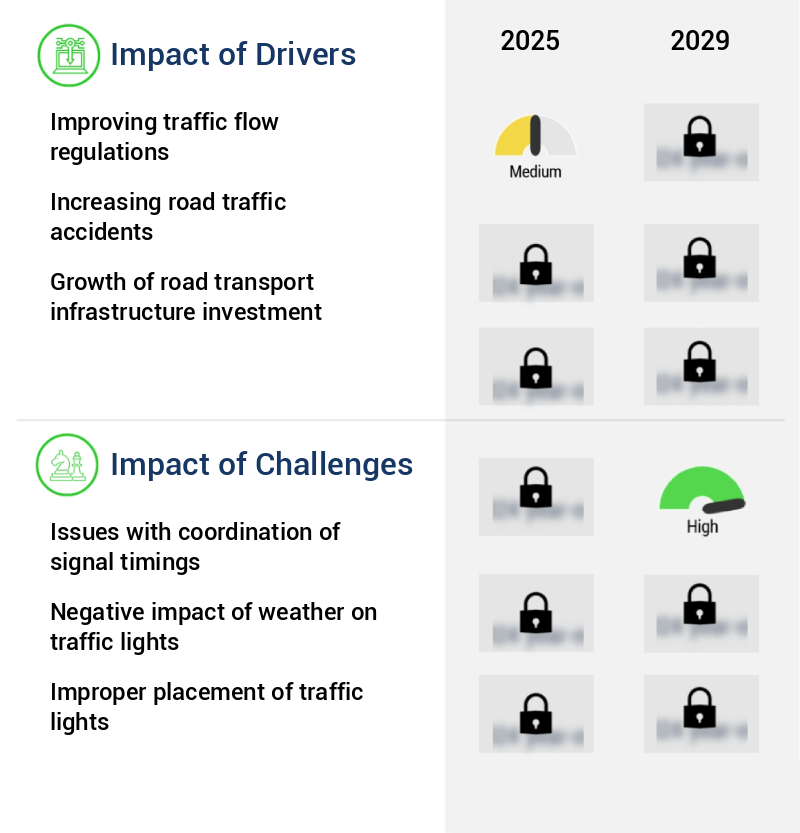
- Enhancing traffic regulations is essential for optimizing market conditions by ensuring smooth flow and reducing congestion.
- The market experiences continuous growth due to the increasing emphasis on efficient traffic management in response to urbanization and population expansion. Traffic congestion is a pressing issue in numerous regions, leading governments and transportation authorities to invest in advanced traffic management systems. Intelligent traffic lights, a key component of these systems, are adopted to optimize traffic flow and minimize congestion. These systems employ technologies such as adaptive signal control and vehicle detection sensors to improve traffic regulation and enhance overall road safety.
- Furthermore, the integration of renewable energy sources, such as solar panels, into traffic lights contributes to their sustainability and reduces energy consumption. The ongoing evolution of traffic management technologies and the growing need for effective traffic flow solutions underscore the market's potential for continued expansion.
What are the market trends shaping the Traffic Lights Industry?
- The accelerated adoption of LED traffic lights represents a significant market trend in the transportation industry. This technological advancement offers numerous benefits, including energy efficiency and longer bulb life.
- LED technology has revolutionized the global lighting industry, particularly in the realm of traffic lights. Traditional incandescent lights, while cost-effective, consume significant energy and necessitate frequent maintenance. In response, manufacturers have prioritized the adoption of LED-based traffic lights. These energy-efficient alternatives not only reduce municipal budgets and energy consumption but also offer enhanced durability compared to their incandescent counterparts. The shift towards LED technology is a global trend, with major cities in the US, such as Boston, New York City, and San Diego, leading the way in implementation.
- Approximately half of all US traffic signals have already been converted to LED, underscoring the technology's widespread appeal and growing adoption. By utilizing LED technology, the lighting industry is not only becoming more energy-efficient but also contributing to cost savings and long-term sustainability.
What challenges does the Traffic Lights Industry face during its growth?
- The coordination of signal timings is a significant challenge in the industry, as it impedes growth by causing potential delays and inefficiencies in operations.
- The market faces the complex challenge of coordinating signal timings at intersections to ensure efficient traffic flow. Misaligned signal timings can lead to traffic congestion and extended travel times. Moreover, traffic patterns change throughout the day, with peak hours experiencing increased traffic volumes. Adapting to these fluctuations is crucial for effective traffic management. Despite advancements, many traffic light systems continue to rely on outdated infrastructure and limited connectivity. According to a study, approximately 30% of urban intersections in developed countries still lack advanced traffic management systems. This lack of coordination results in inefficient traffic management and increased congestion.
- To address these challenges, smart traffic management systems are gaining popularity. These systems use real-time data to coordinate signal timings, reducing wait times and improving overall traffic flow. For instance, adaptive traffic signal control systems can adjust signal timings based on real-time traffic data, minimizing delays and improving overall efficiency. In conclusion, the market is continuously evolving to meet the demands of growing urbanization and increasing traffic volumes. The adoption of smart traffic management systems offers significant potential for improving traffic flow and reducing congestion. However, the implementation of these systems requires significant investment and coordination among various stakeholders.
Exclusive Customer Landscape
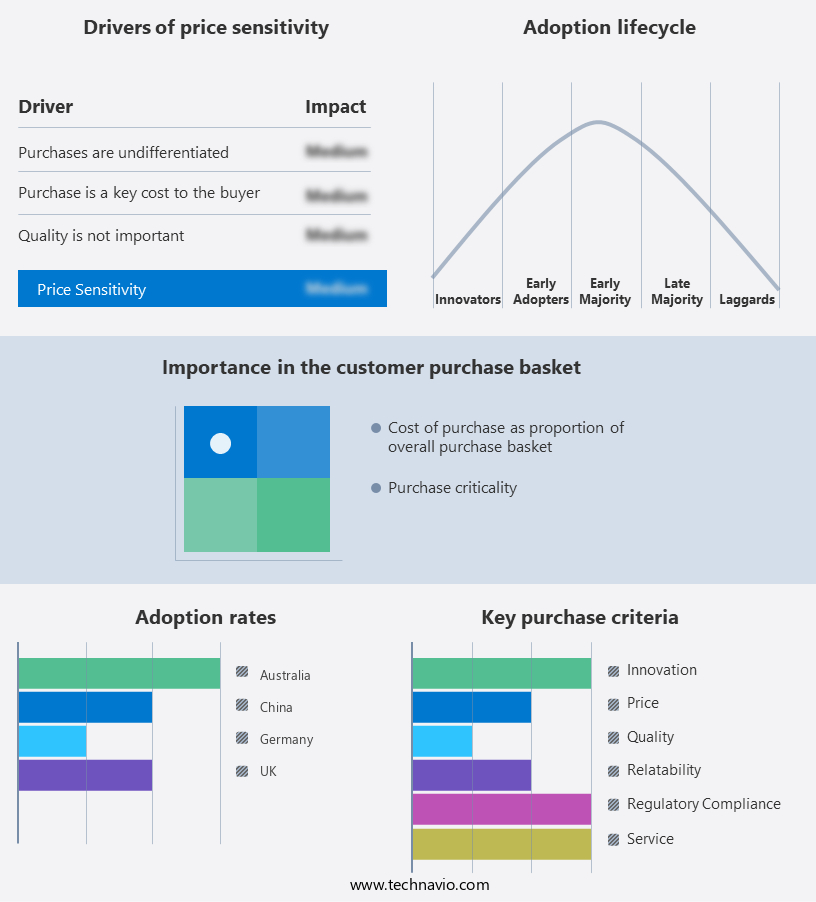
The traffic lights market forecasting report includes the adoption lifecycle of the market, covering from the innovator’s stage to the laggard’s stage. It focuses on adoption rates in different regions based on penetration. Furthermore, the traffic lights market report also includes key purchase criteria and drivers of price sensitivity to help companies evaluate and develop their market growth analysis strategies.

Customer Landscape of Traffic Lights Industry
Competitive Landscape & Market Insights
Companies are implementing various strategies, such as strategic alliances, traffic lights market forecast, partnerships, mergers and acquisitions, geographical expansion, and product/service launches, to enhance their presence in the industry.
Alphatronics NV - The company specializes in manufacturing and supplying advanced traffic management solutions, including LED traffic lights, enhancing road safety and efficiency for communities worldwide.
The industry research and growth report includes detailed analyses of the competitive landscape of the market and information about key companies, including:
- Alphatronics NV
- ARCUS USA Inc.
- Current Lighting Solutions LLC
- D G Controls Ltd.
- Econolite Control Products Inc.
- Envoys Electronic Pvt. Ltd.
- Federal Signal Corp.
- Horizon Signal Technologies Inc.
- LITE ON Technology Corp.
- Mobotrex Inc.
- North America Traffic
- Oriux
- Pfannenberg Group Holding GmbH
- Shenzhen Fama Intelligent Equipment Co. Ltd
- SRL Traffic Systems Ltd.
- SWARCO AG
- Traffic Technologies Ltd.
- Trastar Inc.
- Ver Mac
Qualitative and quantitative analysis of companies has been conducted to help clients understand the wider business environment as well as the strengths and weaknesses of key industry players. Data is qualitatively analyzed to categorize companies as pure play, category-focused, industry-focused, and diversified; it is quantitatively analyzed to categorize companies as dominant, leading, strong, tentative, and weak.
Recent Development and News in Traffic Lights Market
- In January 2024, Siemens Mobility and Bosch Traffic Technology announced a strategic partnership to jointly develop and market advanced traffic management systems, including adaptive traffic light control systems. This collaboration aimed to enhance urban mobility and reduce congestion (Siemens Mobility Press Release, 2024).
- In March 2024, Cisco Systems acquired Sigfoil, a leading provider of wireless sensor networks for smart city applications, including traffic management and intelligent transportation systems. The acquisition was expected to strengthen Cisco's IoT and smart city offerings (Cisco Systems Press Release, 2024).
- In May 2024, the European Union approved the Horizon Europe research and innovation program, which included a €1.5 billion investment in smart mobility and traffic management solutions. This funding would support the development and deployment of advanced traffic management systems, including adaptive traffic light control systems (European Commission Press Release, 2024).
- In February 2025, Kapsch TrafficCom and Intellectus Holding, a subsidiary of Schneider Electric, announced a joint venture to develop and market integrated intelligent transportation systems. The partnership would combine Kapsch's traffic management expertise with Intellectus' advanced traffic signal control technologies (Kapsch TrafficCom Press Release, 2025).
Dive into Technavio’s robust research methodology, blending expert interviews, extensive data synthesis, and validated models for unparalleled Traffic Lights Market insights. See full methodology.
|
Market Scope
|
|
Report Coverage
|
Details
|
|
Page number
|
216
|
|
Base year
|
2024
|
|
Historic period
|
2019-2023 |
|
Forecast period
|
2025-2029
|
|
Growth momentum & CAGR
|
Accelerate at a CAGR of 6.8%
|
|
Market growth 2025-2029
|
USD 763.7 million
|
|
Market structure
|
Fragmented
|
|
YoY growth 2024-2025(%)
|
6.1
|
|
Key countries
|
US, Canada, Germany, UK, Italy, France, China, India, Japan, Brazil, Egypt, UAE, Oman, Argentina, KSA, UAE, Brazil, and Rest of World (ROW)
|
|
Competitive landscape
|
Leading Companies, Market Positioning of Companies, Competitive Strategies, and Industry Risks
|
Request Free Sample
Research Analyst Overview
- Traffic management systems have witnessed significant advancements in recent years, with traffic camera systems and traffic signal hardware playing pivotal roles in optimizing traffic flow. Pedestrian crossing signals, an integral component of these systems, ensure road safety for both vehicles and pedestrians. Traffic signal control and intersection management systems facilitate seamless vehicle movement and prioritize efficient use of communication networks. Data acquisition systems, integrated with vehicle detection sensors, collect real-time traffic data for signal timing optimization and congestion detection. The adoption of adaptive traffic control systems, including signal timing plans and emergency vehicle preemption, has revolutionized traffic management.
- These systems leverage advanced technologies like AI-powered traffic management and cloud-based solutions to enhance their capabilities. Speed monitoring and real-time traffic monitoring are essential features of modern traffic management systems. Travel time prediction and queue length estimation enable proactive traffic management, reducing congestion and improving overall road efficiency. Roadway lighting systems, an integral part of traffic infrastructure, contribute to enhanced safety and visibility. Advanced traffic signal design and controllers, integrated with communication networks, ensure effective centralized control and maintenance of networked traffic signals. Smart city infrastructure, including traffic management centers, continues to evolve, integrating traffic simulation modeling, traffic signal phasing, and centralized control systems.
- These advancements aim to provide more effective and efficient traffic management solutions, ultimately enhancing urban mobility and reducing travel time.
What are the Key Data Covered in this Traffic Lights Market Research and Growth Report?
-
What is the expected growth of the Traffic Lights Market between 2025 and 2029?
-
What segmentation does the market report cover?
-
The report segmented by Application (Road, Railway, and Construction), Product (Incandescent and LED), Technology (Fixed-time signals, Actuated signals, Adaptive signals, and Connected signals), Geography (North America, Europe, APAC, South America, and Middle East and Africa), Component (Signal Heads, Controllers, Detection Systems (Sensors, Cameras), Mounting Hardware, and Communication Systems), and End-User (Government Agencies, Municipalities, Highway Authorities, and Private Developers)
-
Which regions are analyzed in the report?
-
North America, Europe, APAC, South America, and Middle East and Africa
-
What are the key growth drivers and market challenges?
-
Who are the major players in the Traffic Lights Market?
-
Key Companies Alphatronics NV, ARCUS USA Inc., Current Lighting Solutions LLC, D G Controls Ltd., Econolite Control Products Inc., Envoys Electronic Pvt. Ltd., Federal Signal Corp., Horizon Signal Technologies Inc., LITE ON Technology Corp., Mobotrex Inc., North America Traffic, Oriux, Pfannenberg Group Holding GmbH, Shenzhen Fama Intelligent Equipment Co. Ltd, SRL Traffic Systems Ltd., SWARCO AG, Traffic Technologies Ltd., Trastar Inc., and Ver Mac
Market Research Insights
- The market encompasses a diverse range of technologies and applications, with a focus on enhancing transportation efficiency, safety, and sustainability. Performance evaluation metrics, such as network performance indicators and real-time data processing, play a crucial role in optimizing traffic signal performance. For instance, delay reduction strategies like cycle length optimization and energy efficiency measures contribute to improving system reliability and reducing lifecycle costs. Actuated traffic signals and traffic signal coordination, facilitated by advanced technologies like artificial intelligence and signal timing algorithms, enable adaptive control and green traffic management. Induction loop detectors and video image processing are essential components in traffic signal installation and maintenance scheduling.
- Pedestrian safety improvements, such as predictive traffic modeling and data visualization tools, are increasingly prioritized in the market. Additionally, the integration of machine learning models and sustainable transportation initiatives further bolsters the market's growth. For instance, the implementation of advanced traffic signal systems can reduce average delay at intersections by up to 30%, while energy efficiency measures can save up to 20% in electricity consumption. These improvements underscore the importance of continuous innovation and investment in the market.
We can help! Our analysts can customize this traffic lights market research report to meet your requirements.
Get in touch
1 Executive Summary
- 1.1 Market overview
- Executive Summary - Chart on Market Overview
- Executive Summary - Data Table on Market Overview
- Executive Summary - Chart on Global Market Characteristics
- Executive Summary - Chart on Market by Geography
- Executive Summary - Chart on Market Segmentation by Application
- Executive Summary - Chart on Market Segmentation by Product
- Executive Summary - Chart on Market Segmentation by Technology
- Executive Summary - Chart on Incremental Growth
- Executive Summary - Data Table on Incremental Growth
- Executive Summary - Chart on Company Market Positioning
2 Technavio Analysis
- 2.1 Analysis of price sensitivity, lifecycle, customer purchase basket, adoption rates, and purchase criteria
- Analysis of price sensitivity, lifecycle, customer purchase basket, adoption rates, and purchase criteria
- 2.2 Criticality of inputs and Factors of differentiation
- Overview on criticality of inputs and factors of differentiation
- 2.3 Factors of disruption
- Overview on factors of disruption
- 2.4 Impact of drivers and challenges
- Impact of drivers and challenges in 2024 and 2029
3 Market Landscape
- 3.1 Market ecosystem
- Parent Market
- Data Table on - Parent Market
- 3.2 Market characteristics
- Market characteristics analysis
4 Market Sizing
- 4.1 Market definition
- Offerings of companies included in the market definition
- 4.2 Market segment analysis
- 4.4 Market outlook: Forecast for 2024-2029
- Chart on Global - Market size and forecast 2024-2029 ($ million)
- Data Table on Global - Market size and forecast 2024-2029 ($ million)
- Chart on Global Market: Year-over-year growth 2024-2029 (%)
- Data Table on Global Market: Year-over-year growth 2024-2029 (%)
5 Historic Market Size
- 5.1 Global Traffic Lights Market 2019 - 2023
- Historic Market Size - Data Table on Global Traffic Lights Market 2019 - 2023 ($ million)
- 5.2 Application segment analysis 2019 - 2023
- Historic Market Size - Application Segment 2019 - 2023 ($ million)
- 5.3 Product segment analysis 2019 - 2023
- Historic Market Size - Product Segment 2019 - 2023 ($ million)
- 5.4 Technology segment analysis 2019 - 2023
- Historic Market Size - Technology Segment 2019 - 2023 ($ million)
- 5.5 Geography segment analysis 2019 - 2023
- Historic Market Size - Geography Segment 2019 - 2023 ($ million)
- 5.6 Country segment analysis 2019 - 2023
- Historic Market Size - Country Segment 2019 - 2023 ($ million)
6 Qualitative Analysis
- 6.1 Impact of AI in the Global Traffic Lights Market
7 Five Forces Analysis
- 7.1 Five forces summary
- Five forces analysis - Comparison between 2024 and 2029
- 7.2 Bargaining power of buyers
- Bargaining power of buyers - Impact of key factors 2024 and 2029
- 7.3 Bargaining power of suppliers
- Bargaining power of suppliers - Impact of key factors in 2024 and 2029
- 7.4 Threat of new entrants
- Threat of new entrants - Impact of key factors in 2024 and 2029
- 7.5 Threat of substitutes
- Threat of substitutes - Impact of key factors in 2024 and 2029
- 7.6 Threat of rivalry
- Threat of rivalry - Impact of key factors in 2024 and 2029
- 7.7 Market condition
- Chart on Market condition - Five forces 2024 and 2029
8 Market Segmentation by Application
- 8.1 Market segments
- Chart on Application - Market share (2024-2029) (%)
- Data Table on Application - Market share (2024-2029) (%)
- 8.2 Comparison by Application
- Chart on Comparison by Application
- Data Table on Comparison by Application
- 8.3 Road - Market size and forecast (2024-2029)
- Chart on Road - Market size and forecast (2024-2029) ($ million)
- Data Table on Road - Market size and forecast (2024-2029) ($ million)
- Chart on Road - Year-over-year growth (2024-2029) (%)
- Data Table on Road - Year-over-year growth (2024-2029) (%)
- 8.4 Railway - Market size and forecast (2024-2029)
- Chart on Railway - Market size and forecast (2024-2029) ($ million)
- Data Table on Railway - Market size and forecast (2024-2029) ($ million)
- Chart on Railway - Year-over-year growth (2024-2029) (%)
- Data Table on Railway - Year-over-year growth (2024-2029) (%)
- 8.5 Construction - Market size and forecast (2024-2029)
- Chart on Construction - Market size and forecast (2024-2029) ($ million)
- Data Table on Construction - Market size and forecast (2024-2029) ($ million)
- Chart on Construction - Year-over-year growth (2024-2029) (%)
- Data Table on Construction - Year-over-year growth (2024-2029) (%)
- 8.6 Market opportunity by Application
- Market opportunity by Application ($ million)
- Data Table on Market opportunity by Application ($ million)
9 Market Segmentation by Product
- 9.1 Market segments
- Chart on Product - Market share (2024-2029) (%)
- Data Table on Product - Market share (2024-2029) (%)
- 9.2 Comparison by Product
- Chart on Comparison by Product
- Data Table on Comparison by Product
- 9.3 Incandescent - Market size and forecast (2024-2029)
- Chart on Incandescent - Market size and forecast (2024-2029) ($ million)
- Data Table on Incandescent - Market size and forecast (2024-2029) ($ million)
- Chart on Incandescent - Year-over-year growth (2024-2029) (%)
- Data Table on Incandescent - Year-over-year growth (2024-2029) (%)
- 9.4 LED - Market size and forecast (2024-2029)
- Chart on LED - Market size and forecast (2024-2029) ($ million)
- Data Table on LED - Market size and forecast (2024-2029) ($ million)
- Chart on LED - Year-over-year growth (2024-2029) (%)
- Data Table on LED - Year-over-year growth (2024-2029) (%)
- 9.5 Market opportunity by Product
- Market opportunity by Product ($ million)
- Data Table on Market opportunity by Product ($ million)
10 Market Segmentation by Technology
- 10.1 Market segments
- Chart on Technology - Market share (2024-2029) (%)
- Data Table on Technology - Market share (2024-2029) (%)
- 10.2 Comparison by Technology
- Chart on Comparison by Technology
- Data Table on Comparison by Technology
- 10.3 Fixed-time signals - Market size and forecast (2024-2029)
- Chart on Fixed-time signals - Market size and forecast (2024-2029) ($ million)
- Data Table on Fixed-time signals - Market size and forecast (2024-2029) ($ million)
- Chart on Fixed-time signals - Year-over-year growth (2024-2029) (%)
- Data Table on Fixed-time signals - Year-over-year growth (2024-2029) (%)
- 10.4 Actuated signals - Market size and forecast (2024-2029)
- Chart on Actuated signals - Market size and forecast (2024-2029) ($ million)
- Data Table on Actuated signals - Market size and forecast (2024-2029) ($ million)
- Chart on Actuated signals - Year-over-year growth (2024-2029) (%)
- Data Table on Actuated signals - Year-over-year growth (2024-2029) (%)
- 10.5 Adaptive signals - Market size and forecast (2024-2029)
- Chart on Adaptive signals - Market size and forecast (2024-2029) ($ million)
- Data Table on Adaptive signals - Market size and forecast (2024-2029) ($ million)
- Chart on Adaptive signals - Year-over-year growth (2024-2029) (%)
- Data Table on Adaptive signals - Year-over-year growth (2024-2029) (%)
- 10.6 Connected signals - Market size and forecast (2024-2029)
- Chart on Connected signals - Market size and forecast (2024-2029) ($ million)
- Data Table on Connected signals - Market size and forecast (2024-2029) ($ million)
- Chart on Connected signals - Year-over-year growth (2024-2029) (%)
- Data Table on Connected signals - Year-over-year growth (2024-2029) (%)
- 10.7 Market opportunity by Technology
- Market opportunity by Technology ($ million)
- Data Table on Market opportunity by Technology ($ million)
11 Market Segmentation by Component
- 11.1 Market segments
- Chart on Component - Market share (2024-2029) (%)
- Data Table on Component - Market share (2024-2029) (%)
- 11.2 Comparison by Component
- Chart on Comparison by Component
- Data Table on Comparison by Component
- 11.3 Signal Heads - Market size and forecast (2024-2029)
- Chart on Signal Heads - Market size and forecast (2024-2029) ($ million)
- Data Table on Signal Heads - Market size and forecast (2024-2029) ($ million)
- Chart on Signal Heads - Year-over-year growth (2024-2029) (%)
- Data Table on Signal Heads - Year-over-year growth (2024-2029) (%)
- 11.4 Controllers - Market size and forecast (2024-2029)
- Chart on Controllers - Market size and forecast (2024-2029) ($ million)
- Data Table on Controllers - Market size and forecast (2024-2029) ($ million)
- Chart on Controllers - Year-over-year growth (2024-2029) (%)
- Data Table on Controllers - Year-over-year growth (2024-2029) (%)
- 11.5 Detection Systems (Sensors, Cameras) - Market size and forecast (2024-2029)
- Chart on Detection Systems (Sensors, Cameras) - Market size and forecast (2024-2029) ($ million)
- Data Table on Detection Systems (Sensors, Cameras) - Market size and forecast (2024-2029) ($ million)
- Chart on Detection Systems (Sensors, Cameras) - Year-over-year growth (2024-2029) (%)
- Data Table on Detection Systems (Sensors, Cameras) - Year-over-year growth (2024-2029) (%)
- 11.6 Mounting Hardware - Market size and forecast (2024-2029)
- Chart on Mounting Hardware - Market size and forecast (2024-2029) ($ million)
- Data Table on Mounting Hardware - Market size and forecast (2024-2029) ($ million)
- Chart on Mounting Hardware - Year-over-year growth (2024-2029) (%)
- Data Table on Mounting Hardware - Year-over-year growth (2024-2029) (%)
- 11.7 Communication Systems - Market size and forecast (2024-2029)
- Chart on Communication Systems - Market size and forecast (2024-2029) ($ million)
- Data Table on Communication Systems - Market size and forecast (2024-2029) ($ million)
- Chart on Communication Systems - Year-over-year growth (2024-2029) (%)
- Data Table on Communication Systems - Year-over-year growth (2024-2029) (%)
- 11.8 Market opportunity by Component
- Market opportunity by Component ($ million)
- Data Table on Market opportunity by Component ($ million)
12 Market Segmentation by End-User
- 12.1 Market segments
- Chart on End-User - Market share (2024-2029) (%)
- Data Table on End-User - Market share (2024-2029) (%)
- 12.2 Comparison by End-User
- Chart on Comparison by End-User
- Data Table on Comparison by End-User
- 12.3 Government Agencies - Market size and forecast (2024-2029)
- Chart on Government Agencies - Market size and forecast (2024-2029) ($ million)
- Data Table on Government Agencies - Market size and forecast (2024-2029) ($ million)
- Chart on Government Agencies - Year-over-year growth (2024-2029) (%)
- Data Table on Government Agencies - Year-over-year growth (2024-2029) (%)
- 12.4 Municipalities - Market size and forecast (2024-2029)
- Chart on Municipalities - Market size and forecast (2024-2029) ($ million)
- Data Table on Municipalities - Market size and forecast (2024-2029) ($ million)
- Chart on Municipalities - Year-over-year growth (2024-2029) (%)
- Data Table on Municipalities - Year-over-year growth (2024-2029) (%)
- 12.5 Highway Authorities - Market size and forecast (2024-2029)
- Chart on Highway Authorities - Market size and forecast (2024-2029) ($ million)
- Data Table on Highway Authorities - Market size and forecast (2024-2029) ($ million)
- Chart on Highway Authorities - Year-over-year growth (2024-2029) (%)
- Data Table on Highway Authorities - Year-over-year growth (2024-2029) (%)
- 12.6 Private Developers - Market size and forecast (2024-2029)
- Chart on Private Developers - Market size and forecast (2024-2029) ($ million)
- Data Table on Private Developers - Market size and forecast (2024-2029) ($ million)
- Chart on Private Developers - Year-over-year growth (2024-2029) (%)
- Data Table on Private Developers - Year-over-year growth (2024-2029) (%)
- 12.7 Market opportunity by End-User
- Market opportunity by End-User ($ million)
- Data Table on Market opportunity by End-User ($ million)
13 Customer Landscape
- 13.1 Customer landscape overview
- Analysis of price sensitivity, lifecycle, customer purchase basket, adoption rates, and purchase criteria
14 Geographic Landscape
- 14.1 Geographic segmentation
- Chart on Market share by geography 2024-2029 (%)
- Data Table on Market share by geography 2024-2029 (%)
- 14.2 Geographic comparison
- Chart on Geographic comparison
- Data Table on Geographic comparison
- 14.3 North America - Market size and forecast 2024-2029
- Chart on North America - Market size and forecast 2024-2029 ($ million)
- Data Table on North America - Market size and forecast 2024-2029 ($ million)
- Chart on North America - Year-over-year growth 2024-2029 (%)
- Data Table on North America - Year-over-year growth 2024-2029 (%)
- 14.4 Europe - Market size and forecast 2024-2029
- Chart on Europe - Market size and forecast 2024-2029 ($ million)
- Data Table on Europe - Market size and forecast 2024-2029 ($ million)
- Chart on Europe - Year-over-year growth 2024-2029 (%)
- Data Table on Europe - Year-over-year growth 2024-2029 (%)
- 14.5 APAC - Market size and forecast 2024-2029
- Chart on APAC - Market size and forecast 2024-2029 ($ million)
- Data Table on APAC - Market size and forecast 2024-2029 ($ million)
- Chart on APAC - Year-over-year growth 2024-2029 (%)
- Data Table on APAC - Year-over-year growth 2024-2029 (%)
- 14.6 South America - Market size and forecast 2024-2029
- Chart on South America - Market size and forecast 2024-2029 ($ million)
- Data Table on South America - Market size and forecast 2024-2029 ($ million)
- Chart on South America - Year-over-year growth 2024-2029 (%)
- Data Table on South America - Year-over-year growth 2024-2029 (%)
- 14.7 Middle East and Africa - Market size and forecast 2024-2029
- Chart on Middle East and Africa - Market size and forecast 2024-2029 ($ million)
- Data Table on Middle East and Africa - Market size and forecast 2024-2029 ($ million)
- Chart on Middle East and Africa - Year-over-year growth 2024-2029 (%)
- Data Table on Middle East and Africa - Year-over-year growth 2024-2029 (%)
- 14.8 US - Market size and forecast 2024-2029
- Chart on US - Market size and forecast 2024-2029 ($ million)
- Data Table on US - Market size and forecast 2024-2029 ($ million)
- Chart on US - Year-over-year growth 2024-2029 (%)
- Data Table on US - Year-over-year growth 2024-2029 (%)
- 14.9 Canada - Market size and forecast 2024-2029
- Chart on Canada - Market size and forecast 2024-2029 ($ million)
- Data Table on Canada - Market size and forecast 2024-2029 ($ million)
- Chart on Canada - Year-over-year growth 2024-2029 (%)
- Data Table on Canada - Year-over-year growth 2024-2029 (%)
- 14.10 China - Market size and forecast 2024-2029
- Chart on China - Market size and forecast 2024-2029 ($ million)
- Data Table on China - Market size and forecast 2024-2029 ($ million)
- Chart on China - Year-over-year growth 2024-2029 (%)
- Data Table on China - Year-over-year growth 2024-2029 (%)
- 14.11 Germany - Market size and forecast 2024-2029
- Chart on Germany - Market size and forecast 2024-2029 ($ million)
- Data Table on Germany - Market size and forecast 2024-2029 ($ million)
- Chart on Germany - Year-over-year growth 2024-2029 (%)
- Data Table on Germany - Year-over-year growth 2024-2029 (%)
- 14.12 UK - Market size and forecast 2024-2029
- Chart on UK - Market size and forecast 2024-2029 ($ million)
- Data Table on UK - Market size and forecast 2024-2029 ($ million)
- Chart on UK - Year-over-year growth 2024-2029 (%)
- Data Table on UK - Year-over-year growth 2024-2029 (%)
- 14.13 Japan - Market size and forecast 2024-2029
- Chart on Japan - Market size and forecast 2024-2029 ($ million)
- Data Table on Japan - Market size and forecast 2024-2029 ($ million)
- Chart on Japan - Year-over-year growth 2024-2029 (%)
- Data Table on Japan - Year-over-year growth 2024-2029 (%)
- 14.14 India - Market size and forecast 2024-2029
- Chart on India - Market size and forecast 2024-2029 ($ million)
- Data Table on India - Market size and forecast 2024-2029 ($ million)
- Chart on India - Year-over-year growth 2024-2029 (%)
- Data Table on India - Year-over-year growth 2024-2029 (%)
- 14.15 France - Market size and forecast 2024-2029
- Chart on France - Market size and forecast 2024-2029 ($ million)
- Data Table on France - Market size and forecast 2024-2029 ($ million)
- Chart on France - Year-over-year growth 2024-2029 (%)
- Data Table on France - Year-over-year growth 2024-2029 (%)
- 14.16 Italy - Market size and forecast 2024-2029
- Chart on Italy - Market size and forecast 2024-2029 ($ million)
- Data Table on Italy - Market size and forecast 2024-2029 ($ million)
- Chart on Italy - Year-over-year growth 2024-2029 (%)
- Data Table on Italy - Year-over-year growth 2024-2029 (%)
- 14.17 South Korea - Market size and forecast 2024-2029
- Chart on South Korea - Market size and forecast 2024-2029 ($ million)
- Data Table on South Korea - Market size and forecast 2024-2029 ($ million)
- Chart on South Korea - Year-over-year growth 2024-2029 (%)
- Data Table on South Korea - Year-over-year growth 2024-2029 (%)
- 14.18 Market opportunity by geography
- Market opportunity by geography ($ million)
- Data Tables on Market opportunity by geography ($ million)
- 14.19 Brazil - Market size and forecast (2024-2029)
- Chart on Brazil - Market size and forecast (2024-2029) ($ million)
- Data Table on Brazil - Market size and forecast (2024-2029) ($ million)
- Chart on Brazil - Year-over-year growth (2024-2029) (%)
- Data Table on Brazil - Year-over-year growth (2024-2029) (%)
- 14.20 Egypt - Market size and forecast (2024-2029)
- Chart on Egypt - Market size and forecast (2024-2029) ($ million)
- Data Table on Egypt - Market size and forecast (2024-2029) ($ million)
- Chart on Egypt - Year-over-year growth (2024-2029) (%)
- Data Table on Egypt - Year-over-year growth (2024-2029) (%)
- 14.21 UAE - Market size and forecast (2024-2029)
- Chart on UAE - Market size and forecast (2024-2029) ($ million)
- Data Table on UAE - Market size and forecast (2024-2029) ($ million)
- Chart on UAE - Year-over-year growth (2024-2029) (%)
- Data Table on UAE - Year-over-year growth (2024-2029) (%)
- 14.22 Oman - Market size and forecast (2024-2029)
- Chart on Oman - Market size and forecast (2024-2029) ($ million)
- Data Table on Oman - Market size and forecast (2024-2029) ($ million)
- Chart on Oman - Year-over-year growth (2024-2029) (%)
- Data Table on Oman - Year-over-year growth (2024-2029) (%)
- 14.23 Argentina - Market size and forecast (2024-2029)
- Chart on Argentina - Market size and forecast (2024-2029) ($ million)
- Data Table on Argentina - Market size and forecast (2024-2029) ($ million)
- Chart on Argentina - Year-over-year growth (2024-2029) (%)
- Data Table on Argentina - Year-over-year growth (2024-2029) (%)
- 14.24 KSA - Market size and forecast (2024-2029)
- Chart on KSA - Market size and forecast (2024-2029) ($ million)
- Data Table on KSA - Market size and forecast (2024-2029) ($ million)
- Chart on KSA - Year-over-year growth (2024-2029) (%)
- Data Table on KSA - Year-over-year growth (2024-2029) (%)
- 14.25 Rest of World (ROW) - Market size and forecast (2024-2029)
- Chart on Rest of World (ROW) - Market size and forecast (2024-2029) ($ million)
- Data Table on Rest of World (ROW) - Market size and forecast (2024-2029) ($ million)
- Chart on Rest of World (ROW) - Year-over-year growth (2024-2029) (%)
- Data Table on Rest of World (ROW) - Year-over-year growth (2024-2029) (%)
15 Drivers, Challenges, and Opportunity/Restraints
- 15.3 Impact of drivers and challenges
- Impact of drivers and challenges in 2024 and 2029
- 15.4 Market opportunities/restraints
16 Competitive Landscape
- 16.2 Competitive Landscape
- Overview on criticality of inputs and factors of differentiation
- 16.3 Landscape disruption
- Overview on factors of disruption
- 16.4 Industry risks
- Impact of key risks on business
17 Competitive Analysis
- 17.2 Company ranking index
- 17.3 Market positioning of companies
- Matrix on companies position and classification
- 17.4 Alphatronics NV
- Alphatronics NV - Overview
- Alphatronics NV - Product / Service
- Alphatronics NV - Key offerings
- SWOT
- 17.5 ARCUS USA Inc.
- ARCUS USA Inc. - Overview
- ARCUS USA Inc. - Product / Service
- ARCUS USA Inc. - Key offerings
- SWOT
- 17.6 Current Lighting Solutions LLC
- Current Lighting Solutions LLC - Overview
- Current Lighting Solutions LLC - Product / Service
- Current Lighting Solutions LLC - Key offerings
- SWOT
- 17.7 D G Controls Ltd.
- D G Controls Ltd. - Overview
- D G Controls Ltd. - Product / Service
- D G Controls Ltd. - Key offerings
- SWOT
- 17.8 Econolite Control Products Inc.
- Econolite Control Products Inc. - Overview
- Econolite Control Products Inc. - Product / Service
- Econolite Control Products Inc. - Key offerings
- SWOT
- 17.9 Envoys Electronic Pvt. Ltd.
- Envoys Electronic Pvt. Ltd. - Overview
- Envoys Electronic Pvt. Ltd. - Product / Service
- Envoys Electronic Pvt. Ltd. - Key offerings
- SWOT
- 17.10 Federal Signal Corp.
- Federal Signal Corp. - Overview
- Federal Signal Corp. - Business segments
- Federal Signal Corp. - Key offerings
- Federal Signal Corp. - Segment focus
- SWOT
- 17.11 LITE ON Technology Corp.
- LITE ON Technology Corp. - Overview
- LITE ON Technology Corp. - Business segments
- LITE ON Technology Corp. - Key news
- LITE ON Technology Corp. - Key offerings
- LITE ON Technology Corp. - Segment focus
- SWOT
- 17.12 Mobotrex Inc.
- Mobotrex Inc. - Overview
- Mobotrex Inc. - Product / Service
- Mobotrex Inc. - Key offerings
- SWOT
- 17.13 North America Traffic
- North America Traffic - Overview
- North America Traffic - Product / Service
- North America Traffic - Key offerings
- SWOT
- 17.14 Oriux
- Oriux - Overview
- Oriux - Product / Service
- Oriux - Key offerings
- SWOT
- 17.15 SRL Traffic Systems Ltd.
- SRL Traffic Systems Ltd. - Overview
- SRL Traffic Systems Ltd. - Product / Service
- SRL Traffic Systems Ltd. - Key offerings
- SWOT
- 17.16 SWARCO AG
- SWARCO AG - Overview
- SWARCO AG - Product / Service
- SWARCO AG - Key offerings
- SWOT
- 17.17 Traffic Technologies Ltd.
- Traffic Technologies Ltd. - Overview
- Traffic Technologies Ltd. - Product / Service
- Traffic Technologies Ltd. - Key offerings
- SWOT
- 17.18 Trastar Inc.
- Trastar Inc. - Overview
- Trastar Inc. - Product / Service
- Trastar Inc. - Key offerings
- SWOT
18 Appendix
- 18.2 Inclusions and exclusions checklist
- Inclusions checklist
- Exclusions checklist
- 18.3 Currency conversion rates for US$
- Currency conversion rates for US$
- 18.4 Research methodology
- 18.7 Validation techniques employed for market sizing
- Validation techniques employed for market sizing
- 18.9 360 degree market analysis
- 360 degree market analysis
- 18.10 List of abbreviations