
Truck-As-A-Service Market Size 2025-2029
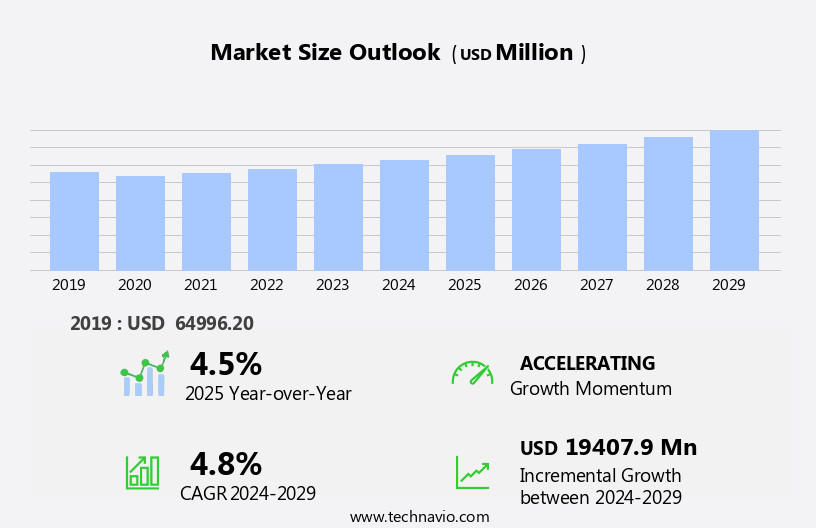
The truck-as-a-service market size is forecast to increase by USD 19.41 billion, at a CAGR of 4.8% between 2024 and 2029.
- The Truck-as-a-Service (TaaS) market is experiencing significant growth, driven by the digital transformation in the trucking industry. Companies are increasingly adopting technology-driven business models, shifting from traditional truck ownership to TaaS. This trend is expected to continue as the industry embraces advanced technologies such as telematics, predictive maintenance, and real-time freight matching. However, the market faces a major challenge in the form of the shortage of truck drivers. This issue is compounded by the increasing demand for freight transportation and the aging workforce. Fleet utilization and route optimization software, integrated with mobile apps and APIs, are streamlining operations and enhancing productivity.
- Another emerging trend is the use of blockchain in trucking, which offers potential benefits such as increased transparency, improved security, and enhanced operational efficiency. Companies that can effectively address these challenges and leverage these trends will be well-positioned to capitalize on the opportunities in the TaaS market. To mitigate this challenge, companies are exploring solutions such as driver training programs, partnerships with third-party logistics providers, and the adoption of automation technologies. Moreover, the adoption of driver safety features, such as geofencing technology and real-time location tracking, is gaining traction to ensure compliance with regulations and improve safety.
What will be the Size of the Truck-As-A-Service Market during the forecast period?
Get Key Insights on Market Forecast (PDF)
Request Free Sample
- The market continues to evolve, driven by advancements in technology and shifting business needs. Maintenance scheduling and route optimization are key areas of focus, with predictive maintenance strategies becoming increasingly prevalent. Asset utilization is maximized through pay-per-use models, enabling businesses to only pay for the truck usage they require. Real-time tracking and active safety features ensure operational efficiency and improved driver safety. Fuel efficiency monitoring and compliance monitoring are essential for reducing costs and maintaining regulatory compliance. Over-the-air updates allow for continuous improvement, while repair cost reduction is a significant benefit. A data analytics platform is central to these efforts, providing valuable insights into performance metrics, engine diagnostics, and driver behavior analysis.
- Subscription models and usage-based insurance offer flexible pricing options, while tire pressure monitoring and brake system monitoring ensure vehicle reliability. Parts inventory management and geofencing capabilities enable proactive maintenance, reducing vehicle downtime. Telematics integration, including insurance telematics, provides real-time data for remote diagnostics and remote control diagnostics. Connected vehicle technology and uptime optimization further enhance the value proposition of truck-as-a-service offerings. For instance, a leading logistics company reported a 20% reduction in vehicle downtime by implementing a comprehensive fleet management system with real-time tracking and predictive maintenance capabilities. Industry growth in the market is expected to reach 15% annually, underpinned by these continuous innovations.
How is this Truck-As-A-Service Industry segmented?
The truck-as-a-service industry research report provides comprehensive data (region-wise segment analysis), with forecasts and estimates in "USD million" for the period 2025-2029, as well as historical data from 2019-2023 for the following segments.
- Service
- Rental services
- Telematics and analytics
- Truck platooning
- Application
- Chemicals
- Pharmaceutical and healthcare
- FMCG
- Food and beverages
- Others
- Vehicle Type
- Light duty trucks
- Heavy duty trucks
- Geography
- North America
- US
- Canada
- Mexico
- Europe
- France
- Germany
- Italy
- UK
- APAC
- China
- India
- Japan
- Rest of World (ROW)
- North America
By Service Insights
The Rental services segment is estimated to witness significant growth during the forecast period. The market is witnessing significant growth, driven by the increasing adoption of advanced technologies such as predictive maintenance, real-time tracking, and route optimization. These innovations enable fleet management systems to improve asset utilization, reduce repair costs, and enhance operational efficiency. For instance, predictive maintenance based on engine diagnostics and performance metrics can help identify potential issues before they cause vehicle downtime, ensuring uptime optimization. Moreover, the pay-per-use model, which allows businesses to pay for truck usage rather than ownership, is gaining popularity due to its cost-effectiveness. This model also includes subscription plans that offer access to additional features like tire pressure monitoring, brake system monitoring, and parts inventory management. One such innovation is the adoption of blockchain technology in trucking, which offers benefits such as increased transparency, improved security, and streamlined supply chain management.
Fleet management systems are also integrating active safety features, such as geofencing capabilities and telematics integration, to ensure driver safety and compliance monitoring. Furthermore, connected vehicle technology enables real-time fuel efficiency monitoring, remote diagnostics, and driver behavior analysis. According to recent industry reports, the market is expected to grow by over 15% annually. This growth is attributed to the increasing demand for flexible and cost-effective logistics solutions, as well as the integration of advanced technologies to improve fleet management and operational efficiency. For example, a leading truck rental company reported a 20% increase in sales due to the implementation of a data analytics platform and usage-based insurance.
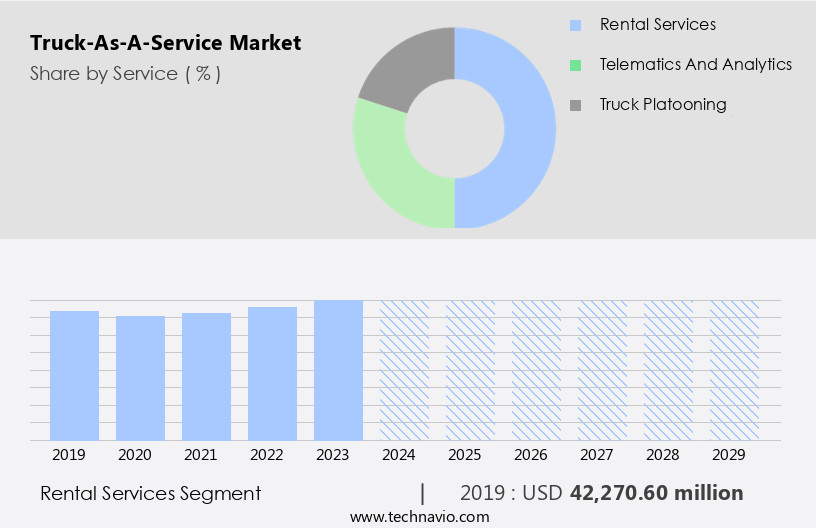
The Rental services segment was valued at USD 42.27 billion in 2019 and showed a gradual increase during the forecast period.
The Truck-As-A-Service Market is transforming fleet operations through advanced service contract management and real-time driver performance scorecard insights. Tools like a mobile maintenance portal and data driven decision making enhance operational efficiency, while a customer support portal ensures streamlined communication. Improved availability of vehicles is achieved via tailored truck service subscription packages and proactive data driven maintenance strategies. Businesses benefit from total cost of ownership reduction through asset utilization and optimization and effective vehicle downtime minimization methods. Innovations such as the over-the-air software update process and integrated connected truck platform features provide continuous upgrades and enhanced performance. For instance, in the US, e-commerce sales account for approximately 15% of total retail sales, driving the need for reliable last-mile delivery services.
Regional Analysis
North America is estimated to contribute 55% to the growth of the global market during the forecast period. Technavio's analysts have elaborately explained the regional trends and drivers that shape the market during the forecast period.

See How truck-as-a-service market Demand is Rising in North America Request Free Sample
In the North American market, there is a notable shift towards advanced fleet solutions driven by logistics evolution, regulatory requirements, and the growing emphasis on operational efficiency. This transition involves moving away from conventional ownership models towards flexible, cost-effective, and scalable service-based solutions. Telematics integration, predictive maintenance systems, and digital platforms are key elements enabling this transformation. Advanced telematics facilitate real-time tracking, vehicle diagnostics, and performance metrics, while predictive maintenance ensures optimal asset utilization and reduces repair costs. Government initiatives focusing on sustainability and emissions reduction further fuel the adoption of service-based truck models, particularly in urban and regional distribution networks.
Subscription-based vehicle access, pay-per-use models, and full-service leasing are gaining popularity as businesses aim to minimize capital expenditure and enhance agility in response to market fluctuations. By 2026, the North American market is expected to grow by over 15%, as businesses increasingly prioritize fleet optimization, safety features, and cost savings. For instance, a leading logistics company reported a 20% reduction in vehicle downtime and a 12% improvement in operational efficiency after implementing a fleet management system with predictive maintenance and real-time tracking capabilities.
Market Dynamics
Our researchers analyzed the data with 2024 as the base year, along with the key drivers, trends, and challenges. A holistic analysis of drivers will help companies refine their marketing strategies to gain a competitive advantage. The market is experiencing significant growth as businesses seek to optimize their fleet operations through innovative subscription packages. These packages offer real-time vehicle location tracking, enabling effective fleet management and asset utilization. Predictive maintenance algorithms and remote diagnostics troubleshooting tools ensure vehicle health, reducing unexpected downtime and maintenance costs. Pay-per-use pricing strategies provide flexibility, allowing businesses to scale their fleet according to demand. Driver behavior modification programs and fuel efficiency improvement techniques contribute to cost savings and improved sustainability.
Fleet management integration facilitates data-driven maintenance strategies, minimizing total cost of ownership. Usage-based insurance integration offers customized insurance coverage, aligning premiums with actual usage. Telematics data analytics insights provide valuable information for fleet optimization, including vehicle performance, driver behavior, and fuel consumption trends. Connected vehicle security protocols ensure data privacy and protection. Over-the-air software updates maintain vehicle functionality and enhance features. Real-time vehicle health data acquisition enables proactive maintenance, minimizing downtime and repair costs. Connected truck platforms offer a range of features, including service level agreement management, remote diagnostics system deployment, and connected vehicle security protocols. By leveraging these advanced technologies, businesses can optimize their truck fleets, reduce costs, and improve overall performance.
What are the key market drivers leading to the rise in the adoption of Truck-As-A-Service Industry?
- The digital transformation in the trucking industry is a primary catalyst for market growth. This evolution encompasses the integration of advanced technologies such as telematics, automation, and the Internet of Things (IoT), leading to enhanced operational efficiency, productivity, and customer satisfaction. The global trucking industry is experiencing a significant digital transformation, with original equipment manufacturers (OEMs) and technology suppliers adapting their business strategies to meet the increasing demands for efficiency and cost reduction among fleet operators. Telematics services integrated into trucks provide real-time data on vehicle condition, traffic, loading capacity, and cargo status.
- According to recent reports, the market is expected to grow by over 15% in the next five years, indicating a robust industry growth trajectory. For instance, a leading trucking company reported a 10% increase in sales after implementing telematics services in their fleet. This shift from truck-as-product to truck-as-a-service models has led to the adoption of connected truck-enabled services and platform-based production. Major truck OEMs, including Daimler, Volvo, Ford Motor, and Ashok Leyland, are embracing technologies like telematics and autonomous trucking to enhance their offerings.
What are the market trends shaping the Truck-As-A-Service Industry?
- The adoption of blockchain technology is becoming a prominent trend in the trucking industry. Blockchain's implementation is mandated in the trucking sector for enhancing transparency and security. The market is witnessing significant growth due to the integration of transformative technologies, particularly blockchain. This technology's adoption is revolutionizing the industry by enhancing transparency, security, and operational efficiency in freight and logistics operations. Blockchain's secure, immutable data sharing among stakeholders streamlines freight transactions, optimizes asset utilization, and supports predictive analytics for volume forecasting.
- These solutions offer scalable smart contracts, digital identity management, and secure documentation, reducing fraud and administrative overhead for enterprises lacking in-house technical expertise. The market is expected to experience robust growth, with industry experts projecting a substantial percentage increase in the coming years. Real-time tracking and fleet management improvements are also facilitated, resulting in a 15% increase in efficiency for early adopters. Tech giants like IBM, Microsoft, and Amazon are accelerating adoption through their Blockchain-as-a-Service (BaaS) platforms.
What challenges does the Truck-As-A-Service Industry face during its growth?
- A critical shortage of qualified drivers is significantly impeding growth in the trucking industry. The trucking industry in various regions faces a significant labor shortage, with the retirement of a large workforce and a reluctance among potential workers due to factors such as low wages, long working hours, and poor work-life balance. In the US, the industry is estimated to be short over 160,000 drivers, despite the demand continuing to grow. According to industry reports, the average annual salary for truck drivers in the US is approximately USD 48,710, or USD 23.42 per hour. In contrast, in countries like India, truck drivers earn between USD 310 and USD 480 per month, while taxi drivers make around USD 3,400 per year.
- These wage disparities, coupled with the demanding nature of the job, including extended periods away from home and up to 70 hours of work per week, make the profession less attractive. The global trucking market is expected to grow by over 5% annually, presenting opportunities for innovative solutions to address the labor shortage, such as automation and alternative work arrangements. For instance, a logistics company in Europe implemented a flexible work schedule for its drivers, which resulted in a 15% increase in retention.
Exclusive Customer Landscape
The truck-as-a-service market forecasting report includes the adoption lifecycle of the market, covering from the innovator's stage to the laggard's stage. It focuses on adoption rates in different regions based on penetration. Furthermore, the truck-as-a-service market report also includes key purchase criteria and drivers of price sensitivity to help companies evaluate and develop their market growth analysis strategies.
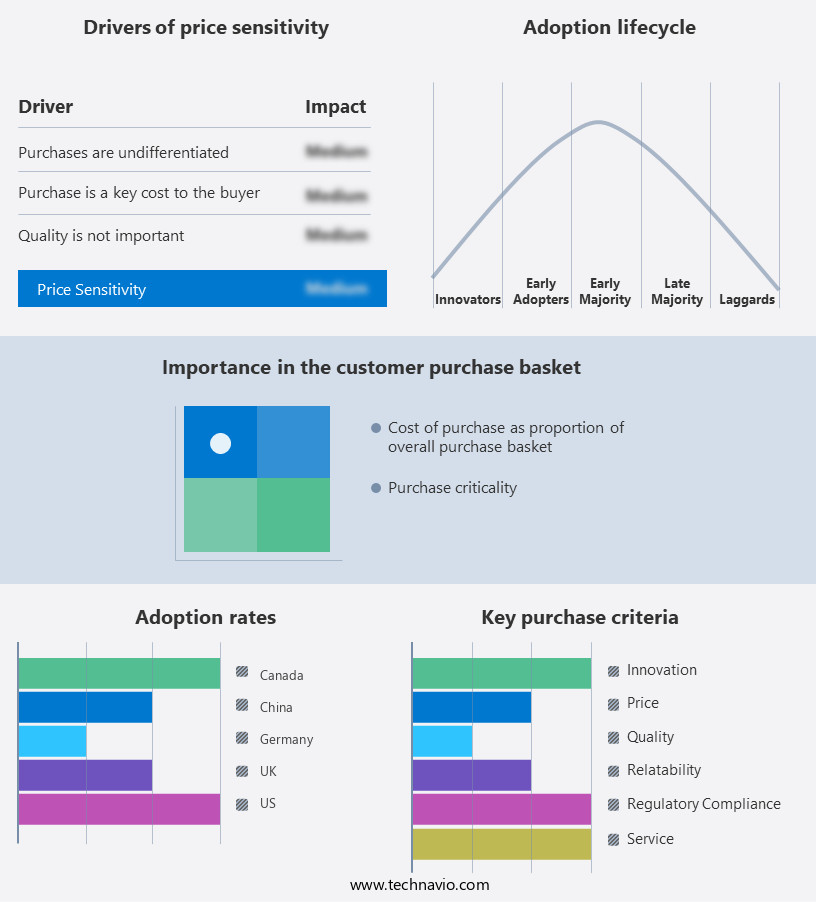
Customer Landscape
Key Companies & Market Insights
Companies are implementing various strategies, such as strategic alliances, truck-as-a-service market forecast, partnerships, mergers and acquisitions, geographical expansion, and product/service launches, to enhance their presence in the industry.
AB Volvo - The company revolutionizes commercial transportation through innovative truck-as-a-service solutions.
The industry research and growth report includes detailed analyses of the competitive landscape of the market and information about key companies, including:
- AB Volvo
- Ashok Leyland Ltd.
- Continental AG
- Einride AB
- Fleet Advantage LLC
- Fleet Complete
- Ford Motor Co.
- Hino Motors Ltd.
- Inseego Corp.
- Mercedes Benz Group AG
- Microlise Group Plc
- PACCAR Inc.
- Robert Bosch GmbH
- Tata Motors Ltd.
- Total Transportation Services
- Trimble Inc.
- Uber Freight
- Volkswagen AG
- Werner Enterprises Inc.
Qualitative and quantitative analysis of companies has been conducted to help clients understand the wider business environment as well as the strengths and weaknesses of key industry players. Data is qualitatively analyzed to categorize companies as pure play, category-focused, industry-focused, and diversified; it is quantitatively analyzed to categorize companies as dominant, leading, strong, tentative, and weak.
Recent Development and News in Truck-As-A-Service Market
- In January 2024, Volvo Group and Uber announced a strategic partnership to jointly develop and scale Volvo's electric trucks for Uber's Freight network, marking a significant step in the market towards electrification and ride-hailing integration (Volvo Group Press Release).
- In March 2024, Daimler Trucks and Torc Robotics, a leading autonomous driving technology company, announced a collaboration to develop and commercialize autonomous trucks, further pushing the boundaries of automation in the market (Daimler Trucks Press Release).
- In April 2025, Navistar International Corporation completed the acquisition of Preferred Commercial Services, a leading provider of aftermarket parts and services, for approximately USD 1.2 billion. This acquisition aimed to strengthen Navistar's position in the market by expanding its after-sales support capabilities (Navistar International Corporation SEC Filing).
- In May 2025, the European Union passed the Alternative Fuels Infrastructure Regulation, mandating the installation of alternative fuel infrastructure, including hydrogen and electric charging stations, at a rate of at least 1,000 per member state by 2025. This regulation is expected to fuel the growth of the market in Europe, as electric and hydrogen trucks become more viable alternatives to traditional diesel trucks (European Parliament Press Release).
Research Analyst Overview
- The market for truck-as-a-service continues to evolve, with applications spanning various sectors, including logistics, construction, and transportation. Idle time reduction through fleet lifecycle management and integrated logistics solutions is a significant focus, as is fuel consumption analysis and equipment utilization. Regulatory compliance and preventive maintenance programs are essential for ensuring operational availability and reducing downtime. The asset tracking system enables real-time vehicle health monitoring, while usage-based pricing and customer support portals offer flexibility and convenience. Industry growth is expected to reach 5% annually, with digital twin technology, onboard diagnostics, and remote software updates driving innovation.
- For instance, a leading logistics company reported a 15% decrease in operational downtime by implementing a service scheduling app and a preventive maintenance program. Network planning, secure data transmission, maintenance history tracking, and driver performance scorecards are also crucial components of this dynamic market. Remote maintenance portals, supply chain management, and real-time vehicle health monitoring further enhance efficiency and productivity.
Dive into Technavio's robust research methodology, blending expert interviews, extensive data synthesis, and validated models for unparalleled Truck-As-A-Service Market insights. See full methodology.
|
Market Scope |
|
|
Report Coverage |
Details |
|
Page number |
224 |
|
Base year |
2024 |
|
Historic period |
2019-2023 |
|
Forecast period |
2025-2029 |
|
Growth momentum & CAGR |
Accelerate at a CAGR of 4.8% |
|
Market growth 2025-2029 |
USD 19.41 billion |
|
Market structure |
Fragmented |
|
YoY growth 2024-2025(%) |
4.5 |
|
Key countries |
US, China, Germany, UK, Canada, Japan, India, France, Italy, and Mexico |
|
Competitive landscape |
Leading Companies, Market Positioning of Companies, Competitive Strategies, and Industry Risks |
What are the Key Data Covered in this Truck-As-A-Service Market Research and Growth Report?
- CAGR of the Truck-As-A-Service industry during the forecast period
- Detailed information on factors that will drive the growth and forecasting between 2025 and 2029
- Precise estimation of the size of the market and its contribution of the industry in focus to the parent market
- Accurate predictions about upcoming growth and trends and changes in consumer behaviour
- Growth of the market across North America, Europe, APAC, Middle East and Africa, and South America
- Thorough analysis of the market's competitive landscape and detailed information about companies
- Comprehensive analysis of factors that will challenge the truck-as-a-service market growth of industry companies
We can help! Our analysts can customize this truck-as-a-service market research report to meet your requirements.
 RIA -
RIA - 
