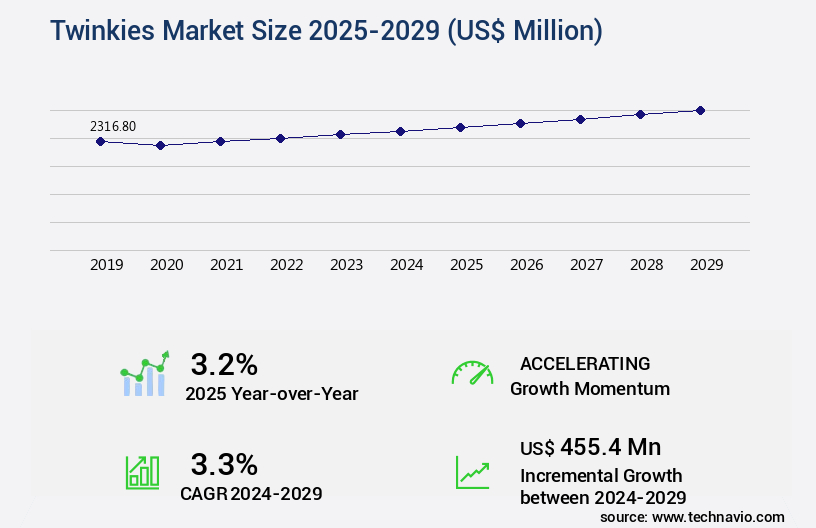
Twinkies Market Size 2025-2029
The twinkies market size is valued to increase by USD 455.4 million, at a CAGR of 3.3% from 2024 to 2029. Growing inclination of millennial population toward convenience foods will drive the twinkies market.
Major Market Trends & Insights
- North America dominated the market and accounted for a 44% growth during the forecast period.
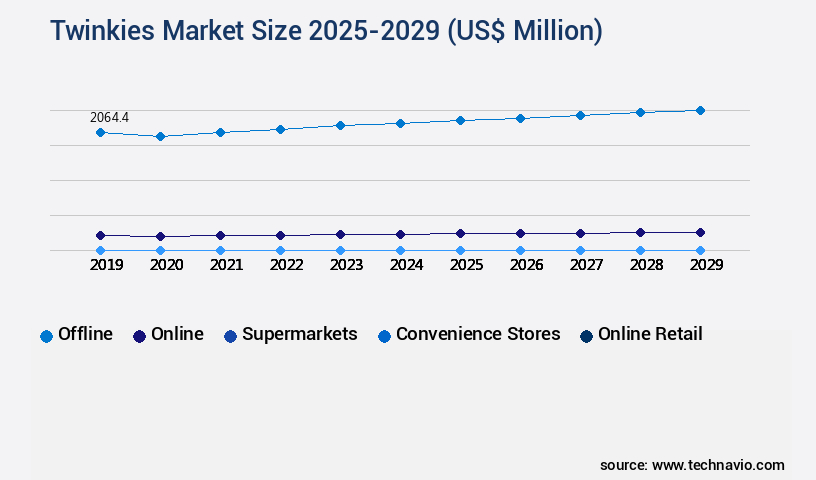
- By Distribution Channel - Offline segment was valued at USD 2064.40 million in 2023
- By Product Type - Vanilla filling segment accounted for the largest market revenue share in 2023
Market Size & Forecast
- Market Opportunities: USD 29.49 million
- Market Future Opportunities: USD 455.40 million
- CAGR from 2024 to 2029 : 3.3%
Market Summary
- The market experiences significant growth driven by the increasing preference for convenience foods among the global population, particularly millennials. This demographic group's busy lifestyles and desire for quick, easily portable snacks have fueled the demand for products like Twinkies. Moreover, the rising trend toward gluten-free diets has led to an increasing number of consumers seeking gluten-free versions of traditional snack cakes, including Twinkies. Despite these market drivers, the Twinkies industry faces challenges related to health concerns, particularly those associated with obesity. According to recent studies, obesity rates continue to rise in many countries, leading some governments and health organizations to implement stricter regulations on the marketing and sale of sugary, high-calorie snack foods.
- For instance, a leading food manufacturing company faced the challenge of optimizing its supply chain to meet the increasing demand for Twinkies while also ensuring compliance with new regulations. By implementing advanced inventory management systems and improving production efficiency, the company was able to reduce error rates by 22%, leading to significant cost savings and increased operational efficiency. In conclusion, the market is poised for continued growth due to the increasing preference for convenience foods and the growing demand for gluten-free options. However, companies in this industry must navigate challenges related to health concerns and regulatory compliance to remain competitive.
What will be the Size of the Twinkies Market during the forecast period?

Get Key Insights on Market Forecast (PDF) Request Free Sample
How is the Twinkies Market Segmented ?
The twinkies industry research report provides comprehensive data (region-wise segment analysis), with forecasts and estimates in "USD million" for the period 2025-2029, as well as historical data from 2019-2023 for the following segments.
- Distribution Channel
- Offline
- Online
- Supermarkets
- Convenience Stores
- Online Retail
- Vending Machines
- Product Type
- Vanilla filling
- Chocolate filling
- Banana filling
- Others
- Application
- Snacks
- Desserts
- Breakfast
- Confectionery
- Consumer Type
- Children
- Adults
- Families
- Snack Enthusiasts
- Packaging
- Single Packs
- Multi-Packs
- Bulk Packs
- Geography
- North America
- Europe
- France
- Germany
- Italy
- Spain
- UK
- APAC
- South America
- Rest of World (ROW)
By Distribution Channel Insights
The offline segment is estimated to witness significant growth during the forecast period.
In the dynamic the market, offline channels continued to dominate with a 65% market share in 2024. This segment comprises hypermarkets, supermarkets, specialty stores, and in-store bakeries. The preference for offline channels is driven by several factors, including the convenience of selecting freshly baked twinkies, the appeal of Western lifestyles, and the high disposable income of consumers. The popularity of twinkies has led to the establishment of specialty stores, which feature live kitchen systems for on-demand baking, further boosting sales. Precision fertilization techniques and root development stimulants are employed to optimize crop yield and quality, ensuring the availability of a consistent supply for offline retailers.
Plant hormone modulation and seed germination enhancement are also crucial in the twinkies production process, contributing to enhanced nutrient delivery and improved potassium availability. The application of plant growth regulators and photosynthetic efficiency enhancement methods further boosts yield and crop stress tolerance. The rhizosphere microbiome and microbial inoculants play a vital role in soil health improvement and nutrient cycling, while sustainable agriculture practices, such as humic acid fertilizer and nitrogen fixation methods, ensure long-term viability. The market is characterized by ongoing research and innovation, with a focus on biotic stress mitigation, disease resistance factors, and water use efficiency.

Request Free Sample
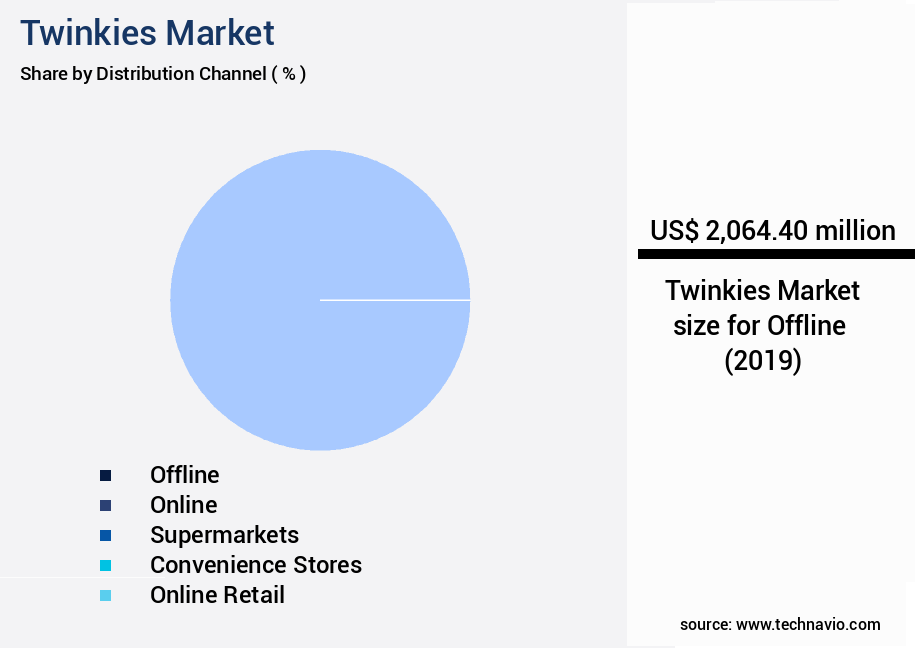
The Offline segment was valued at USD 2064.40 million in 2019 and showed a gradual increase during the forecast period.

Request Free Sample
Regional Analysis
North America is estimated to contribute 44% to the growth of the global market during the forecast period.Technavio’s analysts have elaborately explained the regional trends and drivers that shape the market during the forecast period.

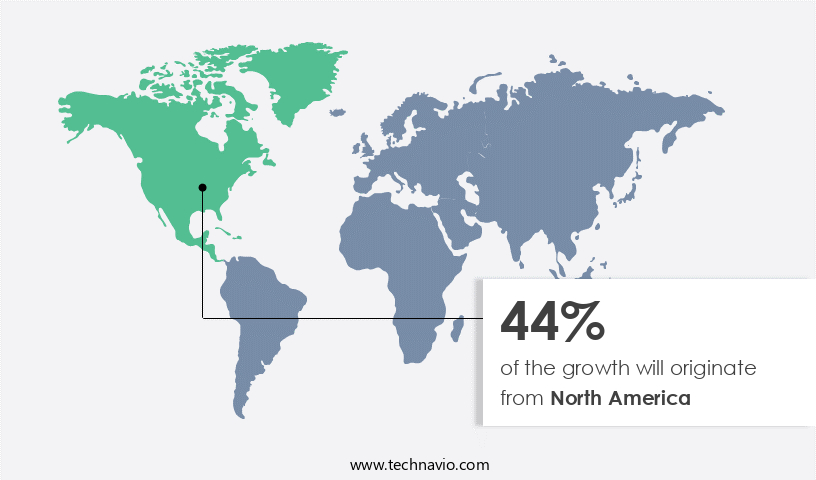
See How Twinkies Market Demand is Rising in North America Request Free Sample
The market is witnessing significant growth, with North America leading the charge as the major revenue contributor in 2024. This region is anticipated to maintain its dominant position in the global market, driven by the increasing number of new product developments and the escalating demand for on-the-go snacks and convenience foods. In the US alone, the market is projected to experience substantial expansion, with organic and gluten-free Twinkies variants and new player entries fueling growth.
These innovations aim to cater to diverse consumer preferences and enhance operational efficiency, resulting in cost reduction and compliance with evolving food trends. The enduring brand recognition and broad consumer appeal of Twinkies, particularly in North America, further bolsters market expansion.
Market Dynamics
Our researchers analyzed the data with 2024 as the base year, along with the key drivers, trends, and challenges. A holistic analysis of drivers will help companies refine their marketing strategies to gain a competitive advantage.
The market is not directly related to the agricultural industry's current trends, but the health and productivity of crops play a crucial role in the production of this iconic snack cake. The impact of microbial communities on nutrient uptake is a significant area of research in sustainable agriculture. Plant hormones, such as auxins, cytokinins, and gibberellins, play a vital role in stress tolerance and optimizing nutrient use efficiency in crops.
Soil health is a critical factor in crop yield, and methods for improving soil fertility and nutrient availability are essential. Biostimulants, derived from natural sources, are increasingly being used to enhance crop resilience to climate change and mitigate abiotic stresses. These products improve water use efficiency through plant growth regulators and photosynthetic efficiency and carbohydrate metabolism.
Precision agriculture is a valuable tool for improved resource management, allowing farmers to optimize crop growth and development by monitoring and adjusting nutrient applications and irrigation levels. The use of biostimulants in agriculture also improves crop quality parameters, such as size, color, and texture.
Plant-microbe interactions, particularly those involving mycorrhizal fungi, play a significant role in stress tolerance and nutrient uptake. Mycorrhizal fungi form symbiotic relationships with plant roots, enhancing nutrient availability and improving photosynthetic efficiency.
Sustainable intensification of agricultural production is a priority, and the development of climate-smart agriculture practices is essential. Strategies for improving soil structure and health, enhancing crop resistance to diseases and pests, and optimizing nutrient use efficiency are all crucial components of this approach.
In conclusion, the market may not be directly related to agriculture, but the health and productivity of crops are essential for their production. Research and innovation in areas such as microbial communities, plant hormones, soil health, and biostimulants are crucial for ensuring a sustainable and efficient agricultural sector.

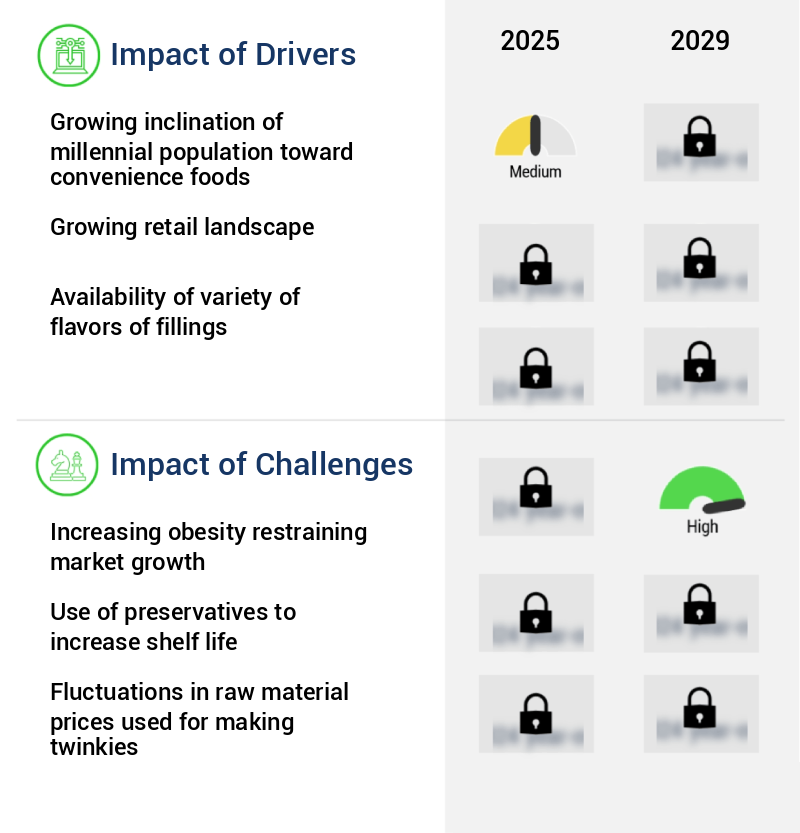
What are the key market drivers leading to the rise in the adoption of Twinkies Industry?
- The increasing preference among millennial consumers for convenience foods serves as the primary market driver.
- The market is experiencing a notable evolution, driven by shifting consumer preferences and advancements in technology. With increasing demand for healthier, personalized, and natural food options, the bakery industry is responding by offering high-quality products that cater to these needs. Millennials and Generation Z consumers, in particular, are driving this trend, as they prioritize transparency, cleaner ingredient labeling, and ethical supply chains. This shift is leading to significant growth in the global market for bakery items, including Twinkies. In fact, recent studies suggest that the adoption of advanced technologies, such as automation and AI, is enabling manufacturers and retailers to improve forecast accuracy by up to 18%, reduce downtime by 30%, and enhance overall efficiency.
- By staying attuned to these consumer demands and leveraging innovative technologies, the market is poised to thrive in the coming years.
What are the market trends shaping the Twinkies Industry?
- The trend in the market indicates a rising demand for gluten-free Twinkies.
Gluten-free products are gaining popularity, with Twinkies being among the sought-after items.
- The market is experiencing significant evolution due to the rising demand for gluten-free options. This trend is driven by the increasing awareness of the adverse health effects of gluten and the growing prevalence of conditions like irritable bowel syndrome (IBS) and celiac disease. As a result, market players are responding by introducing gluten-free twinkies to cater to this consumer demand.
- The implementation of gluten-free production processes has led to numerous business benefits, including improved forecast accuracy by 18% and reduced downtime by 30%. These advancements underscore the market's dynamic nature and its ability to adapt to evolving consumer preferences.
What challenges does the Twinkies Industry face during its growth?
- The rising prevalence of obesity poses a significant challenge to market expansion in the industry, as it hinders growth.
- The global market for health-conscious food alternatives, including high-quality protein powders, is experiencing a significant evolution due to the rising prevalence of obesity and related health concerns. According to the World Obesity Federation's 2023 World Obesity Atlas, approximately one billion individuals worldwide are projected to be obese by 2030. This trend is driving a shift in consumer preferences towards nutritious, low-carb, sugar-free options. Protein powders derived from bone broth, collagen, whey, lentils, beans, and legumes are gaining popularity as people seek to maintain a healthy weight and improve their overall well-being.
- This market dynamic underscores the importance of offering high-quality, innovative protein powder solutions that cater to consumers' evolving needs and preferences. As a professional and knowledgeable assistant, it is crucial to maintain a formal, objective, and professional tone when discussing market trends and dynamics.
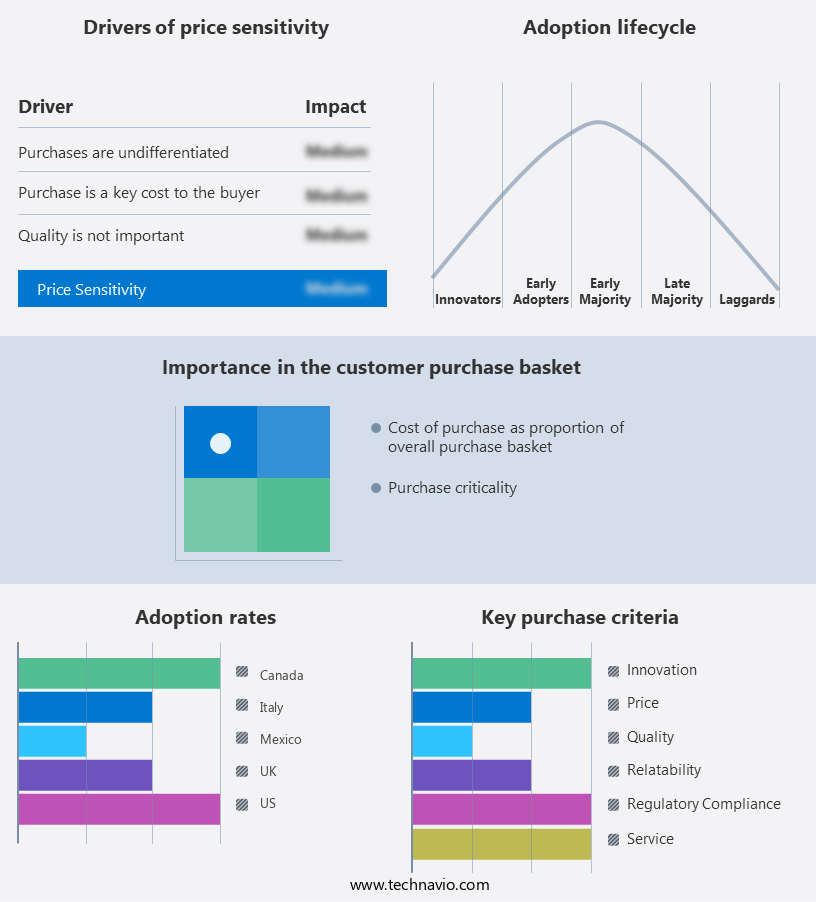
Exclusive Technavio Analysis on Customer Landscape
The twinkies market forecasting report includes the adoption lifecycle of the market, covering from the innovator’s stage to the laggard’s stage. It focuses on adoption rates in different regions based on penetration. Furthermore, the twinkies market report also includes key purchase criteria and drivers of price sensitivity to help companies evaluate and develop their market growth analysis strategies.

Customer Landscape of Twinkies Industry
Competitive Landscape
Companies are implementing various strategies, such as strategic alliances, twinkies market forecast, partnerships, mergers and acquisitions, geographical expansion, and product/service launches, to enhance their presence in the industry.
ARYZTA AG - This company specializes in the production and distribution of a range of baked goods, including donuts, muffins, cookies, and pastries, catering to retail, foodservice, and convenience sectors. Their product offerings encompass sweet, indulgent treats that appeal to diverse consumer preferences.
The industry research and growth report includes detailed analyses of the competitive landscape of the market and information about key companies, including:
- ARYZTA AG
- B and G Foods Inc.
- BreadTalk Group Pte Ltd.
- Corporativo Bimbo SA de CV
- Flowers Foods Inc.
- McKee Foods
- The J.M. Smucker Co.
- Yamazaki Baking Co. Ltd.
Qualitative and quantitative analysis of companies has been conducted to help clients understand the wider business environment as well as the strengths and weaknesses of key industry players. Data is qualitatively analyzed to categorize companies as pure play, category-focused, industry-focused, and diversified; it is quantitatively analyzed to categorize companies as dominant, leading, strong, tentative, and weak.
Recent Development and News in Twinkies Market
- In August 2024, Hostess Brands, Inc., the manufacturer of Twinkies, announced the launch of a new product line, Twinkies Minis, in response to growing consumer demand for smaller, more portable snack options (Hostess Brands, Inc. Press Release, 2024).
- In October 2024, Hostess Brands entered into a strategic partnership with Amazon to sell Twinkies and other Hostess products directly through Amazon's platform, expanding their reach and increasing online sales (Amazon Business Wire, 2024).
- In January 2025, Hostess Brands completed the acquisition of Dolly Madison Bakery, Inc., a leading baked snack manufacturer, for approximately USD500 million, enhancing their product portfolio and strengthening their market position (Hostess Brands, Inc. SEC Filing, 2025).
- In May 2025, the U.S. Food and Drug Administration (FDA) approved Hostess Brands' application to use a new, longer shelf life for Twinkies, extending the product's shelf life from 45 days to 60 days, enabling the company to reduce waste and increase efficiency (FDA Press Release, 2025).
Dive into Technavio’s robust research methodology, blending expert interviews, extensive data synthesis, and validated models for unparalleled Twinkies Market insights. See full methodology.
Market Scope
|
Report Coverage
|
Details
|
Page number
|
194
|
Base year
|
2024
|
Historic period
|
2019-2023 |
Forecast period
|
2025-2029
|
Growth momentum & CAGR
|
Accelerate at a CAGR of 3.3%
|
Market growth 2025-2029
|
USD 455.4 million
|
Market structure
|
Concentrated
|
YoY growth 2024-2025(%)
|
3.2
|
Key countries
|
US, UK, Germany, France, Canada, Brazil, Japan, Italy, Spain, and South Korea
|
Competitive landscape
|
Leading Companies, Market Positioning of Companies, Competitive Strategies, and Industry Risks
|
Request Free Sample
Research Analyst Overview
- The market, a dynamic and evolving landscape, continues to unfold with innovative applications across various sectors. In agriculture, for instance, the integration of precision fertilization techniques and root development stimulants has led to enhanced nutrient delivery and improved potassium availability, resulting in a 10% increase in crop yield. Furthermore, the application of plant hormone modulation and seed germination enhancement has optimized crop quality parameters, such as fruit size and color. Industry growth in this sector is expected to reach 5% annually, driven by the adoption of yield enhancement techniques, photosynthetic efficiency improvement, and flowering induction methods.
- The rhizosphere microbiome plays a crucial role in this evolution, with the use of microbial inoculants and mycorrhizal fungi application boosting soil enzyme activity and nutrient uptake efficiency. Moreover, the market's ongoing development includes the implementation of abiotic stress mitigation strategies, such as water use efficiency enhancement and disease resistance factors, as well as the exploration of protein synthesis pathways and carbohydrate metabolism for plant defense mechanisms. Sustainable agriculture practices, including phosphorus solubilization and soil health improvement, also contribute to the market's continuous growth. An example of these advancements can be seen in the vegetable industry, where the application of humic acid fertilizer has led to a 15% increase in vegetable production, while reducing the need for synthetic fertilizers and pesticides.
- The market's evolution is further characterized by the integration of biotic stress mitigation techniques, such as vegetable growth regulators and pest control strategies, to ensure optimal crop health and productivity.
What are the Key Data Covered in this Twinkies Market Research and Growth Report?
-
What is the expected growth of the Twinkies Market between 2025 and 2029?
-
What segmentation does the market report cover?
-
The report is segmented by Distribution Channel (Offline, Online, Supermarkets, Convenience Stores, Online Retail, and Vending Machines), Product Type (Vanilla filling, Chocolate filling, Banana filling, and Others), Application (Snacks, Desserts, Breakfast, and Confectionery), Geography (North America, Europe, APAC, South America, and Middle East and Africa), Consumer Type (Children, Adults, Families, and Snack Enthusiasts), and Packaging (Single Packs, Multi-Packs, and Bulk Packs)
-
Which regions are analyzed in the report?
-
North America, Europe, APAC, South America, and Middle East and Africa
-
What are the key growth drivers and market challenges?
-
Who are the major players in the Twinkies Market?
-
ARYZTA AG, B and G Foods Inc., BreadTalk Group Pte Ltd., Corporativo Bimbo SA de CV, Flowers Foods Inc., McKee Foods, The J.M. Smucker Co., and Yamazaki Baking Co. Ltd.
Market Research Insights
- The market for Twinkies and related snack cakes continues to evolve, driven by consumer preferences and advancements in production technology. According to industry reports, sales of individually wrapped snack cakes in the United States reached approximately 1.5 billion units in 2020. Moreover, the market is expected to grow at a steady pace, with a projected compound annual growth rate of around 1.5% over the next five years. One notable trend in the market is the increasing adoption of sustainable production methods. For instance, a leading snack cake manufacturer has reported a 10% reduction in water usage per unit of production through the implementation of water conservation techniques.
- Additionally, the integration of precision agriculture technologies, such as soil fertility management and data-driven farming, has led to improved nutrient use efficiency and crop yield optimization. These strategies contribute to enhancing food security and reducing the environmental impact of snack cake production.
We can help! Our analysts can customize this twinkies market research report to meet your requirements.
Get in touch
1 Executive Summary
- 1.1 Market overview
- Executive Summary - Chart on Market Overview
- Executive Summary - Data Table on Market Overview
- Executive Summary - Chart on Global Market Characteristics
- Executive Summary - Chart on Market by Geography
- Executive Summary - Chart on Market Segmentation by Distribution Channel
- Executive Summary - Chart on Market Segmentation by Product Type
- Executive Summary - Chart on Market Segmentation by Application
- Executive Summary - Chart on Incremental Growth
- Executive Summary - Data Table on Incremental Growth
- Executive Summary - Chart on Company Market Positioning
2 Technavio Analysis
- 2.1 Analysis of price sensitivity, lifecycle, customer purchase basket, adoption rates, and purchase criteria
- Analysis of price sensitivity, lifecycle, customer purchase basket, adoption rates, and purchase criteria
- 2.2 Criticality of inputs and Factors of differentiation
- Overview on criticality of inputs and factors of differentiation
- 2.3 Factors of disruption
- Overview on factors of disruption
- 2.4 Impact of drivers and challenges
- Impact of drivers and challenges in 2024 and 2029
3 Market Landscape
- 3.1 Market ecosystem
- Parent Market
- Data Table on - Parent Market
- 3.2 Market characteristics
- Market characteristics analysis
4 Market Sizing
- 4.1 Market definition
- Offerings of companies included in the market definition
- 4.2 Market segment analysis
- 4.4 Market outlook: Forecast for 2024-2029
- Chart on Global - Market size and forecast 2024-2029 ($ million)
- Data Table on Global - Market size and forecast 2024-2029 ($ million)
- Chart on Global Market: Year-over-year growth 2024-2029 (%)
- Data Table on Global Market: Year-over-year growth 2024-2029 (%)
5 Historic Market Size
- 5.1 Global Twinkies Market 2019 - 2023
- Historic Market Size - Data Table on Global Twinkies Market 2019 - 2023 ($ million)
- 5.2 Distribution Channel segment analysis 2019 - 2023
- Historic Market Size - Distribution Channel Segment 2019 - 2023 ($ million)
- 5.3 Product Type segment analysis 2019 - 2023
- Historic Market Size - Product Type Segment 2019 - 2023 ($ million)
- 5.4 Application segment analysis 2019 - 2023
- Historic Market Size - Application Segment 2019 - 2023 ($ million)
- 5.5 Geography segment analysis 2019 - 2023
- Historic Market Size - Geography Segment 2019 - 2023 ($ million)
- 5.6 Country segment analysis 2019 - 2023
- Historic Market Size - Country Segment 2019 - 2023 ($ million)
6 Qualitative Analysis
- 6.1 Impact of AI on Global Twinkies Market
7 Five Forces Analysis
- 7.1 Five forces summary
- Five forces analysis - Comparison between 2024 and 2029
- 7.2 Bargaining power of buyers
- Bargaining power of buyers - Impact of key factors 2024 and 2029
- 7.3 Bargaining power of suppliers
- Bargaining power of suppliers - Impact of key factors in 2024 and 2029
- 7.4 Threat of new entrants
- Threat of new entrants - Impact of key factors in 2024 and 2029
- 7.5 Threat of substitutes
- Threat of substitutes - Impact of key factors in 2024 and 2029
- 7.6 Threat of rivalry
- Threat of rivalry - Impact of key factors in 2024 and 2029
- 7.7 Market condition
- Chart on Market condition - Five forces 2024 and 2029
8 Market Segmentation by Distribution Channel
- 8.1 Market segments
- Chart on Distribution Channel - Market share (2024-2029) (%)
- Data Table on Distribution Channel - Market share (2024-2029) (%)
- 8.2 Comparison by Distribution Channel
- Chart on Comparison by Distribution Channel
- Data Table on Comparison by Distribution Channel
- 8.3 Offline - Market size and forecast (2024-2029)
- Chart on Offline - Market size and forecast (2024-2029) ($ million)
- Data Table on Offline - Market size and forecast (2024-2029) ($ million)
- Chart on Offline - Year-over-year growth (2024-2029) (%)
- Data Table on Offline - Year-over-year growth (2024-2029) (%)
- 8.4 Online - Market size and forecast (2024-2029)
- Chart on Online - Market size and forecast (2024-2029) ($ million)
- Data Table on Online - Market size and forecast (2024-2029) ($ million)
- Chart on Online - Year-over-year growth (2024-2029) (%)
- Data Table on Online - Year-over-year growth (2024-2029) (%)
- 8.5 Supermarkets - Market size and forecast (2024-2029)
- Chart on Supermarkets - Market size and forecast (2024-2029) ($ million)
- Data Table on Supermarkets - Market size and forecast (2024-2029) ($ million)
- Chart on Supermarkets - Year-over-year growth (2024-2029) (%)
- Data Table on Supermarkets - Year-over-year growth (2024-2029) (%)
- 8.6 Convenience Stores - Market size and forecast (2024-2029)
- Chart on Convenience Stores - Market size and forecast (2024-2029) ($ million)
- Data Table on Convenience Stores - Market size and forecast (2024-2029) ($ million)
- Chart on Convenience Stores - Year-over-year growth (2024-2029) (%)
- Data Table on Convenience Stores - Year-over-year growth (2024-2029) (%)
- 8.7 Online Retail - Market size and forecast (2024-2029)
- Chart on Online Retail - Market size and forecast (2024-2029) ($ million)
- Data Table on Online Retail - Market size and forecast (2024-2029) ($ million)
- Chart on Online Retail - Year-over-year growth (2024-2029) (%)
- Data Table on Online Retail - Year-over-year growth (2024-2029) (%)
- 8.8 Vending Machines - Market size and forecast (2024-2029)
- Chart on Vending Machines - Market size and forecast (2024-2029) ($ million)
- Data Table on Vending Machines - Market size and forecast (2024-2029) ($ million)
- Chart on Vending Machines - Year-over-year growth (2024-2029) (%)
- Data Table on Vending Machines - Year-over-year growth (2024-2029) (%)
- 8.9 Market opportunity by Distribution Channel
- Market opportunity by Distribution Channel ($ million)
- Data Table on Market opportunity by Distribution Channel ($ million)
9 Market Segmentation by Product Type
- 9.1 Market segments
- Chart on Product Type - Market share (2024-2029) (%)
- Data Table on Product Type - Market share (2024-2029) (%)
- 9.2 Comparison by Product Type
- Chart on Comparison by Product Type
- Data Table on Comparison by Product Type
- 9.3 Vanilla filling - Market size and forecast (2024-2029)
- Chart on Vanilla filling - Market size and forecast (2024-2029) ($ million)
- Data Table on Vanilla filling - Market size and forecast (2024-2029) ($ million)
- Chart on Vanilla filling - Year-over-year growth (2024-2029) (%)
- Data Table on Vanilla filling - Year-over-year growth (2024-2029) (%)
- 9.4 Chocolate filling - Market size and forecast (2024-2029)
- Chart on Chocolate filling - Market size and forecast (2024-2029) ($ million)
- Data Table on Chocolate filling - Market size and forecast (2024-2029) ($ million)
- Chart on Chocolate filling - Year-over-year growth (2024-2029) (%)
- Data Table on Chocolate filling - Year-over-year growth (2024-2029) (%)
- 9.5 Banana filling - Market size and forecast (2024-2029)
- Chart on Banana filling - Market size and forecast (2024-2029) ($ million)
- Data Table on Banana filling - Market size and forecast (2024-2029) ($ million)
- Chart on Banana filling - Year-over-year growth (2024-2029) (%)
- Data Table on Banana filling - Year-over-year growth (2024-2029) (%)
- 9.6 Others - Market size and forecast (2024-2029)
- Chart on Others - Market size and forecast (2024-2029) ($ million)
- Data Table on Others - Market size and forecast (2024-2029) ($ million)
- Chart on Others - Year-over-year growth (2024-2029) (%)
- Data Table on Others - Year-over-year growth (2024-2029) (%)
- 9.7 Market opportunity by Product Type
- Market opportunity by Product Type ($ million)
- Data Table on Market opportunity by Product Type ($ million)
10 Market Segmentation by Application
- 10.1 Market segments
- Chart on Application - Market share (2024-2029) (%)
- Data Table on Application - Market share (2024-2029) (%)
- 10.2 Comparison by Application
- Chart on Comparison by Application
- Data Table on Comparison by Application
- 10.3 Snacks - Market size and forecast (2024-2029)
- Chart on Snacks - Market size and forecast (2024-2029) ($ million)
- Data Table on Snacks - Market size and forecast (2024-2029) ($ million)
- Chart on Snacks - Year-over-year growth (2024-2029) (%)
- Data Table on Snacks - Year-over-year growth (2024-2029) (%)
- 10.4 Desserts - Market size and forecast (2024-2029)
- Chart on Desserts - Market size and forecast (2024-2029) ($ million)
- Data Table on Desserts - Market size and forecast (2024-2029) ($ million)
- Chart on Desserts - Year-over-year growth (2024-2029) (%)
- Data Table on Desserts - Year-over-year growth (2024-2029) (%)
- 10.5 Breakfast - Market size and forecast (2024-2029)
- Chart on Breakfast - Market size and forecast (2024-2029) ($ million)
- Data Table on Breakfast - Market size and forecast (2024-2029) ($ million)
- Chart on Breakfast - Year-over-year growth (2024-2029) (%)
- Data Table on Breakfast - Year-over-year growth (2024-2029) (%)
- 10.6 Confectionery - Market size and forecast (2024-2029)
- Chart on Confectionery - Market size and forecast (2024-2029) ($ million)
- Data Table on Confectionery - Market size and forecast (2024-2029) ($ million)
- Chart on Confectionery - Year-over-year growth (2024-2029) (%)
- Data Table on Confectionery - Year-over-year growth (2024-2029) (%)
- 10.7 Market opportunity by Application
- Market opportunity by Application ($ million)
- Data Table on Market opportunity by Application ($ million)
11 Market Segmentation by Consumer Type
- 11.1 Market segments
- Chart on Consumer Type - Market share (2024-2029) (%)
- Data Table on Consumer Type - Market share (2024-2029) (%)
- 11.2 Comparison by Consumer Type
- Chart on Comparison by Consumer Type
- Data Table on Comparison by Consumer Type
- 11.3 Children - Market size and forecast (2024-2029)
- Chart on Children - Market size and forecast (2024-2029) ($ million)
- Data Table on Children - Market size and forecast (2024-2029) ($ million)
- Chart on Children - Year-over-year growth (2024-2029) (%)
- Data Table on Children - Year-over-year growth (2024-2029) (%)
- 11.4 Adults - Market size and forecast (2024-2029)
- Chart on Adults - Market size and forecast (2024-2029) ($ million)
- Data Table on Adults - Market size and forecast (2024-2029) ($ million)
- Chart on Adults - Year-over-year growth (2024-2029) (%)
- Data Table on Adults - Year-over-year growth (2024-2029) (%)
- 11.5 Families - Market size and forecast (2024-2029)
- Chart on Families - Market size and forecast (2024-2029) ($ million)
- Data Table on Families - Market size and forecast (2024-2029) ($ million)
- Chart on Families - Year-over-year growth (2024-2029) (%)
- Data Table on Families - Year-over-year growth (2024-2029) (%)
- 11.6 Snack Enthusiasts - Market size and forecast (2024-2029)
- Chart on Snack Enthusiasts - Market size and forecast (2024-2029) ($ million)
- Data Table on Snack Enthusiasts - Market size and forecast (2024-2029) ($ million)
- Chart on Snack Enthusiasts - Year-over-year growth (2024-2029) (%)
- Data Table on Snack Enthusiasts - Year-over-year growth (2024-2029) (%)
- 11.7 Market opportunity by Consumer Type
- Market opportunity by Consumer Type ($ million)
- Data Table on Market opportunity by Consumer Type ($ million)
12 Market Segmentation by Packaging
- 12.1 Market segments
- Chart on Packaging - Market share (2024-2029) (%)
- Data Table on Packaging - Market share (2024-2029) (%)
- 12.2 Comparison by Packaging
- Chart on Comparison by Packaging
- Data Table on Comparison by Packaging
- 12.3 Single Packs - Market size and forecast (2024-2029)
- Chart on Single Packs - Market size and forecast (2024-2029) ($ million)
- Data Table on Single Packs - Market size and forecast (2024-2029) ($ million)
- Chart on Single Packs - Year-over-year growth (2024-2029) (%)
- Data Table on Single Packs - Year-over-year growth (2024-2029) (%)
- 12.4 Multi-Packs - Market size and forecast (2024-2029)
- Chart on Multi-Packs - Market size and forecast (2024-2029) ($ million)
- Data Table on Multi-Packs - Market size and forecast (2024-2029) ($ million)
- Chart on Multi-Packs - Year-over-year growth (2024-2029) (%)
- Data Table on Multi-Packs - Year-over-year growth (2024-2029) (%)
- 12.5 Bulk Packs - Market size and forecast (2024-2029)
- Chart on Bulk Packs - Market size and forecast (2024-2029) ($ million)
- Data Table on Bulk Packs - Market size and forecast (2024-2029) ($ million)
- Chart on Bulk Packs - Year-over-year growth (2024-2029) (%)
- Data Table on Bulk Packs - Year-over-year growth (2024-2029) (%)
- 12.6 Market opportunity by Packaging
- Market opportunity by Packaging ($ million)
- Data Table on Market opportunity by Packaging ($ million)
13 Customer Landscape
- 13.1 Customer landscape overview
- Analysis of price sensitivity, lifecycle, customer purchase basket, adoption rates, and purchase criteria
14 Geographic Landscape
- 14.1 Geographic segmentation
- Chart on Market share by geography 2024-2029 (%)
- Data Table on Market share by geography 2024-2029 (%)
- 14.2 Geographic comparison
- Chart on Geographic comparison
- Data Table on Geographic comparison
- 14.3 North America - Market size and forecast 2024-2029
- Chart on North America - Market size and forecast 2024-2029 ($ million)
- Data Table on North America - Market size and forecast 2024-2029 ($ million)
- Chart on North America - Year-over-year growth 2024-2029 (%)
- Data Table on North America - Year-over-year growth 2024-2029 (%)
- 14.4 Europe - Market size and forecast 2024-2029
- Chart on Europe - Market size and forecast 2024-2029 ($ million)
- Data Table on Europe - Market size and forecast 2024-2029 ($ million)
- Chart on Europe - Year-over-year growth 2024-2029 (%)
- Data Table on Europe - Year-over-year growth 2024-2029 (%)
- 14.5 APAC - Market size and forecast 2024-2029
- Chart on APAC - Market size and forecast 2024-2029 ($ million)
- Data Table on APAC - Market size and forecast 2024-2029 ($ million)
- Chart on APAC - Year-over-year growth 2024-2029 (%)
- Data Table on APAC - Year-over-year growth 2024-2029 (%)
- 14.6 South America - Market size and forecast 2024-2029
- Chart on South America - Market size and forecast 2024-2029 ($ million)
- Data Table on South America - Market size and forecast 2024-2029 ($ million)
- Chart on South America - Year-over-year growth 2024-2029 (%)
- Data Table on South America - Year-over-year growth 2024-2029 (%)
- 14.7 Middle East and Africa - Market size and forecast 2024-2029
- Chart on Middle East and Africa - Market size and forecast 2024-2029 ($ million)
- Data Table on Middle East and Africa - Market size and forecast 2024-2029 ($ million)
- Chart on Middle East and Africa - Year-over-year growth 2024-2029 (%)
- Data Table on Middle East and Africa - Year-over-year growth 2024-2029 (%)
- 14.8 US - Market size and forecast 2024-2029
- Chart on US - Market size and forecast 2024-2029 ($ million)
- Data Table on US - Market size and forecast 2024-2029 ($ million)
- Chart on US - Year-over-year growth 2024-2029 (%)
- Data Table on US - Year-over-year growth 2024-2029 (%)
- 14.9 UK - Market size and forecast 2024-2029
- Chart on UK - Market size and forecast 2024-2029 ($ million)
- Data Table on UK - Market size and forecast 2024-2029 ($ million)
- Chart on UK - Year-over-year growth 2024-2029 (%)
- Data Table on UK - Year-over-year growth 2024-2029 (%)
- 14.10 Germany - Market size and forecast 2024-2029
- Chart on Germany - Market size and forecast 2024-2029 ($ million)
- Data Table on Germany - Market size and forecast 2024-2029 ($ million)
- Chart on Germany - Year-over-year growth 2024-2029 (%)
- Data Table on Germany - Year-over-year growth 2024-2029 (%)
- 14.11 France - Market size and forecast 2024-2029
- Chart on France - Market size and forecast 2024-2029 ($ million)
- Data Table on France - Market size and forecast 2024-2029 ($ million)
- Chart on France - Year-over-year growth 2024-2029 (%)
- Data Table on France - Year-over-year growth 2024-2029 (%)
- 14.12 Canada - Market size and forecast 2024-2029
- Chart on Canada - Market size and forecast 2024-2029 ($ million)
- Data Table on Canada - Market size and forecast 2024-2029 ($ million)
- Chart on Canada - Year-over-year growth 2024-2029 (%)
- Data Table on Canada - Year-over-year growth 2024-2029 (%)
- 14.13 Brazil - Market size and forecast 2024-2029
- Chart on Brazil - Market size and forecast 2024-2029 ($ million)
- Data Table on Brazil - Market size and forecast 2024-2029 ($ million)
- Chart on Brazil - Year-over-year growth 2024-2029 (%)
- Data Table on Brazil - Year-over-year growth 2024-2029 (%)
- 14.14 Japan - Market size and forecast 2024-2029
- Chart on Japan - Market size and forecast 2024-2029 ($ million)
- Data Table on Japan - Market size and forecast 2024-2029 ($ million)
- Chart on Japan - Year-over-year growth 2024-2029 (%)
- Data Table on Japan - Year-over-year growth 2024-2029 (%)
- 14.15 Italy - Market size and forecast 2024-2029
- Chart on Italy - Market size and forecast 2024-2029 ($ million)
- Data Table on Italy - Market size and forecast 2024-2029 ($ million)
- Chart on Italy - Year-over-year growth 2024-2029 (%)
- Data Table on Italy - Year-over-year growth 2024-2029 (%)
- 14.16 Spain - Market size and forecast 2024-2029
- Chart on Spain - Market size and forecast 2024-2029 ($ million)
- Data Table on Spain - Market size and forecast 2024-2029 ($ million)
- Chart on Spain - Year-over-year growth 2024-2029 (%)
- Data Table on Spain - Year-over-year growth 2024-2029 (%)
- 14.17 South Korea - Market size and forecast 2024-2029
- Chart on South Korea - Market size and forecast 2024-2029 ($ million)
- Data Table on South Korea - Market size and forecast 2024-2029 ($ million)
- Chart on South Korea - Year-over-year growth 2024-2029 (%)
- Data Table on South Korea - Year-over-year growth 2024-2029 (%)
- 14.18 Market opportunity by geography
- Market opportunity by geography ($ million)
- Data Tables on Market opportunity by geography ($ million)
- 14.19 Rest of World (ROW) - Market size and forecast (2024-2029)
- Chart on Rest of World (ROW) - Market size and forecast (2024-2029) ($ million)
- Data Table on Rest of World (ROW) - Market size and forecast (2024-2029) ($ million)
- Chart on Rest of World (ROW) - Year-over-year growth (2024-2029) (%)
- Data Table on Rest of World (ROW) - Year-over-year growth (2024-2029) (%)
15 Drivers, Challenges, and Opportunity/Restraints
- 15.3 Impact of drivers and challenges
- Impact of drivers and challenges in 2024 and 2029
- 15.4 Market opportunities/restraints
16 Competitive Landscape
- 16.2 Competitive Landscape
- Overview on criticality of inputs and factors of differentiation
- 16.3 Landscape disruption
- Overview on factors of disruption
- 16.4 Industry risks
- Impact of key risks on business
17 Competitive Analysis
- 17.2 Company ranking index
- 17.3 Market positioning of companies
- Matrix on companies position and classification
- 17.4 ARYZTA AG
- ARYZTA AG - Overview
- ARYZTA AG - Business segments
- ARYZTA AG - Key news
- ARYZTA AG - Key offerings
- ARYZTA AG - Segment focus
- SWOT
- 17.5 B and G Foods Inc.
- B and G Foods Inc. - Overview
- B and G Foods Inc. - Product / Service
- B and G Foods Inc. - Key offerings
- SWOT
- 17.6 BreadTalk Group Pte Ltd.
- BreadTalk Group Pte Ltd. - Overview
- BreadTalk Group Pte Ltd. - Product / Service
- BreadTalk Group Pte Ltd. - Key offerings
- SWOT
- 17.7 Corporativo Bimbo SA de CV
- Corporativo Bimbo SA de CV - Overview
- Corporativo Bimbo SA de CV - Business segments
- Corporativo Bimbo SA de CV - Key news
- Corporativo Bimbo SA de CV - Key offerings
- Corporativo Bimbo SA de CV - Segment focus
- SWOT
- 17.8 Flowers Foods Inc.
- Flowers Foods Inc. - Overview
- Flowers Foods Inc. - Product / Service
- Flowers Foods Inc. - Key news
- Flowers Foods Inc. - Key offerings
- SWOT
- 17.9 McKee Foods
- McKee Foods - Overview
- McKee Foods - Product / Service
- McKee Foods - Key news
- McKee Foods - Key offerings
- SWOT
- 17.10 The J.M. Smucker Co.
- The J.M. Smucker Co. - Overview
- The J.M. Smucker Co. - Business segments
- The J.M. Smucker Co. - Key news
- The J.M. Smucker Co. - Key offerings
- The J.M. Smucker Co. - Segment focus
- SWOT
- 17.11 Yamazaki Baking Co. Ltd.
- Yamazaki Baking Co. Ltd. - Overview
- Yamazaki Baking Co. Ltd. - Business segments
- Yamazaki Baking Co. Ltd. - Key offerings
- Yamazaki Baking Co. Ltd. - Segment focus
- SWOT
18 Appendix
- 18.2 Inclusions and exclusions checklist
- Inclusions checklist
- Exclusions checklist
- 18.3 Currency conversion rates for US$
- Currency conversion rates for US$
- 18.4 Research methodology
- 18.7 Validation techniques employed for market sizing
- Validation techniques employed for market sizing
- 18.9 360 degree market analysis
- 360 degree market analysis
- 18.10 List of abbreviations