Type 2 Diabetes Market Analysis, Size, and Forecast 2026-2030: North America (US, Canada, and Mexico), Europe (Germany, France, and UK), APAC (China, India, and Japan), Middle East and Africa (Turkey, Saudi Arabia, and South Africa), South America (Brazil, Argentina, and Colombia), Asia, Rest of World (ROW)

Type 2 Diabetes Market Analysis, Size, and Forecast 2026-2030:
North America (US, Canada, and Mexico), Europe (Germany, France, and UK), APAC (China, India, and Japan), Middle East and Africa (Turkey, Saudi Arabia, and South Africa), South America (Brazil, Argentina, and Colombia), Asia, Rest of World (ROW)

Published: Mar 2026 303 Pages SKU: IRTNTR70605

Market Overview at a Glance

$59.90 B
Market Opportunity
12.2%
CAGR 2025 - 2030
35.9%
North America Growth
$22.22 B
Insulin segment 2024

Type 2 Diabetes Market Size 2026-2030

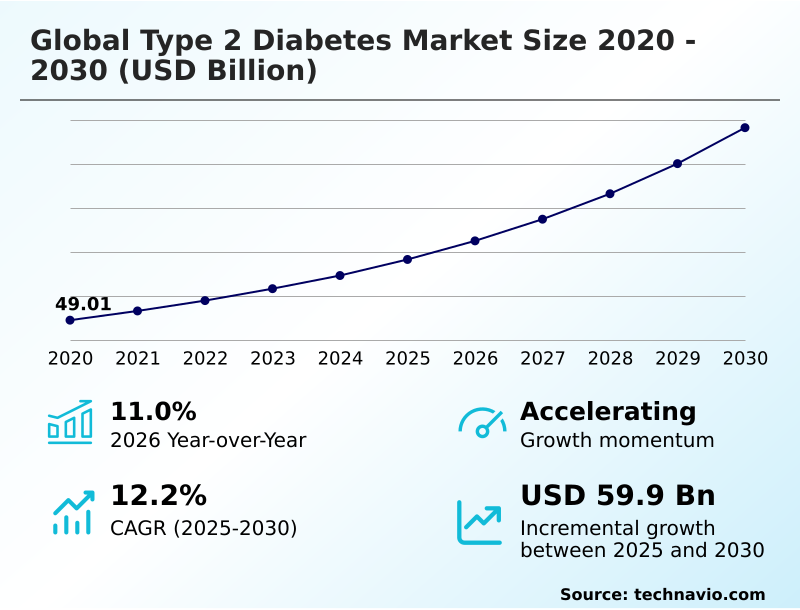
The type 2 diabetes market size is valued to increase by USD 59.90 billion, at a CAGR of 12.2% from 2025 to 2030. Integration of advanced medical devices and automated glycemic control will drive the type 2 diabetes market.

Major Market Trends & Insights

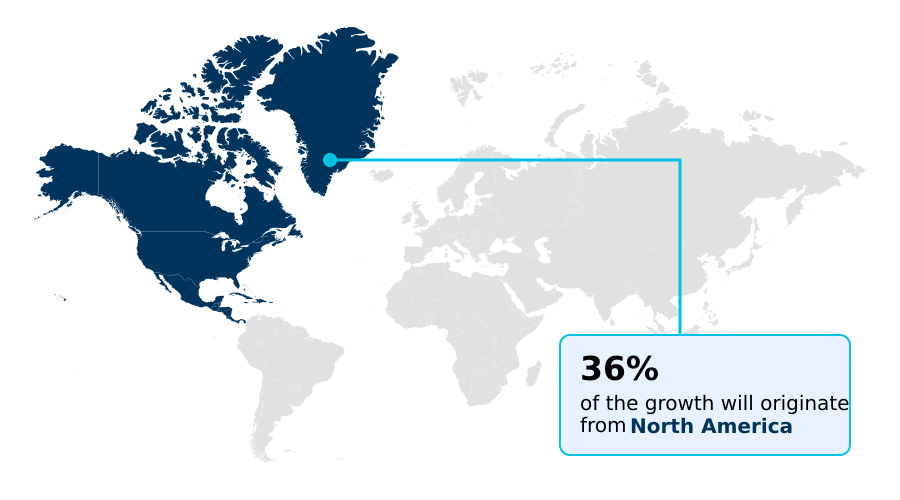
  • North America dominated the market and accounted for a 35.9% growth during the forecast period.
  • By Drug Class - Insulin segment was valued at USD 22.22 billion in 2024
  • By Distribution Channel - Retail pharmacies segment accounted for the largest market revenue share in 2024

Market Size & Forecast

  • Market Opportunities: USD 87.50 billion
  • Market Future Opportunities: USD 59.90 billion
  • CAGR from 2025 to 2030 : 12.2%

Market Summary

  • The type 2 diabetes market is defined by a persistent need for more effective therapies and management tools to address its growing prevalence. This complex metabolic disorder requires a multi-faceted approach, combining lifestyle adjustments with pharmacological intervention. Key market drivers include the rising rates of obesity and sedentary lifestyles, which are increasing the patient population globally.
  • In response, the industry is innovating rapidly, with a significant trend toward personalized medicine and the integration of digital health technologies. For instance, healthcare systems are now leveraging predictive analytics to identify high-risk patients, allowing for targeted interventions that optimize resource allocation and prevent costly complications. This proactive management strategy exemplifies the shift from reactive treatment to preventive care.
  • However, the high cost of novel therapies and challenges in patient adherence continue to shape the competitive landscape. As the market evolves, the focus remains on developing solutions that improve glycemic control while addressing related cardiovascular and renal comorbidities, ultimately enhancing the long-term quality of life for patients.

What will be the Size of the Type 2 Diabetes Market during the forecast period?

Get Key Insights on Market Forecast (PDF) Request Free Sample

How is the Type 2 Diabetes Market Segmented?

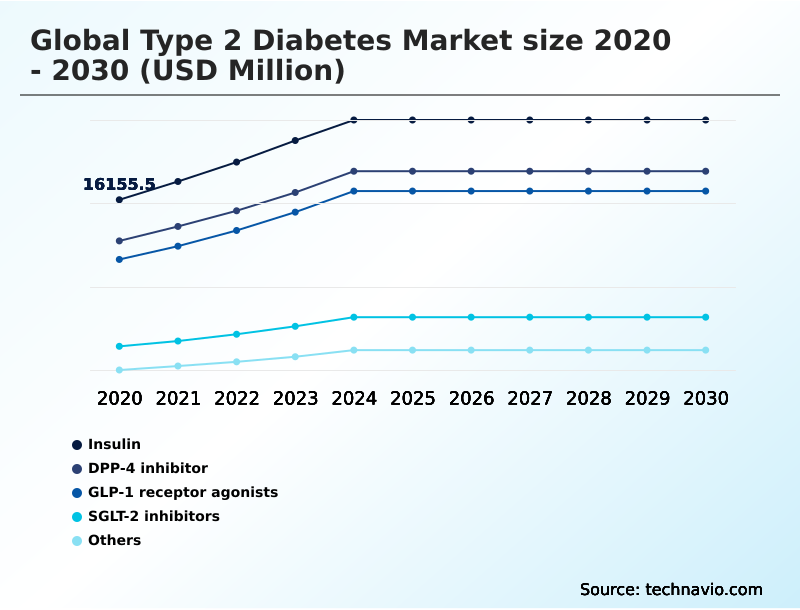
The type 2 diabetes industry research report provides comprehensive data (region-wise segment analysis), with forecasts and estimates in "USD million" for the period 2026-2030, as well as historical data from 2020-2024 for the following segments.

  • Drug class
    • Insulin
    • DPP-4 inhibitor
    • GLP-1 receptor agonists
    • SGLT-2 inhibitors
    • Others
  • Distribution channel
    • Retail pharmacies
    • Hospital pharmacies
    • Online pharmacies
  • Delivery mode
    • Oral
    • Injectable
    • Continuous glucose monitoring (CGM)
  • Geography
    • North America
      • US
      • Canada
      • Mexico
    • Europe
      • Germany
      • France
      • UK
    • Asia
    • Rest of World (ROW)

By Drug Class Insights

The insulin segment is estimated to witness significant growth during the forecast period.

The insulin segment remains a foundational component of pharmacological intervention, evolving with the introduction of patient-centric alternatives like biosimilar insulin aspart. Emphasis is on improving subcutaneous infusion methods and developing advanced basal insulin formulation options to enhance patient adherence solutions.

While traditional formulations are prevalent, the market is shifting toward integrated systems that combine insulin delivery with continuous glucose monitoring.

This technological fusion is central to value-based care models, as automated systems can reduce hypoglycemic events by up to 18%, significantly improving safety and long-term outcomes for individuals requiring intensive glycemic management.

Request Free Sample

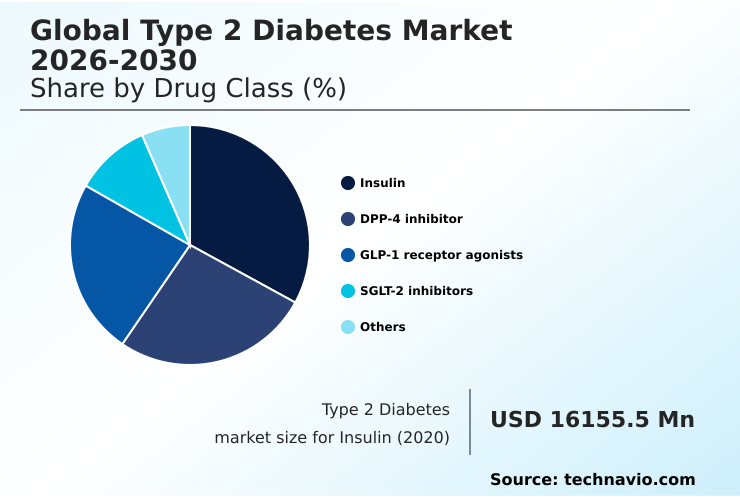
The Insulin segment was valued at USD 22.22 billion in 2024 and showed a gradual increase during the forecast period.

Request Free Sample

Regional Analysis

North America is estimated to contribute 35.9% to the growth of the global market during the forecast period.Technavio’s analysts have elaborately explained the regional trends and drivers that shape the market during the forecast period.

See How Type 2 Diabetes Market Demand is Rising in North America Request Free Sample

The global landscape for the type 2 diabetes market is characterized by distinct regional dynamics in metabolic disorder management.

North America, driven by high adoption of digital health platforms and preventive care models, commands the largest share, accounting for over 35% of incremental growth.

The region's advanced healthcare infrastructure supports the widespread use of sophisticated therapies like oral semaglutide formulation and drugs targeting the glucose-dependent insulinotropic polypeptide pathway.

In contrast, Asia is the fastest-growing market, expanding at a rate of 13.0% due to rising disease prevalence and improving healthcare access.

This growth is fueled by the increased use of established drug classes like dipeptidyl peptidase-4 and sodium-glucose cotransporter-2 inhibitors, which offer effective and increasingly affordable treatment options.

Market Dynamics

Our researchers analyzed the data with 2025 as the base year, along with the key drivers, trends, and challenges. A holistic analysis of drivers will help companies refine their marketing strategies to gain a competitive advantage.

  • The strategic landscape of the global type 2 diabetes market 2026-2030 is increasingly focused on personalizing treatment pathways beyond simple glycemic management. A key consideration is understanding the impact of glp-1 agonists on weight management, a significant comorbidity for many patients. Concurrently, the proven benefits of sglt-2 inhibitors for heart failure are reshaping clinical guidelines, prioritizing agents with cardiovascular advantages.
  • This has intensified the search for effective oral alternatives to injectable insulin therapies, aiming to improve convenience and long-term compliance. The challenge of managing glycemic variability with continuous glucose monitoring is being addressed through advanced analytics, which helps in reducing therapeutic inertia in diabetes care.
  • From a strategic perspective, the role of digital health in improving patient adherence has become a critical performance metric for providers. Furthermore, the cost-effectiveness of automated insulin delivery systems is scrutinized twice as heavily in procurement decisions compared to five years ago.
  • This shift also highlights challenges in cold-chain logistics for biologics and elevates the importance of tracking cardiovascular outcomes of new diabetes medications and successfully integrating cgm data into clinical practice to validate therapeutic value.

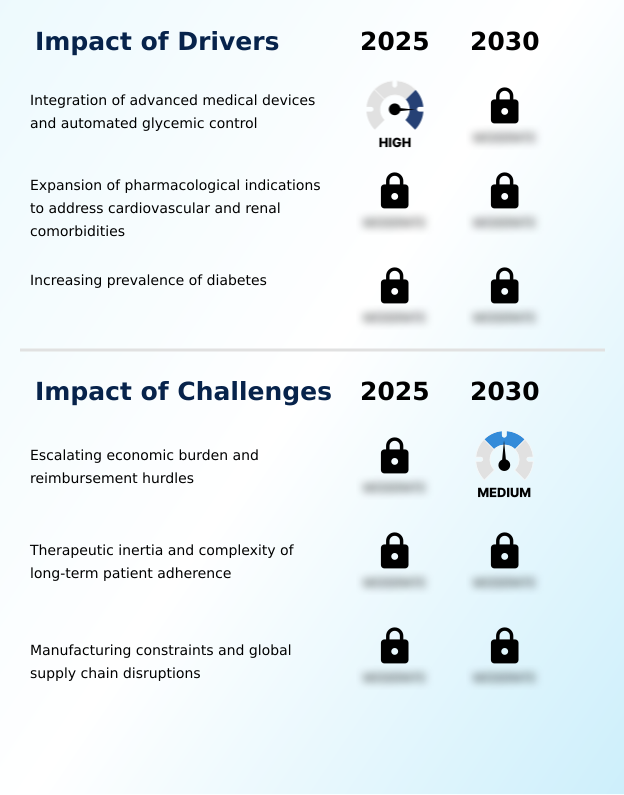
What are the key market drivers leading to the rise in the adoption of Type 2 Diabetes Industry?

  • The integration of advanced medical devices and automated glycemic control systems is a key driver accelerating market expansion.

  • Market growth is propelled by technological advancements and a deeper clinical understanding of chronic disease management.
  • The integration of continuous glucose monitoring with automated glycemic control is a primary driver, with closed-loop systems demonstrating an ability to increase users' time in the optimal glucose range by over 20%.
  • This data-driven approach, supported by real-world evidence, improves outcomes and aligns with value-based care. Another key driver is the expansion of therapies to provide cardiorenal benefits beyond glycemic control.
  • Medications offering proven cardiovascular risk reduction are now prioritized in over 40% of new treatment plans for high-risk patients, reflecting a shift toward holistic health management and preventive care models.

What are the market trends shaping the Type 2 Diabetes Industry?

  • The integration of artificial intelligence and predictive analytics is a key trend in chronic disease management. This evolution is reshaping patient care by enabling more proactive and personalized therapeutic strategies.

  • Key trends are reshaping the market, driven by a convergence of technology and patient-centric care. The adoption of non-invasive formulations is accelerating, with advancements in oral delivery of complex biologics like glucagon-like peptide-1. These innovations, coupled with smart insulin pens, are improving convenience and driving better hemoglobin a1c reduction.
  • The move toward decentralized healthcare, supported by telehealth consultations and specialized cold-chain logistics, ensures wider access to temperature-sensitive medications. This logistical enhancement is critical, as it supports a 40% increase in home delivery for injectable therapies. Furthermore, digital platforms leveraging AI have shown the potential to improve long-term adherence by up to 25% by providing personalized feedback and support.

What challenges does the Type 2 Diabetes Industry face during its growth?

  • The escalating economic burden of advanced therapies and associated reimbursement hurdles present a key challenge to market growth.

  • Significant challenges constrain market potential, primarily centered on economics, adherence, and manufacturing. High costs associated with novel pharmacological therapies, such as incretin mimetics and dual agonist therapies, create substantial reimbursement hurdles.
  • This financial pressure is compounded by issues of therapeutic inertia, where studies show that nearly 50% of patients with suboptimal glycemic control do not receive timely treatment adjustments, necessitating better clinical decision support.
  • Furthermore, ensuring supply chain resilience is a critical challenge, as manufacturing constraints for high-demand biologics have led to shortages affecting medication access for an estimated 1 in 5 patients in some regions, undermining therapeutic inertia mitigation efforts.

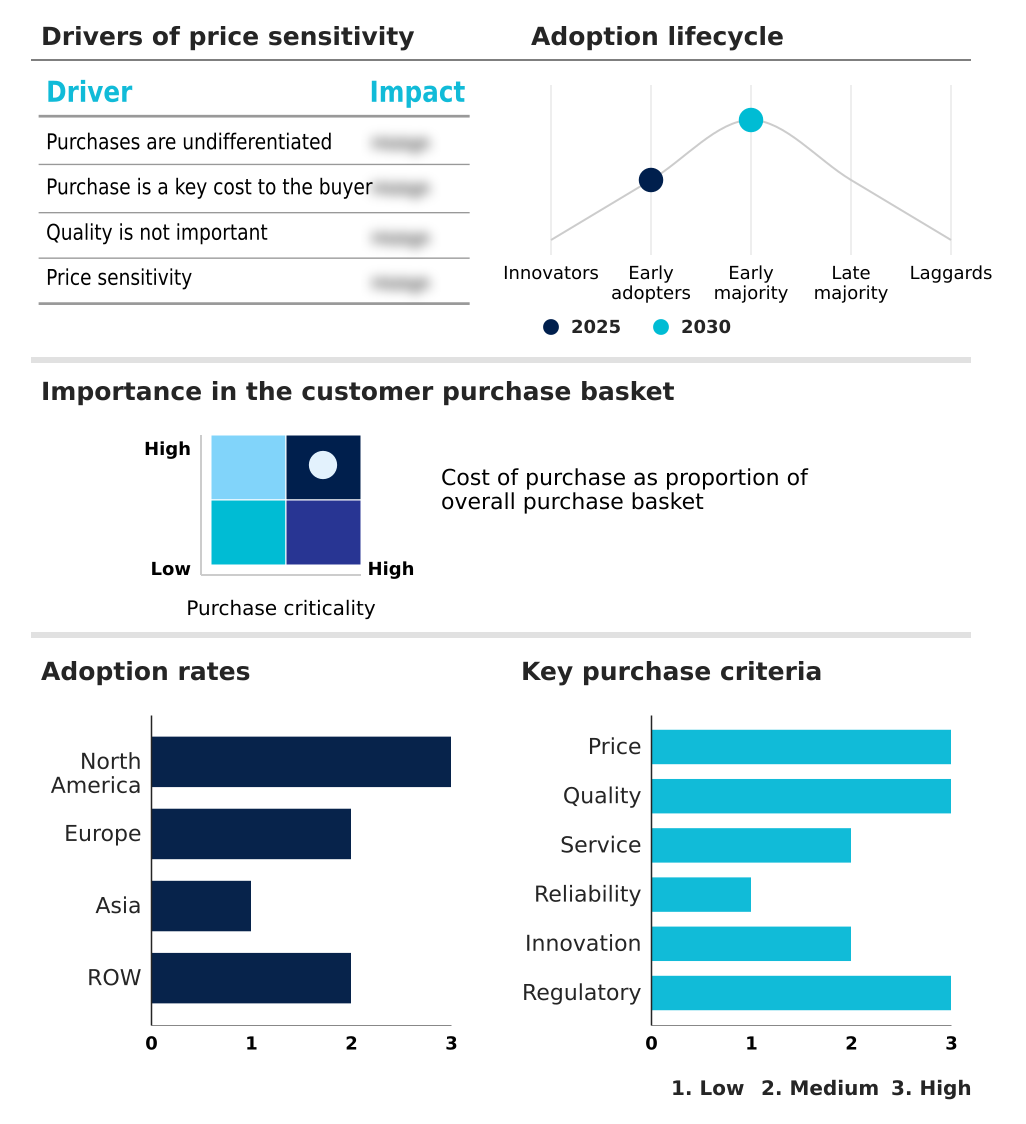
Exclusive Technavio Analysis on Customer Landscape

The type 2 diabetes market forecasting report includes the adoption lifecycle of the market, covering from the innovator’s stage to the laggard’s stage. It focuses on adoption rates in different regions based on penetration. Furthermore, the type 2 diabetes market report also includes key purchase criteria and drivers of price sensitivity to help companies evaluate and develop their market growth analysis strategies.

Customer Landscape of Type 2 Diabetes Industry

Competitive Landscape

Companies are implementing various strategies, such as strategic alliances, type 2 diabetes market forecast, partnerships, mergers and acquisitions, geographical expansion, and product/service launches, to enhance their presence in the industry.

Abbott Laboratories - Advanced medical devices and diagnostic products form the core of integrated solutions for chronic disease management and glucose monitoring.

The industry research and growth report includes detailed analyses of the competitive landscape of the market and information about key companies, including:

  • Abbott Laboratories
  • AstraZeneca Plc
  • Bayer AG
  • Biocon Ltd.
  • Boehringer Ingelheim GmbH
  • Dexcom Inc.
  • Eli Lilly and Co.
  • F. Hoffmann La Roche Ltd.
  • Insulet Corp.
  • Lupin Ltd.
  • Medtronic Plc
  • Merck and Co. Inc.
  • MicroPort Scientific Corp.
  • Novartis AG
  • Pfizer Inc.
  • Sanofi SA
  • Sun Pharmaceutical Industries
  • Takeda Pharmaceutical Ltd.
  • Tandem Diabetes Care Inc.
  • Terumo Corp.

Qualitative and quantitative analysis of companies has been conducted to help clients understand the wider business environment as well as the strengths and weaknesses of key industry players. Data is qualitatively analyzed to categorize companies as pure play, category-focused, industry-focused, and diversified; it is quantitatively analyzed to categorize companies as dominant, leading, strong, tentative, and weak.

Recent Development and News in Type 2 diabetes market

  • In October, 2024, Novo Nordisk secured a significant approval from the Food and Drug Administration of the United States for Rybelsus, an oral semaglutide formulation, to reduce the risk of major adverse cardiovascular events in adults with Type 2 diabetes and established cardiovascular disease.
  • In February, 2025, Tandem Diabetes Care received clearance from the Food and Drug Administration of the United States for the use of its Control-IQ technology in adults living with Type 2 diabetes, expanding automated insulin delivery to a broader population.
  • In March, 2025, Dexcom launched an upgraded digital interface that utilizes generative artificial intelligence to provide personalized lifestyle recommendations based on glucose fluctuations and historical data trends, enhancing its continuous glucose monitoring platform.
  • In May, 2025, Amazon Pharmacy announced a major expansion of its specialized cold-chain logistics network, enabling same-day delivery of insulin and other refrigerated metabolic medications across more than twenty major metropolitan areas.

Dive into Technavio’s robust research methodology, blending expert interviews, extensive data synthesis, and validated models for unparalleled Type 2 Diabetes Market insights. See full methodology.

Market Scope
Page number 303
Base year 2025
Historic period 2020-2024
Forecast period 2026-2030
Growth momentum & CAGR Accelerate at a CAGR of 12.2%
Market growth 2026-2030 USD 59896.1 million
Market structure Fragmented
YoY growth 2025-2026(%) 11.0%
Key countries US, Canada, Mexico, Germany, France, UK, Italy, Spain, Russia, China, India, Japan, South Korea, Turkey, Indonesia, Brazil, Saudi Arabia, South Africa, Israel, Argentina, Egypt, UAE and Colombia
Competitive landscape Leading Companies, Market Positioning of Companies, Competitive Strategies, and Industry Risks

Request Free Sample

Research Analyst Overview

  • The global type 2 diabetes market 2026-2030 is undergoing a fundamental transformation, shifting from a singular focus on glycemic control to holistic metabolic health management. This evolution prioritizes cardiovascular risk reduction and renal protection, compelling a strategic pivot in R&D budgeting toward dual agonist therapies and combination treatments.
  • The integration of advanced technologies like continuous glucose monitoring and closed-loop systems for automated insulin delivery is becoming standard. Innovations in non-invasive formulations, including oral semaglutide formulation and other patient-centric alternatives, are addressing long-standing barriers to adherence. The development of next-generation pharmacological therapies, such as those targeting glucagon-like peptide-1 and sodium-glucose cotransporter-2, alongside biosimilar insulin aspart, is intensifying competition.
  • However, therapeutic inertia remains a significant challenge, with studies showing that nearly 50% of adults with insufficient hemoglobin A1C reduction do not receive timely therapy adjustments. Success now hinges on creating integrated ecosystems that combine smart insulin pens and subcutaneous infusion technologies with data-driven insights to enable precise, automated glycemic control.

What are the Key Data Covered in this Type 2 Diabetes Market Research and Growth Report?

  • What is the expected growth of the Type 2 Diabetes Market between 2026 and 2030?

    • USD 59.90 billion, at a CAGR of 12.2%

  • What segmentation does the market report cover?

    • The report is segmented by Drug Class (Insulin, DPP-4 inhibitor, GLP-1 receptor agonists, SGLT-2 inhibitors, and Others), Distribution Channel (Retail pharmacies, Hospital pharmacies, and Online pharmacies), Delivery Mode (Oral, Injectable, and Continuous glucose monitoring (CGM)) and Geography (North America, Europe, Asia, Rest of World (ROW))

  • Which regions are analyzed in the report?

    • North America, Europe, Asia and Rest of World (ROW)

  • What are the key growth drivers and market challenges?

    • Integration of advanced medical devices and automated glycemic control, Escalating economic burden and reimbursement hurdles

  • Who are the major players in the Type 2 Diabetes Market?

    • Abbott Laboratories, AstraZeneca Plc, Bayer AG, Biocon Ltd., Boehringer Ingelheim GmbH, Dexcom Inc., Eli Lilly and Co., F. Hoffmann La Roche Ltd., Insulet Corp., Lupin Ltd., Medtronic Plc, Merck and Co. Inc., MicroPort Scientific Corp., Novartis AG, Pfizer Inc., Sanofi SA, Sun Pharmaceutical Industries, Takeda Pharmaceutical Ltd., Tandem Diabetes Care Inc. and Terumo Corp.

Market Research Insights

  • Market dynamics are increasingly shaped by a move toward holistic metabolic disorder management, where treatment efficacy is measured by comprehensive health outcomes rather than just glycemic control. The adoption of value-based care models prioritizes therapies that deliver long-term clinical and economic advantages.
  • For example, integrated systems combining continuous glucose monitoring with automated insulin delivery have demonstrated a 25% reduction in hospital readmissions for acute glycemic events. Concurrently, digital health platforms are enhancing patient adherence solutions, with some platforms boosting medication compliance by over 30%.
  • This focus on real-world evidence and patient engagement is compelling providers to invest in technologies that facilitate decentralized healthcare and improve supply chain resilience for temperature-sensitive biologics.

We can help! Our analysts can customize this type 2 diabetes market research report to meet your requirements.

Get in touch

1. Executive Summary

1.1 Market overview

Executive Summary - Chart on Market Overview
Executive Summary - Data Table on Market Overview
Executive Summary - Chart on Global Market Characteristics
Executive Summary - Chart on Market by Geography
Executive Summary - Chart on Market Segmentation by Drug Class
Executive Summary - Chart on Market Segmentation by Distribution Channel
Executive Summary - Chart on Market Segmentation by Delivery Mode
Executive Summary - Chart on Incremental Growth
Executive Summary - Data Table on Incremental Growth
Executive Summary - Chart on Company Market Positioning

2. Technavio Analysis

2.1 Analysis of price sensitivity, lifecycle, customer purchase basket, adoption rates, and purchase criteria

2.2 Criticality of inputs and Factors of differentiation

Chart on Overview on criticality of inputs and factors of differentiation

2.3 Factors of disruption

Chart on Overview on factors of disruption

2.4 Impact of drivers and challenges

Chart on Impact of drivers and challenges in 2025 and 2030

3. Market Landscape

3.1 Market ecosystem

Chart on Parent Market
Data Table on - Parent Market

3.2 Market characteristics

Chart on Market characteristics analysis

3.3 Value chain analysis

Chart on Value chain analysis

4. Market Sizing

4.1 Market definition

Data Table on Offerings of companies included in the market definition

4.2 Market segment analysis

Market segments

4.3 Market size 2025

4.4 Market outlook: Forecast for 2025-2030

Chart on Global - Market size and forecast 2025-2030 ($ million)
Data Table on Global - Market size and forecast 2025-2030 ($ million)
Chart on Global Market: Year-over-year growth 2025-2030 (%)
Data Table on Global Market: Year-over-year growth 2025-2030 (%)

5. Historic Market Size

5.1 Global Type 2 Diabetes Market 2020 - 2024

Historic Market Size - Data Table on Global Type 2 Diabetes Market 2020 - 2024 ($ million)

5.2 Drug Class segment analysis 2020 - 2024

Historic Market Size - Drug Class Segment 2020 - 2024 ($ million)

5.3 Distribution Channel segment analysis 2020 - 2024

Historic Market Size - Distribution Channel Segment 2020 - 2024 ($ million)

5.4 Delivery Mode segment analysis 2020 - 2024

Historic Market Size - Delivery Mode Segment 2020 - 2024 ($ million)

5.5 Geography segment analysis 2020 - 2024

Historic Market Size - Geography Segment 2020 - 2024 ($ million)

5.6 Country segment analysis 2020 - 2024

Historic Market Size - Country Segment 2020 - 2024 ($ million)

6. Qualitative Analysis

6.1 Impact of AI on Global Type 2 Diabetes Market

6.2 Impact of geopolitical conflict on Global Type 2 Diabetes Market

7. Five Forces Analysis

7.1 Five forces summary

Five forces analysis - Comparison between 2025 and 2030

7.2 Bargaining power of buyers

Bargaining power of buyers - Impact of key factors 2025 and 2030

7.3 Bargaining power of suppliers

Bargaining power of suppliers - Impact of key factors in 2025 and 2030

7.4 Threat of new entrants

Threat of new entrants - Impact of key factors in 2025 and 2030

7.5 Threat of substitutes

Threat of substitutes - Impact of key factors in 2025 and 2030

7.6 Threat of rivalry

Threat of rivalry - Impact of key factors in 2025 and 2030

7.7 Market condition

Chart on Market condition - Five forces 2025 and 2030

8. Market Segmentation by Drug Class

8.1 Market segments

Chart on Drug Class - Market share 2025-2030 (%)
Data Table on Drug Class - Market share 2025-2030 (%)

8.2 Comparison by Drug Class

Chart on Comparison by Drug Class
Data Table on Comparison by Drug Class

8.3 Insulin - Market size and forecast 2025-2030

Chart on Insulin - Market size and forecast 2025-2030 ($ million)
Data Table on Insulin - Market size and forecast 2025-2030 ($ million)
Chart on Insulin - Year-over-year growth 2025-2030 (%)
Data Table on Insulin - Year-over-year growth 2025-2030 (%)

8.4 DPP-4 inhibitor - Market size and forecast 2025-2030

Chart on DPP-4 inhibitor - Market size and forecast 2025-2030 ($ million)
Data Table on DPP-4 inhibitor - Market size and forecast 2025-2030 ($ million)
Chart on DPP-4 inhibitor - Year-over-year growth 2025-2030 (%)
Data Table on DPP-4 inhibitor - Year-over-year growth 2025-2030 (%)

8.5 GLP-1 receptor agonists - Market size and forecast 2025-2030

Chart on GLP-1 receptor agonists - Market size and forecast 2025-2030 ($ million)
Data Table on GLP-1 receptor agonists - Market size and forecast 2025-2030 ($ million)
Chart on GLP-1 receptor agonists - Year-over-year growth 2025-2030 (%)
Data Table on GLP-1 receptor agonists - Year-over-year growth 2025-2030 (%)

8.6 SGLT-2 inhibitors - Market size and forecast 2025-2030

Chart on SGLT-2 inhibitors - Market size and forecast 2025-2030 ($ million)
Data Table on SGLT-2 inhibitors - Market size and forecast 2025-2030 ($ million)
Chart on SGLT-2 inhibitors - Year-over-year growth 2025-2030 (%)
Data Table on SGLT-2 inhibitors - Year-over-year growth 2025-2030 (%)

8.7 Others - Market size and forecast 2025-2030

Chart on Others - Market size and forecast 2025-2030 ($ million)
Data Table on Others - Market size and forecast 2025-2030 ($ million)
Chart on Others - Year-over-year growth 2025-2030 (%)
Data Table on Others - Year-over-year growth 2025-2030 (%)

8.8 Market opportunity by Drug Class

Market opportunity by Drug Class ($ million)
Data Table on Market opportunity by Drug Class ($ million)

9. Market Segmentation by Distribution Channel

9.1 Market segments

Chart on Distribution Channel - Market share 2025-2030 (%)
Data Table on Distribution Channel - Market share 2025-2030 (%)

9.2 Comparison by Distribution Channel

Chart on Comparison by Distribution Channel
Data Table on Comparison by Distribution Channel

9.3 Retail pharmacies - Market size and forecast 2025-2030

Chart on Retail pharmacies - Market size and forecast 2025-2030 ($ million)
Data Table on Retail pharmacies - Market size and forecast 2025-2030 ($ million)
Chart on Retail pharmacies - Year-over-year growth 2025-2030 (%)
Data Table on Retail pharmacies - Year-over-year growth 2025-2030 (%)

9.4 Hospital pharmacies - Market size and forecast 2025-2030

Chart on Hospital pharmacies - Market size and forecast 2025-2030 ($ million)
Data Table on Hospital pharmacies - Market size and forecast 2025-2030 ($ million)
Chart on Hospital pharmacies - Year-over-year growth 2025-2030 (%)
Data Table on Hospital pharmacies - Year-over-year growth 2025-2030 (%)

9.5 Online pharmacies - Market size and forecast 2025-2030

Chart on Online pharmacies - Market size and forecast 2025-2030 ($ million)
Data Table on Online pharmacies - Market size and forecast 2025-2030 ($ million)
Chart on Online pharmacies - Year-over-year growth 2025-2030 (%)
Data Table on Online pharmacies - Year-over-year growth 2025-2030 (%)

9.6 Market opportunity by Distribution Channel

Market opportunity by Distribution Channel ($ million)
Data Table on Market opportunity by Distribution Channel ($ million)

10. Market Segmentation by Delivery Mode

10.1 Market segments

Chart on Delivery Mode - Market share 2025-2030 (%)
Data Table on Delivery Mode - Market share 2025-2030 (%)

10.2 Comparison by Delivery Mode

Chart on Comparison by Delivery Mode
Data Table on Comparison by Delivery Mode

10.3 Oral - Market size and forecast 2025-2030

Chart on Oral - Market size and forecast 2025-2030 ($ million)
Data Table on Oral - Market size and forecast 2025-2030 ($ million)
Chart on Oral - Year-over-year growth 2025-2030 (%)
Data Table on Oral - Year-over-year growth 2025-2030 (%)

10.4 Injectable - Market size and forecast 2025-2030

Chart on Injectable - Market size and forecast 2025-2030 ($ million)
Data Table on Injectable - Market size and forecast 2025-2030 ($ million)
Chart on Injectable - Year-over-year growth 2025-2030 (%)
Data Table on Injectable - Year-over-year growth 2025-2030 (%)

10.5 Continuous glucose monitoring (CGM) - Market size and forecast 2025-2030

Chart on Continuous glucose monitoring (CGM) - Market size and forecast 2025-2030 ($ million)
Data Table on Continuous glucose monitoring (CGM) - Market size and forecast 2025-2030 ($ million)
Chart on Continuous glucose monitoring (CGM) - Year-over-year growth 2025-2030 (%)
Data Table on Continuous glucose monitoring (CGM) - Year-over-year growth 2025-2030 (%)

10.6 Market opportunity by Delivery Mode

Market opportunity by Delivery Mode ($ million)
Data Table on Market opportunity by Delivery Mode ($ million)

11. Customer Landscape

11.1 Customer landscape overview

Analysis of price sensitivity, lifecycle, customer purchase basket, adoption rates, and purchase criteria

12. Geographic Landscape

12.1 Geographic segmentation

Chart on Market share by geography 2025-2030 (%)
Data Table on Market share by geography 2025-2030 (%)

12.2 Geographic comparison

Chart on Geographic comparison
Data Table on Geographic comparison

12.3 North America - Market size and forecast 2025-2030

Chart on North America - Market size and forecast 2025-2030 ($ million)
Data Table on North America - Market size and forecast 2025-2030 ($ million)
Chart on North America - Year-over-year growth 2025-2030 (%)
Data Table on North America - Year-over-year growth 2025-2030 (%)
Chart on Regional Comparison - North America
Data Table on Regional Comparison - North America

12.3.1 US - Market size and forecast 2025-2030

Chart on US - Market size and forecast 2025-2030 ($ million)
Data Table on US - Market size and forecast 2025-2030 ($ million)
Chart on US - Year-over-year growth 2025-2030 (%)
Data Table on US - Year-over-year growth 2025-2030 (%)

12.3.2 Canada - Market size and forecast 2025-2030

Chart on Canada - Market size and forecast 2025-2030 ($ million)
Data Table on Canada - Market size and forecast 2025-2030 ($ million)
Chart on Canada - Year-over-year growth 2025-2030 (%)
Data Table on Canada - Year-over-year growth 2025-2030 (%)

12.3.3 Mexico - Market size and forecast 2025-2030

Chart on Mexico - Market size and forecast 2025-2030 ($ million)
Data Table on Mexico - Market size and forecast 2025-2030 ($ million)
Chart on Mexico - Year-over-year growth 2025-2030 (%)
Data Table on Mexico - Year-over-year growth 2025-2030 (%)

12.4 Europe - Market size and forecast 2025-2030

Chart on Europe - Market size and forecast 2025-2030 ($ million)
Data Table on Europe - Market size and forecast 2025-2030 ($ million)
Chart on Europe - Year-over-year growth 2025-2030 (%)
Data Table on Europe - Year-over-year growth 2025-2030 (%)
Chart on Regional Comparison - Europe
Data Table on Regional Comparison - Europe

12.4.1 Germany - Market size and forecast 2025-2030

Chart on Germany - Market size and forecast 2025-2030 ($ million)
Data Table on Germany - Market size and forecast 2025-2030 ($ million)
Chart on Germany - Year-over-year growth 2025-2030 (%)
Data Table on Germany - Year-over-year growth 2025-2030 (%)

12.4.2 France - Market size and forecast 2025-2030

Chart on France - Market size and forecast 2025-2030 ($ million)
Data Table on France - Market size and forecast 2025-2030 ($ million)
Chart on France - Year-over-year growth 2025-2030 (%)
Data Table on France - Year-over-year growth 2025-2030 (%)

12.4.3 UK - Market size and forecast 2025-2030

Chart on UK - Market size and forecast 2025-2030 ($ million)
Data Table on UK - Market size and forecast 2025-2030 ($ million)
Chart on UK - Year-over-year growth 2025-2030 (%)
Data Table on UK - Year-over-year growth 2025-2030 (%)

12.4.4 Italy - Market size and forecast 2025-2030

Chart on Italy - Market size and forecast 2025-2030 ($ million)
Data Table on Italy - Market size and forecast 2025-2030 ($ million)
Chart on Italy - Year-over-year growth 2025-2030 (%)
Data Table on Italy - Year-over-year growth 2025-2030 (%)

12.4.5 Spain - Market size and forecast 2025-2030

Chart on Spain - Market size and forecast 2025-2030 ($ million)
Data Table on Spain - Market size and forecast 2025-2030 ($ million)
Chart on Spain - Year-over-year growth 2025-2030 (%)
Data Table on Spain - Year-over-year growth 2025-2030 (%)

12.4.6 Russia - Market size and forecast 2025-2030

Chart on Russia - Market size and forecast 2025-2030 ($ million)
Data Table on Russia - Market size and forecast 2025-2030 ($ million)
Chart on Russia - Year-over-year growth 2025-2030 (%)
Data Table on Russia - Year-over-year growth 2025-2030 (%)

12.5 Asia - Market size and forecast 2025-2030

Chart on Asia - Market size and forecast 2025-2030 ($ million)
Data Table on Asia - Market size and forecast 2025-2030 ($ million)
Chart on Asia - Year-over-year growth 2025-2030 (%)
Data Table on Asia - Year-over-year growth 2025-2030 (%)
Chart on Regional Comparison - Asia
Data Table on Regional Comparison - Asia

12.5.1 China - Market size and forecast 2025-2030

Chart on China - Market size and forecast 2025-2030 ($ million)
Data Table on China - Market size and forecast 2025-2030 ($ million)
Chart on China - Year-over-year growth 2025-2030 (%)
Data Table on China - Year-over-year growth 2025-2030 (%)

12.5.2 India - Market size and forecast 2025-2030

Chart on India - Market size and forecast 2025-2030 ($ million)
Data Table on India - Market size and forecast 2025-2030 ($ million)
Chart on India - Year-over-year growth 2025-2030 (%)
Data Table on India - Year-over-year growth 2025-2030 (%)

12.5.3 Japan - Market size and forecast 2025-2030

Chart on Japan - Market size and forecast 2025-2030 ($ million)
Data Table on Japan - Market size and forecast 2025-2030 ($ million)
Chart on Japan - Year-over-year growth 2025-2030 (%)
Data Table on Japan - Year-over-year growth 2025-2030 (%)

12.5.4 South Korea - Market size and forecast 2025-2030

Chart on South Korea - Market size and forecast 2025-2030 ($ million)
Data Table on South Korea - Market size and forecast 2025-2030 ($ million)
Chart on South Korea - Year-over-year growth 2025-2030 (%)
Data Table on South Korea - Year-over-year growth 2025-2030 (%)

12.5.5 Turkey - Market size and forecast 2025-2030

Chart on Turkey - Market size and forecast 2025-2030 ($ million)
Data Table on Turkey - Market size and forecast 2025-2030 ($ million)
Chart on Turkey - Year-over-year growth 2025-2030 (%)
Data Table on Turkey - Year-over-year growth 2025-2030 (%)

12.5.6 Indonesia - Market size and forecast 2025-2030

Chart on Indonesia - Market size and forecast 2025-2030 ($ million)
Data Table on Indonesia - Market size and forecast 2025-2030 ($ million)
Chart on Indonesia - Year-over-year growth 2025-2030 (%)
Data Table on Indonesia - Year-over-year growth 2025-2030 (%)

12.6 Rest of World (ROW) - Market size and forecast 2025-2030

Chart on Rest of World (ROW) - Market size and forecast 2025-2030 ($ million)
Data Table on Rest of World (ROW) - Market size and forecast 2025-2030 ($ million)
Chart on Rest of World (ROW) - Year-over-year growth 2025-2030 (%)
Data Table on Rest of World (ROW) - Year-over-year growth 2025-2030 (%)
Chart on Regional Comparison - Rest of World (ROW)
Data Table on Regional Comparison - Rest of World (ROW)

12.6.1 Brazil - Market size and forecast 2025-2030

Chart on Brazil - Market size and forecast 2025-2030 ($ million)
Data Table on Brazil - Market size and forecast 2025-2030 ($ million)
Chart on Brazil - Year-over-year growth 2025-2030 (%)
Data Table on Brazil - Year-over-year growth 2025-2030 (%)

12.6.2 Saudi Arabia - Market size and forecast 2025-2030

Chart on Saudi Arabia - Market size and forecast 2025-2030 ($ million)
Data Table on Saudi Arabia - Market size and forecast 2025-2030 ($ million)
Chart on Saudi Arabia - Year-over-year growth 2025-2030 (%)
Data Table on Saudi Arabia - Year-over-year growth 2025-2030 (%)

12.6.3 South Africa - Market size and forecast 2025-2030

Chart on South Africa - Market size and forecast 2025-2030 ($ million)
Data Table on South Africa - Market size and forecast 2025-2030 ($ million)
Chart on South Africa - Year-over-year growth 2025-2030 (%)
Data Table on South Africa - Year-over-year growth 2025-2030 (%)

12.6.4 Israel - Market size and forecast 2025-2030

Chart on Israel - Market size and forecast 2025-2030 ($ million)
Data Table on Israel - Market size and forecast 2025-2030 ($ million)
Chart on Israel - Year-over-year growth 2025-2030 (%)
Data Table on Israel - Year-over-year growth 2025-2030 (%)

12.6.5 Argentina - Market size and forecast 2025-2030

Chart on Argentina - Market size and forecast 2025-2030 ($ million)
Data Table on Argentina - Market size and forecast 2025-2030 ($ million)
Chart on Argentina - Year-over-year growth 2025-2030 (%)
Data Table on Argentina - Year-over-year growth 2025-2030 (%)

12.6.6 Egypt - Market size and forecast 2025-2030

Chart on Egypt - Market size and forecast 2025-2030 ($ million)
Data Table on Egypt - Market size and forecast 2025-2030 ($ million)
Chart on Egypt - Year-over-year growth 2025-2030 (%)
Data Table on Egypt - Year-over-year growth 2025-2030 (%)

12.6.7 UAE - Market size and forecast 2025-2030

Chart on UAE - Market size and forecast 2025-2030 ($ million)
Data Table on UAE - Market size and forecast 2025-2030 ($ million)
Chart on UAE - Year-over-year growth 2025-2030 (%)
Data Table on UAE - Year-over-year growth 2025-2030 (%)

12.6.8 Colombia - Market size and forecast 2025-2030

Chart on Colombia - Market size and forecast 2025-2030 ($ million)
Data Table on Colombia - Market size and forecast 2025-2030 ($ million)
Chart on Colombia - Year-over-year growth 2025-2030 (%)
Data Table on Colombia - Year-over-year growth 2025-2030 (%)

12.7 Market opportunity by geography

Market opportunity by geography ($ million)
Data Tables on Market opportunity by geography ($ million)

13. Drivers, Challenges, and Opportunity

13.1 Market drivers

Integration of advanced medical devices and automated glycemic control
Expansion of pharmacological indications to address cardiovascular and renal comorbidities
Increasing prevalence of diabetes

13.2 Market challenges

Escalating economic burden and reimbursement hurdles
Therapeutic inertia and complexity of long-term patient adherence
Manufacturing constraints and global supply chain disruptions

13.3 Impact of drivers and challenges

Impact of drivers and challenges in 2025 and 2030

13.4 Market opportunities

Integration of AI and predictive analytics in chronic management
Advancement of long-acting and non-invasive therapeutic formulations
Decentralization of care through digital pharmacy and temperature-controlled logistics

14. Competitive Landscape

14.1 Overview

14.2

Overview on criticality of inputs and factors of differentiation

14.3 Landscape disruption

Overview on factors of disruption

14.4 Industry risks

Impact of key risks on business

15. Competitive Analysis

15.1 Companies profiled

Companies covered

15.2 Company ranking index

15.3 Market positioning of companies

Matrix on companies position and classification

15.4 Abbott Laboratories

Abbott Laboratories - Overview
Abbott Laboratories - Business segments
Abbott Laboratories - Key news
Abbott Laboratories - Key offerings
Abbott Laboratories - Segment focus
SWOT

15.5 AstraZeneca Plc

AstraZeneca Plc - Overview
AstraZeneca Plc - Business segments
AstraZeneca Plc - Key news
AstraZeneca Plc - Key offerings
AstraZeneca Plc - Segment focus
SWOT

15.6 Bayer AG

Bayer AG - Overview
Bayer AG - Business segments
Bayer AG - Key offerings
Bayer AG - Segment focus
SWOT

15.7 Biocon Ltd.

Biocon Ltd. - Overview
Biocon Ltd. - Business segments
Biocon Ltd. - Key offerings
Biocon Ltd. - Segment focus
SWOT

15.8 Dexcom Inc.

Dexcom Inc. - Overview
Dexcom Inc. - Product / Service
Dexcom Inc. - Key offerings
SWOT

15.9 Eli Lilly and Co.

Eli Lilly and Co. - Overview
Eli Lilly and Co. - Product / Service
Eli Lilly and Co. - Key offerings
SWOT

15.10 F. Hoffmann La Roche Ltd.

F. Hoffmann La Roche Ltd. - Overview
F. Hoffmann La Roche Ltd. - Business segments
F. Hoffmann La Roche Ltd. - Key news
F. Hoffmann La Roche Ltd. - Key offerings
F. Hoffmann La Roche Ltd. - Segment focus
SWOT

15.11 Lupin Ltd.

Lupin Ltd. - Overview
Lupin Ltd. - Business segments
Lupin Ltd. - Key news
Lupin Ltd. - Key offerings
Lupin Ltd. - Segment focus
SWOT

15.12 Medtronic Plc

Medtronic Plc - Overview
Medtronic Plc - Business segments
Medtronic Plc - Key news
Medtronic Plc - Key offerings
Medtronic Plc - Segment focus
SWOT

15.13 Merck and Co. Inc.

Merck and Co. Inc. - Overview
Merck and Co. Inc. - Business segments
Merck and Co. Inc. - Key news
Merck and Co. Inc. - Key offerings
Merck and Co. Inc. - Segment focus
SWOT

15.14 Novartis AG

Novartis AG - Overview
Novartis AG - Business segments
Novartis AG - Key news
Novartis AG - Key offerings
Novartis AG - Segment focus
SWOT

15.15 Pfizer Inc.

Pfizer Inc. - Overview
Pfizer Inc. - Business segments
Pfizer Inc. - Key news
Pfizer Inc. - Key offerings
Pfizer Inc. - Segment focus
SWOT

15.16 Sanofi SA

Sanofi SA - Overview
Sanofi SA - Business segments
Sanofi SA - Key news
Sanofi SA - Key offerings
Sanofi SA - Segment focus
SWOT

15.17 Sun Pharmaceutical Industries

Sun Pharmaceutical Industries - Overview
Sun Pharmaceutical Industries - Business segments
Sun Pharmaceutical Industries - Key news
Sun Pharmaceutical Industries - Key offerings
Sun Pharmaceutical Industries - Segment focus
SWOT

15.18 Takeda Pharmaceutical Ltd.

Takeda Pharmaceutical Ltd. - Overview
Takeda Pharmaceutical Ltd. - Business segments
Takeda Pharmaceutical Ltd. - Key news
Takeda Pharmaceutical Ltd. - Key offerings
Takeda Pharmaceutical Ltd. - Segment focus
SWOT

16. Appendix

16.1 Scope of the report

Market definition
Objectives
Notes and caveats

16.2 Inclusions and exclusions checklist

Inclusions checklist
Exclusions checklist

16.3 Currency conversion rates for US$

16.4 Research methodology

16.5 Data procurement

Information sources

16.6 Data validation

16.7 Validation techniques employed for market sizing

16.8 Data synthesis

16.9 360 degree market analysis

16.10 List of abbreviations

Research Methodology

Technavio presents a detailed picture of the market by way of study, synthesis, and summation of data from multiple sources. The analysts have presented the various facets of the market with a particular focus on identifying the key industry influencers. The data thus presented is comprehensive, reliable, and the result of extensive research, both primary and secondary.

INFORMATION SOURCES

Primary sources

  • Manufacturers and suppliers
  • Channel partners
  • Industry experts
  • Strategic decision makers

Secondary sources

  • Industry journals and periodicals
  • Government data
  • Financial reports of key industry players
  • Historical data
  • Press releases

DATA ANALYSIS

Data Synthesis

  • Collation of data
  • Estimation of key figures
  • Analysis of derived insights

Data Validation

  • Triangulation with data models
  • Reference against proprietary databases
  • Corroboration with industry experts

REPORT WRITING

Qualitative

  • Market drivers
  • Market challenges
  • Market trends
  • Five forces analysis

Quantitative

  • Market size and forecast
  • Market segmentation
  • Geographical insights
  • Competitive landscape

Interested in this report?

Get your sample now to see our research methodology and insights!

Download Now

Frequently Asked Questions

Type 2 Diabetes market growth will increase by USD 59896.1 million during 2026-2030.

The Type 2 Diabetes market is expected to grow at a CAGR of 12.2% during 2026-2030.

Type 2 Diabetes market is segmented by Drug class (Insulin, DPP-4 inhibitor, GLP-1 receptor agonists, SGLT-2 inhibitors, Others) Distribution channel (Retail pharmacies, Hospital pharmacies, Online pharmacies) Delivery mode (Oral, Injectable, Continuous glucose monitoring (CGM))

Abbott Laboratories, AstraZeneca Plc, Bayer AG, Biocon Ltd., Boehringer Ingelheim GmbH, Dexcom Inc., Eli Lilly and Co., F. Hoffmann La Roche Ltd., Insulet Corp., Lupin Ltd., Medtronic Plc, Merck and Co. Inc., MicroPort Scientific Corp., Novartis AG, Pfizer Inc., Sanofi SA, Sun Pharmaceutical Industries, Takeda Pharmaceutical Ltd., Tandem Diabetes Care Inc., Terumo Corp. are a few of the key vendors in the Type 2 Diabetes market.

North America will register the highest growth rate of 35.9% among the other regions. Therefore, the Type 2 Diabetes market in North America is expected to garner significant business opportunities for the vendors during the forecast period.

US, Canada, Mexico, Germany, France, UK, Italy, Spain, Russia, China, India, Japan, South Korea, Turkey, Indonesia, Brazil, Saudi Arabia, South Africa, Israel, Argentina, Egypt, UAE, Colombia

  • Integration of advanced medical devices and automated glycemic control is the driving factor this market.

The Type 2 Diabetes market vendors should focus on grabbing business opportunities from the Drug class segment as it accounted for the largest market share in the base year.
RIA - Research AI Assistant
Ask RIA