Ultrasonic Flowmeter Market Analysis APAC, Europe, North America, South America, Middle East and Africa - US, China, India, Germany, UK - Size and Forecast 2024-2028

Ultrasonic Flowmeter Market Analysis APAC, Europe, North America, South America, Middle East and Africa - US, China, India, Germany, UK - Size and Forecast 2024-2028

Published: Nov 2023 165 Pages SKU: IRTNTR76797

Market Overview at a Glance

$1.36 B
Market Opportunity
6.87%
CAGR
6.37
YoY growth 2023-2024(%)

Ultrasonic Flowmeter Market Size 2024-2028 

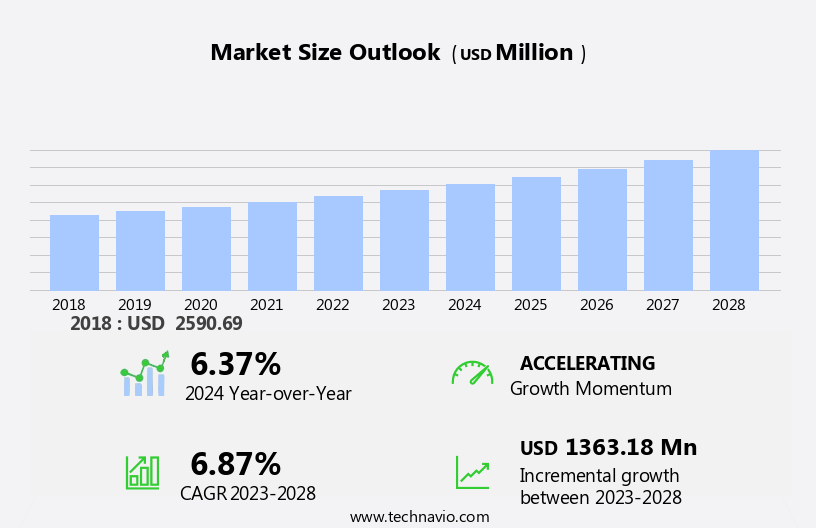
The ultrasonic flowmeter market size is forecast to increase by USD 1.36 billion at a CAGR of 6.87% between 2023 and 2028.

  • The market is experiencing significant growth due to the increased adoption of these meters in various industries, including oil and gas, water and wastewater, and power generation. One of the key drivers for this growth is the high demand for ultrasonic flowmeters in wastewater management applications.
  • However, the high initial costs associated with the production of ultrasonic flowmeters can be a challenge for market growth. Despite this, the benefits of using ultrasonic flowmeters, such as non-intrusive measurement, high accuracy, and reliability, make them a popular choice for flow measurement applications. As the demand for more efficient and accurate flow measurement solutions continues to grow, the market is expected to expand at a steady pace in the coming years.

What will be the Size of the Market During the Forecast Period?

Ultrasonic Flowmeter Market Size

 Request Free Sample

  • The market encompasses a wide range of measurement technologies that utilize sound waves to determine the flow rate of liquids and gases. This non-intrusive measurement method has gained significant traction in various industries due to its precision, reliability, and versatility. Two primary ultrasonic flowmeter technologies dominate the market: transit-time and Doppler. Transit-time flowmeters measure the time difference between ultrasonic waves traveling upstream and downstream of the flow. In contrast, Doppler flowmeters detect the frequency shift of ultrasonic waves as they interact with moving fluid particles. Both technologies offer advantages for specific applications, making them indispensable in power generation, oil and gas, chemical and petrochemical, and other industries.
  • Moreover, ultrasonic flowmeters play a crucial role in power generation, enabling accurate measurement of liquids and gases in power plants. They are particularly valuable in custody transfer applications, ensuring the precise measurement of fluid volumes for billing and regulatory compliance. In the oil and gas sector, ultrasonic flowmeters are employed for both upstream and downstream processes, including flare gas monitoring and sludge flow measurement. In the chemical and petrochemical industry, ultrasonic flowmeters provide reliable and accurate measurements in applications where other flowmeter technologies may fail. Their ability to measure both liquids and gases makes them an essential tool for process optimization and safety.
  • In addition, the Doppler technology segment of the market has gained considerable attention due to its ability to measure bidirectional flow. This feature is particularly valuable in applications where flow direction changes frequently, such as in the aerospace sector. Additionally, clamp-on ultrasonic flowmeters, which use Doppler technology, offer the advantage of installation without process interruption, making them a popular choice for maintenance-sensitive industries. The transit-time segment of the market focuses on precise flow measurement using the transit-time principle. This technology is commonly used in applications where high accuracy is required, such as in water quality associations and portable flowmeter applications.
  • Moreover, mechanical flowmeters, which are often compared to ultrasonic flowmeters, cannot provide the same level of accuracy and flexibility. Innovations in ultrasonic flowmeter technology continue to drive market growth. For instance, the use of advanced materials like titanium in the housings of ultrasonic transducers enhances durability and resistance to harsh environments. Furthermore, the application of metal 3D printing technology in the production of ultrasonic flowmeter components has led to lighter, more efficient, and cost-effective designs.
  • In conclusion, the market is a dynamic and evolving industry, driven by the need for precise, reliable, and versatile flow measurement solutions. The use of ultrasonic flowmeters in various industries, including power generation, oil and gas, chemical and petrochemical, and aerospace, highlights their importance in ensuring process efficiency, safety, and regulatory compliance. The continuous development of innovative technologies and materials will further expand the market's potential applications and enhance its value proposition.

How is this market segmented and which is the largest segment?

The market research report provides comprehensive data (region-wise segment analysis), with forecasts and estimates in "USD billion" for the period 2024-2028, as well as historical data from 2018-2022 for the following segments.

  • Technology
    • Transit-time
    • Doppler
    • Hybrid
  • Product
    • Spool piece ultrasonic flowmeter
    • Insertion ultrasonic flowmeter
    • Clamp-on ultrasonic flowmeter
  • Geography
    • APAC
      • China
      • India
    • Europe
      • Germany
      • UK
    • North America
      • US
    • South America
    • Middle East and Africa

By Technology Insights

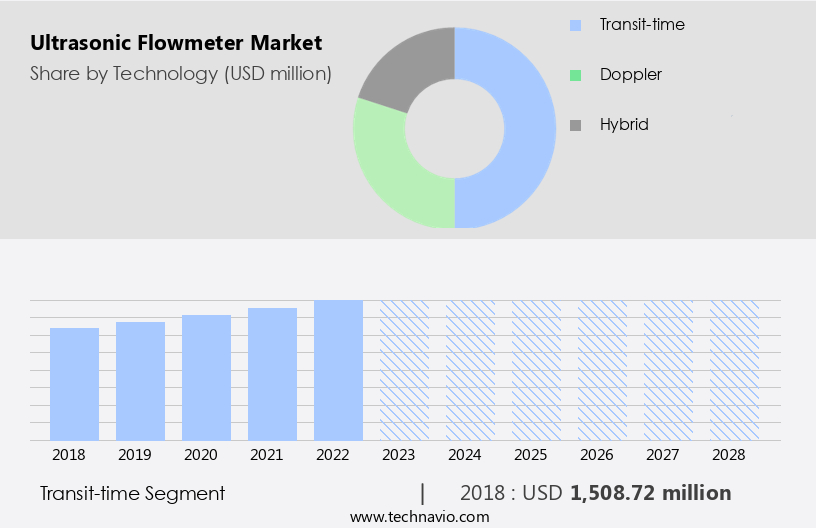
  • The transit-time segment is estimated to witness significant growth during the forecast period.

Ultrasonic flowmeters employ transit-time technology to precisely measure the flow rates of liquids and gases. In this technique, transmitters and receivers, comprised of ultrasonic transducers, are utilized alternately. Ultrasonic waves are transmitted upstream and downstream of the flowing liquid. The transit time of the ultrasonic signals between the transducers varies based on the flow direction. The difference in transit times is calculated to determine the flow velocity.

Transit-time ultrasonic flowmeters are applicable to various liquid types, such as water, oil, chemicals, and wastewater. This technology is extensively used in power generation and industrial process measurement applications. Analytical devices also integrate ultrasonic flowmeters for advanced flow measurement requirements. Ultrasonic flowmeters offer reliable and precise flow measurement solutions for diverse industries. By measuring the transit time of ultrasonic signals, these devices provide valuable insights into the flow rates of liquids and gases, contributing significantly to process optimization and efficiency.

Ultrasonic Flowmeter Market Size

Get a glance at the market report of share of various segments Request Free Sample

The transit-time segment was valued at USD 1.51 billion in 2018 and showed a gradual increase during the forecast period.

Regional Analysis

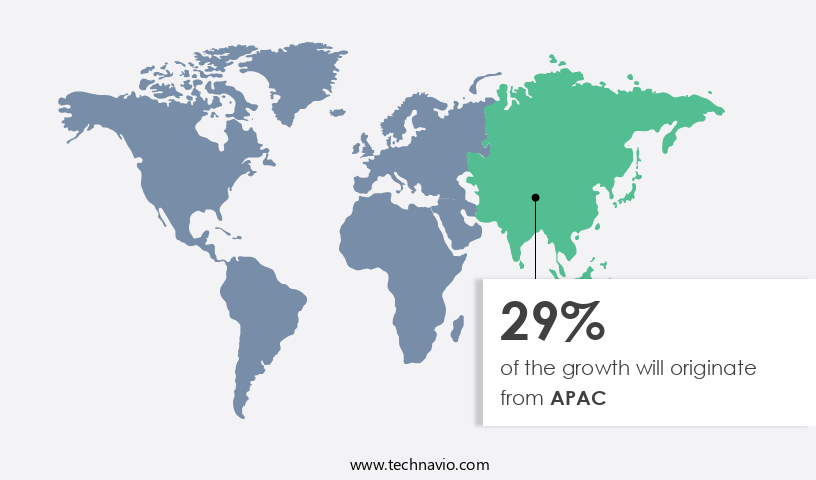
  • APAC is estimated to contribute 29% to the growth of the global market during the forecast period.

Technavio's analysts have elaborately explained the regional trends and drivers that shape the market during the forecast period.

Ultrasonic Flowmeter Market Share by Geography

For more insights on the market share of various regions Request Free Sample

In Asia Pacific (APAC), the industrial sector is experiencing significant growth, particularly in manufacturing, chemicals, petrochemicals, and electronics. This expansion has resulted in a heightened demand for precise flow measurement solutions, leading to increased usage of ultrasonic flowmeters. The region's rapid urbanization and infrastructure development have brought about increased investment in water and wastewater management systems. Ultrasonic flowmeters play a crucial role in monitoring and managing water distribution and wastewater treatment.

With rising energy costs, industries in APAC are prioritizing energy efficiency, and ultrasonic flowmeters offer accurate flow measurement to optimize processes and minimize energy consumption. Recent advancements in ultrasonic flowmeter technology have made it more precise, dependable, and adaptable to a broader range of applications, including flare gas monitoring, sludge flow measurement, and saturated steam flow measurement. This technology's growing popularity in APAC industries is a testament to its value in enhancing operational efficiency and reducing costs.

Market Dynamics

Our researchers analyzed the data with 2023 as the base year, along with the key drivers, trends, and challenges. A holistic analysis of drivers will help companies refine their marketing strategies to gain a competitive advantage.

What are the key market drivers leading to the rise in adoption of Ultrasonic Flowmeter Market?

Increased adoption of ultrasonic flowmeters in various industries is the key driver of the market.

  • Ultrasonic flowmeters have gained significant traction in various industries, such as oil and gas, water and wastewater management, chemicals, and pharmaceuticals. The versatility of these measurement instruments in handling both liquids and gases is a major factor fueling market growth. In the oil and gas sector, ultrasonic flowmeters are indispensable for custody transfer, process control, and pipeline transportation monitoring. In water and wastewater management, they are utilized for measuring clean water, wastewater, and sludge flow rates, which are essential for billing, process optimization, and environmental compliance. Ultrasonic flowmeters play a pivotal role in industrial processes by measuring the flow of various chemicals and fluids.
  • Moreover, the technology employs transit-time principles, including 1 path and 2 path, to deliver precise flow measurements. Ultrasonic flowmeters are available in various designs, including clamp-on, inline, and wall-mounted, catering to diverse applications. Doppler technology and hybrid methods are also employed in some ultrasonic flowmeters for added functionality. These measurement instruments are widely used in power generation, pharmaceuticals, and other industries, ensuring accurate volumetric flow measurement with minimal pressure drop and low maintenance requirements.
  • Ultrasonic flowmeters are also utilized in flare gas monitoring and saturated steam applications. The chemical compatibility of ultrasonic flowmeters makes them suitable for use in the chemical and petrochemical industries. Additionally, advancements in technology, such as the use of titanium-housed transducers and metal 3D printing, have led to the development of portable flowmeters and custom spool pieces, further expanding their applications in diverse industries.

What are the market trends shaping the Ultrasonic Flowmeter Market?

High demand for ultrasonic flowmeters from wastewater management is the upcoming trend in the market.

  • Ultrasonic flowmeters are a popular measurement technology in various industries for precise flow measurement of liquids and gases. These flowmeters utilize transit-time principles, including 1 path and 2 path methods, to determine liquid velocity and volumetric flow rate. Ultrasonic flowmeters find extensive applications in the power generation, water and wastewater, oil and gas, chemical and petrochemical, pharmaceuticals, and aerospace sectors. In the water and wastewater industry, ultrasonic flowmeters are used for bi-directional flow measurement, flare gas monitoring, sludge flow measurement, and water quality associations. These instruments offer advantages such as chemical compatibility, low-pressure drop, and low maintenance. Ultrasonic flowmeters come in various designs, including clamp-on, inline, and wall-mounted, catering to diverse installation requirements.
  • With the advancement in technology, ultrasonic flowmeters are now available in portable designs, enabling custody transfer applications. Ultrasonic flowmeters are also used in industrial process measurement and analytical devices for accurate measurement and monitoring of fluid flow. Titanium-housed transducers and metal 3D printing technology are some of the recent innovations in ultrasonic flowmeters, enhancing their durability and chemical resistance.

What challenges does Ultrasonic Flowmeter Market face during the growth?

High initial costs in ultrasonic flowmeter production are key challenges affecting the market growth.

  • Ultrasonic flowmeters are measurement instruments that utilize advanced technology, such as transit-time and Doppler, for precise flow measurement of liquids and gases in various industries. These flowmeters are widely used in power generation, water and wastewater, industrial process measurement, and analytical devices for applications ranging from flare gas monitoring and sludge flow measurement to saturated steam and volumetric flow measurement. Ultrasound technology enables bi-directional flow measurement and is compatible with a wide range of fluids, including water, pharmaceuticals, oil and gas, and chemicals. Ultrasonic flowmeters come in various designs, including clamp-on, inline, and wall-mounted, catering to diverse industrial requirements.
  • Transit-time technology, a key feature of ultrasonic flowmeters, measures the time it takes for sound waves to travel through the fluid twice, providing accurate flow rate measurements. Doppler technology, another advanced feature, measures the frequency shift of sound waves as they reflect off moving particles in the fluid, enabling real-time flow monitoring. Despite their high upfront costs, ultrasonic flowmeters offer numerous benefits, including low-pressure drop, low maintenance, chemical compatibility, and high accuracy. Their versatility and reliability make them an attractive option for industries that require precise and dependable flow measurement, such as chemical and petrochemical, oil and gas, pharmaceuticals, and aerospace.
  • Ultrasonic flowmeters are designed to handle various flow profiles and operating conditions, making them suitable for applications in power generation, water measurements, and industrial processes. The complexity of their design, including multipath configurations, signal processing algorithms, and compensation for various factors, contributes to their higher development and production costs. However, their precision and durability make them a valuable investment for industries seeking accurate and reliable flow measurement solutions. Portable ultrasonic flowmeters, such as hand-held devices, offer additional flexibility and convenience for applications that require on-the-go flow measurement. These portable devices are designed to be lightweight, rugged, and easy to use, making them ideal for applications in remote locations or for temporary flow measurement needs.
  • In summary, ultrasonic flowmeters are a valuable investment for industries that require precise and reliable flow measurement solutions. Their advanced technology, versatility, and durability make them a preferred choice for applications in power generation, water and wastewater, industrial processes, and analytical devices. Despite their higher upfront costs, their benefits, including low-pressure drop, low maintenance, and chemical compatibility, make them a worthwhile investment for industries seeking accurate and dependable flow measurement solutions.

Exclusive Customer Landscape

The market forecasting report includes the adoption lifecycle of the market, covering from the innovator's stage to the laggard's stage. It focuses on adoption rates in different regions based on penetration. Furthermore, the market report also includes key purchase criteria and drivers of price sensitivity to help companies evaluate and develop their market growth analysis strategies.
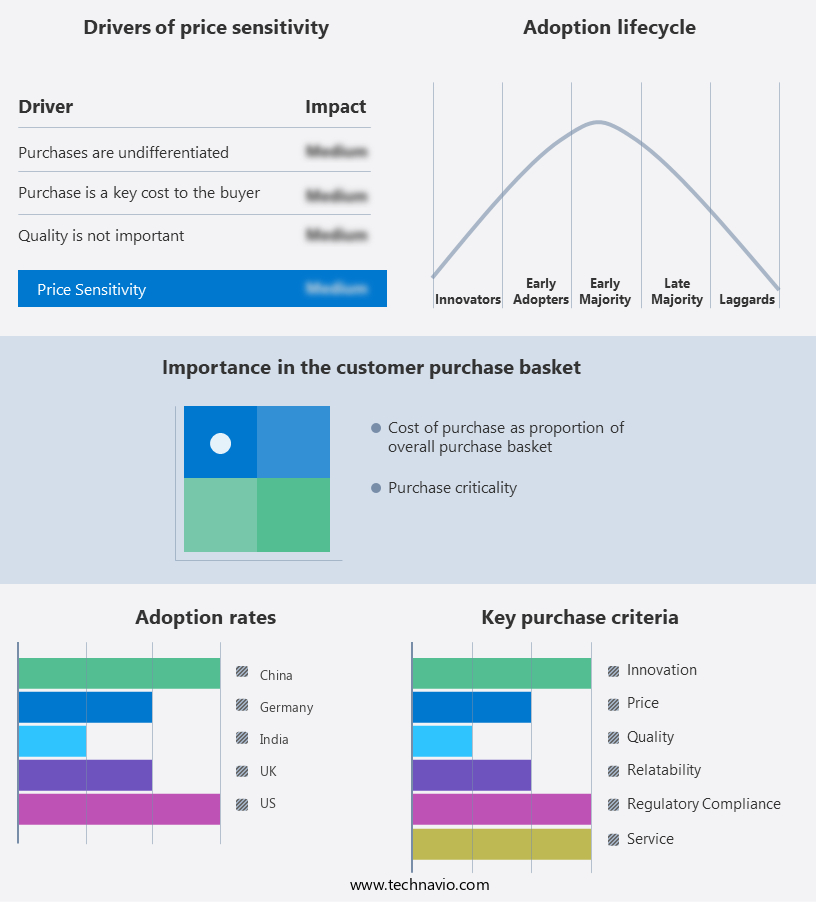
Ultrasonic Flowmeter Market Share by Geography

 Customer Landscape

Key Companies & Market Insights

Companies are implementing various strategies, such as strategic alliances, market forecast, partnerships, mergers and acquisitions, geographical expansion, and product/service launches, to enhance their presence in the market. The market research and growth report includes detailed analyses of the competitive landscape of the market and information about key companies, including:

  • Badger Meter Inc.
  • Baker Hughes Co.
  • Bronkhorst High Tech B.V.
  • CMC Technologies Pty Ltd.
  • Danfoss AS
  • Eesiflo Technologies Inc.
  • Emerson Electric Co.
  • Endress Hauser Group Services AG
  • FOX THERMAL INSTRUMENTS INC.
  • Fuji Electric Co. Ltd.
  • General Electric Co.
  • Honeywell International Inc.
  • IDEX Corp.
  • Katronic AG and Co. KG
  • KROHNE Messtechnik GmbH
  • Omega Engineering Inc.
  • Roper Technologies Inc.
  • Siemens AG
  • Teledyne Technologies Inc.
  • Fluenta AS

Qualitative and quantitative analysis of companies has been conducted to help clients understand the wider business environment as well as the strengths and weaknesses of key market players. Data is qualitatively analyzed to categorize companies as pure play, category-focused, industry-focused, and diversified; it is quantitatively analyzed to categorize companies as dominant, leading, strong, tentative, and weak.

Research Analyst Overview

The market encompasses a wide range of measurement technologies used to precisely measure the flow rates of liquids and gases in various industries. This market research focuses on the transit-time, Doppler, and hybrid ultrasonic flowmeter technologies and their applications in water and wastewater, power generation, water measurements, industrial process measurement, pharmaceuticals, oil and gas, chemical and petrochemical, and other sectors. Transit-time ultrasonic flowmeters use the 1-path and 2-path transit-time principles to measure liquid velocity and volumetric flow rates. These flowmeters are widely used in industries where accurate and reliable flow measurement is essential, such as water and wastewater treatment, power generation, and chemical processing.

Additionally, the transit-time technology offers several advantages, including low-pressure drop, low maintenance, and chemical compatibility. Doppler ultrasonic flowmeters, on the other hand, utilize the Doppler effect to measure the velocity of moving fluid particles. This technology is particularly useful in bi-directional flow measurements, making it ideal for applications in flare gas monitoring, sludge flow measurement, and saturated steam flow measurement. The Doppler technology is also widely used in the oil and gas industry for custody transfer and pipeline monitoring. Hybrid ultrasonic flowmeters combine the advantages of both transit-time and Doppler technologies to offer more accurate and versatile flow measurement solutions.

Moreover, these flowmeters are commonly used in industries where precise flow measurement is crucial, such as pharmaceuticals, water quality associations, and aerospace. Ultrasonic flowmeters find extensive applications in various industries. In the water and wastewater sector, they are used for precise flow measurement and monitoring to ensure efficient water management and treatment. In power generation, these flowmeters are used to measure the flow rates of cooling water and steam to optimize plant performance. In the industrial process measurement sector, ultrasonic flowmeters are used to monitor and control the flow of liquids and gases in manufacturing processes.

In the pharmaceuticals industry, ultrasonic flowmeters are used for precise flow measurement in the production of pharmaceutical products. The chemical industry relies on ultrasonic flowmeters for accurate measurement of flow rates in chemical processes. The oil and gas industry uses these flowmeters for custody transfer, pipeline monitoring, and flare gas monitoring. In the chemical and petrochemical sector, ultrasonic flowmeters are used for precise measurement of flow rates in large-scale production processes. Ultrasonic flowmeters come in various designs, including clamp-on, inline, and hand-held models. Clamp-on flowmeters are non-invasive and can be installed without shutting down the process. Inline flowmeters are installed directly in the pipeline and offer high accuracy and reliability. Wall-mounted and portable flowmeters are also available for applications where mobility is required.

In summary, ultrasonic flowmeters are made using various materials, including titanium-housed transducers and metal 3D printing. These materials offer advantages such as high durability, chemical compatibility, and low-pressure drop. The use of advanced manufacturing technologies like metal 3D printing enables the production of custom-designed flowmeters with high precision and accuracy. In conclusion, the market is a dynamic and growing industry, driven by the increasing demand for precise flow measurement solutions in various industries. The market is segmented into transit-time, Doppler, and hybrid technologies, each offering unique advantages for specific applications. The market is expected to continue growing due to the increasing focus on efficient process control, accurate measurement, and regulatory compliance in various industries.

Market Scope

Report Coverage

Details

Page number

165

Base year

2023

Historic period

2018-2022

Forecast period

2024-2028

Growth momentum & CAGR

Accelerate at a CAGR of 6.87%

Market growth 2024-2028

USD 1.36 billion

Market structure

Fragmented

YoY growth 2023-2024(%)

6.37

Key countries

US, China, India, Germany, and UK

Competitive landscape

Leading Companies, Market Positioning of Companies, Competitive Strategies, and Industry Risks

Request Free Sample

What are the Key Data Covered in this Market Research and Growth Report?

  • CAGR of the market during the forecast period
  • Detailed information on factors that will drive the market growth and forecasting between 2024 and 2028
  • Precise estimation of the size of the market  and its contribution of the market in focus to the parent market
  • Accurate predictions about upcoming market growth and trends and changes in consumer behaviour
  • Growth of the market across APAC, Europe, North America, South America, and Middle East and Africa
  • Thorough analysis of the market's competitive landscape and detailed information about companies
  • Comprehensive analysis of factors that will challenge the growth of market companies

We can help! Our analysts can customize this market research report to meet your requirements. Get in touch

1 Executive Summary

  • 1.1 Market overview
    • Exhibit 01: Executive Summary – Chart on Market Overview
    • Exhibit 02: Executive Summary – Data Table on Market Overview
    • Exhibit 03: Executive Summary – Chart on Global Market Characteristics
    • Exhibit 04: Executive Summary – Chart on Market by Geography
    • Exhibit 05: Executive Summary – Chart on Market Segmentation by Technology
    • Exhibit 06: Executive Summary – Chart on Market Segmentation by Product
    • Exhibit 07: Executive Summary – Chart on Incremental Growth
    • Exhibit 08: Executive Summary – Data Table on Incremental Growth
    • Exhibit 09: Executive Summary – Chart on Vendor Market Positioning

2 Market Landscape

  • 2.1 Market ecosystem
    • Exhibit 10: Parent market
    • Exhibit 11: Market Characteristics

3 Market Sizing

  • 3.1 Market definition
    • Exhibit 12: Offerings of vendors included in the market definition
  • 3.2 Market segment analysis
    • Exhibit 13: Market segments
  • 3.3 Market size 2023
    • 3.4 Market outlook: Forecast for 2023-2028
      • Exhibit 14: Chart on Global - Market size and forecast 2023-2028 ($ million)
      • Exhibit 15: Data Table on Global - Market size and forecast 2023-2028 ($ million)
      • Exhibit 16: Chart on Global Market: Year-over-year growth 2023-2028 (%)
      • Exhibit 17: Data Table on Global Market: Year-over-year growth 2023-2028 (%)

    4 Historic Market Size

    • 4.1 Global ultrasonic flowmeter market 2018 - 2022
      • Exhibit 18: Historic Market Size – Data Table on global ultrasonic flowmeter market 2018 - 2022 ($ million)
    • 4.2 Technology Segment Analysis 2018 - 2022
      • Exhibit 19: Historic Market Size – Technology Segment 2018 - 2022 ($ million)
    • 4.3 Product Segment Analysis 2018 - 2022
      • Exhibit 20: Historic Market Size – Product Segment 2018 - 2022 ($ million)
    • 4.4 Geography Segment Analysis 2018 - 2022
      • Exhibit 21: Historic Market Size – Geography Segment 2018 - 2022 ($ million)
    • 4.5 Country Segment Analysis 2018 - 2022
      • Exhibit 22: Historic Market Size – Country Segment 2018 - 2022 ($ million)

    5 Five Forces Analysis

    • 5.1 Five forces summary
      • Exhibit 23: Five forces analysis - Comparison between 2023 and 2028
    • 5.2 Bargaining power of buyers
      • Exhibit 24: Chart on Bargaining power of buyers – Impact of key factors 2023 and 2028
    • 5.3 Bargaining power of suppliers
      • Exhibit 25: Bargaining power of suppliers – Impact of key factors in 2023 and 2028
    • 5.4 Threat of new entrants
      • Exhibit 26: Threat of new entrants – Impact of key factors in 2023 and 2028
    • 5.5 Threat of substitutes
      • Exhibit 27: Threat of substitutes – Impact of key factors in 2023 and 2028
    • 5.6 Threat of rivalry
      • Exhibit 28: Threat of rivalry – Impact of key factors in 2023 and 2028
    • 5.7 Market condition
      • Exhibit 29: Chart on Market condition - Five forces 2023 and 2028

    6 Market Segmentation by Technology

    • 6.1 Market segments
      • Exhibit 30: Chart on Technology - Market share 2023-2028 (%)
      • Exhibit 31: Data Table on Technology - Market share 2023-2028 (%)
    • 6.2 Comparison by Technology
      • Exhibit 32: Chart on Comparison by Technology
      • Exhibit 33: Data Table on Comparison by Technology
    • 6.3 Transit-time - Market size and forecast 2023-2028
      • Exhibit 34: Chart on Transit-time - Market size and forecast 2023-2028 ($ million)
      • Exhibit 35: Data Table on Transit-time - Market size and forecast 2023-2028 ($ million)
      • Exhibit 36: Chart on Transit-time - Year-over-year growth 2023-2028 (%)
      • Exhibit 37: Data Table on Transit-time - Year-over-year growth 2023-2028 (%)
    • 6.4 Doppler - Market size and forecast 2023-2028
      • Exhibit 38: Chart on Doppler - Market size and forecast 2023-2028 ($ million)
      • Exhibit 39: Data Table on Doppler - Market size and forecast 2023-2028 ($ million)
      • Exhibit 40: Chart on Doppler - Year-over-year growth 2023-2028 (%)
      • Exhibit 41: Data Table on Doppler - Year-over-year growth 2023-2028 (%)
    • 6.5 Hybrid - Market size and forecast 2023-2028
      • Exhibit 42: Chart on Hybrid - Market size and forecast 2023-2028 ($ million)
      • Exhibit 43: Data Table on Hybrid - Market size and forecast 2023-2028 ($ million)
      • Exhibit 44: Chart on Hybrid - Year-over-year growth 2023-2028 (%)
      • Exhibit 45: Data Table on Hybrid - Year-over-year growth 2023-2028 (%)
    • 6.6 Market opportunity by Technology
      • Exhibit 46: Market opportunity by Technology ($ million)
      • Exhibit 47: Data Table on Market opportunity by Technology ($ million)

    7 Market Segmentation by Product

    • 7.1 Market segments
      • Exhibit 48: Chart on Product - Market share 2023-2028 (%)
      • Exhibit 49: Data Table on Product - Market share 2023-2028 (%)
    • 7.2 Comparison by Product
      • Exhibit 50: Chart on Comparison by Product
      • Exhibit 51: Data Table on Comparison by Product
    • 7.3 Spool piece ultrasonic flowmeter - Market size and forecast 2023-2028
      • Exhibit 52: Chart on Spool piece ultrasonic flowmeter - Market size and forecast 2023-2028 ($ million)
      • Exhibit 53: Data Table on Spool piece ultrasonic flowmeter - Market size and forecast 2023-2028 ($ million)
      • Exhibit 54: Chart on Spool piece ultrasonic flowmeter - Year-over-year growth 2023-2028 (%)
      • Exhibit 55: Data Table on Spool piece ultrasonic flowmeter - Year-over-year growth 2023-2028 (%)
    • 7.4 Insertion ultrasonic flowmeter - Market size and forecast 2023-2028
      • Exhibit 56: Chart on Insertion ultrasonic flowmeter - Market size and forecast 2023-2028 ($ million)
      • Exhibit 57: Data Table on Insertion ultrasonic flowmeter - Market size and forecast 2023-2028 ($ million)
      • Exhibit 58: Chart on Insertion ultrasonic flowmeter - Year-over-year growth 2023-2028 (%)
      • Exhibit 59: Data Table on Insertion ultrasonic flowmeter - Year-over-year growth 2023-2028 (%)
    • 7.5 Clamp-on ultrasonic flowmeter - Market size and forecast 2023-2028
      • Exhibit 60: Chart on Clamp-on ultrasonic flowmeter - Market size and forecast 2023-2028 ($ million)
      • Exhibit 61: Data Table on Clamp-on ultrasonic flowmeter - Market size and forecast 2023-2028 ($ million)
      • Exhibit 62: Chart on Clamp-on ultrasonic flowmeter - Year-over-year growth 2023-2028 (%)
      • Exhibit 63: Data Table on Clamp-on ultrasonic flowmeter - Year-over-year growth 2023-2028 (%)
    • 7.6 Market opportunity by Product
      • Exhibit 64: Market opportunity by Product ($ million)
      • Exhibit 65: Data Table on Market opportunity by Product ($ million)

    8 Customer Landscape

    • 8.1 Customer landscape overview
      • Exhibit 66: Analysis of price sensitivity, lifecycle, customer purchase basket, adoption rates, and purchase criteria

    9 Geographic Landscape

    • 9.1 Geographic segmentation
      • Exhibit 67: Chart on Market share by geography 2023-2028 (%)
      • Exhibit 68: Data Table on Market share by geography 2023-2028 (%)
    • 9.2 Geographic comparison
      • Exhibit 69: Chart on Geographic comparison
      • Exhibit 70: Data Table on Geographic comparison
    • 9.3 APAC - Market size and forecast 2023-2028
      • Exhibit 71: Chart on APAC - Market size and forecast 2023-2028 ($ million)
      • Exhibit 72: Data Table on APAC - Market size and forecast 2023-2028 ($ million)
      • Exhibit 73: Chart on APAC - Year-over-year growth 2023-2028 (%)
      • Exhibit 74: Data Table on APAC - Year-over-year growth 2023-2028 (%)
    • 9.4 Europe - Market size and forecast 2023-2028
      • Exhibit 75: Chart on Europe - Market size and forecast 2023-2028 ($ million)
      • Exhibit 76: Data Table on Europe - Market size and forecast 2023-2028 ($ million)
      • Exhibit 77: Chart on Europe - Year-over-year growth 2023-2028 (%)
      • Exhibit 78: Data Table on Europe - Year-over-year growth 2023-2028 (%)
    • 9.5 North America - Market size and forecast 2023-2028
      • Exhibit 79: Chart on North America - Market size and forecast 2023-2028 ($ million)
      • Exhibit 80: Data Table on North America - Market size and forecast 2023-2028 ($ million)
      • Exhibit 81: Chart on North America - Year-over-year growth 2023-2028 (%)
      • Exhibit 82: Data Table on North America - Year-over-year growth 2023-2028 (%)
    • 9.6 South America - Market size and forecast 2023-2028
      • Exhibit 83: Chart on South America - Market size and forecast 2023-2028 ($ million)
      • Exhibit 84: Data Table on South America - Market size and forecast 2023-2028 ($ million)
      • Exhibit 85: Chart on South America - Year-over-year growth 2023-2028 (%)
      • Exhibit 86: Data Table on South America - Year-over-year growth 2023-2028 (%)
    • 9.7 Middle East and Africa - Market size and forecast 2023-2028
      • Exhibit 87: Chart on Middle East and Africa - Market size and forecast 2023-2028 ($ million)
      • Exhibit 88: Data Table on Middle East and Africa - Market size and forecast 2023-2028 ($ million)
      • Exhibit 89: Chart on Middle East and Africa - Year-over-year growth 2023-2028 (%)
      • Exhibit 90: Data Table on Middle East and Africa - Year-over-year growth 2023-2028 (%)
    • 9.8 US - Market size and forecast 2023-2028
      • Exhibit 91: Chart on US - Market size and forecast 2023-2028 ($ million)
      • Exhibit 92: Data Table on US - Market size and forecast 2023-2028 ($ million)
      • Exhibit 93: Chart on US - Year-over-year growth 2023-2028 (%)
      • Exhibit 94: Data Table on US - Year-over-year growth 2023-2028 (%)
    • 9.9 China - Market size and forecast 2023-2028
      • Exhibit 95: Chart on China - Market size and forecast 2023-2028 ($ million)
      • Exhibit 96: Data Table on China - Market size and forecast 2023-2028 ($ million)
      • Exhibit 97: Chart on China - Year-over-year growth 2023-2028 (%)
      • Exhibit 98: Data Table on China - Year-over-year growth 2023-2028 (%)
    • 9.10 Germany - Market size and forecast 2023-2028
      • Exhibit 99: Chart on Germany - Market size and forecast 2023-2028 ($ million)
      • Exhibit 100: Data Table on Germany - Market size and forecast 2023-2028 ($ million)
      • Exhibit 101: Chart on Germany - Year-over-year growth 2023-2028 (%)
      • Exhibit 102: Data Table on Germany - Year-over-year growth 2023-2028 (%)
    • 9.11 India - Market size and forecast 2023-2028
      • Exhibit 103: Chart on India - Market size and forecast 2023-2028 ($ million)
      • Exhibit 104: Data Table on India - Market size and forecast 2023-2028 ($ million)
      • Exhibit 105: Chart on India - Year-over-year growth 2023-2028 (%)
      • Exhibit 106: Data Table on India - Year-over-year growth 2023-2028 (%)
    • 9.12 UK - Market size and forecast 2023-2028
      • Exhibit 107: Chart on UK - Market size and forecast 2023-2028 ($ million)
      • Exhibit 108: Data Table on UK - Market size and forecast 2023-2028 ($ million)
      • Exhibit 109: Chart on UK - Year-over-year growth 2023-2028 (%)
      • Exhibit 110: Data Table on UK - Year-over-year growth 2023-2028 (%)
    • 9.13 Market opportunity by geography
      • Exhibit 111: Market opportunity by geography ($ million)
      • Exhibit 112: Data Tables on Market opportunity by geography ($ million)

    10 Drivers, Challenges, and Trends

    • 10.1 Market drivers
      • 10.2 Market challenges
        • 10.3 Impact of drivers and challenges
          • Exhibit 113: Impact of drivers and challenges in 2023 and 2028
        • 10.4 Market trends

          11 Vendor Landscape

          • 11.1 Overview
            • 11.2 Vendor landscape
              • Exhibit 114: Overview on Criticality of inputs and Factors of differentiation
            • 11.3 Landscape disruption
              • Exhibit 115: Overview on factors of disruption
            • 11.4 Industry risks
              • Exhibit 116: Impact of key risks on business

            12 Vendor Analysis

            • 12.1 Vendors covered
              • Exhibit 117: Vendors covered
            • 12.2 Market positioning of vendors
              • Exhibit 118: Matrix on vendor position and classification
            • 12.3 Badger Meter Inc.
              • Exhibit 119: Badger Meter Inc. - Overview
              • Exhibit 120: Badger Meter Inc. - Product / Service
              • Exhibit 121: Badger Meter Inc. - Key news
              • Exhibit 122: Badger Meter Inc. - Key offerings
            • 12.4 Baker Hughes Co.
              • Exhibit 123: Baker Hughes Co. - Overview
              • Exhibit 124: Baker Hughes Co. - Business segments
              • Exhibit 125: Baker Hughes Co. - Key news
              • Exhibit 126: Baker Hughes Co. - Key offerings
              • Exhibit 127: Baker Hughes Co. - Segment focus
            • 12.5 Bronkhorst High Tech B.V.
              • Exhibit 128: Bronkhorst High Tech B.V. - Overview
              • Exhibit 129: Bronkhorst High Tech B.V. - Product / Service
              • Exhibit 130: Bronkhorst High Tech B.V. - Key offerings
            • 12.6 CMC Technologies Pty Ltd.
              • Exhibit 131: CMC Technologies Pty Ltd. - Overview
              • Exhibit 132: CMC Technologies Pty Ltd. - Product / Service
              • Exhibit 133: CMC Technologies Pty Ltd. - Key offerings
            • 12.7 Danfoss AS
              • Exhibit 134: Danfoss AS - Overview
              • Exhibit 135: Danfoss AS - Business segments
              • Exhibit 136: Danfoss AS - Key news
              • Exhibit 137: Danfoss AS - Key offerings
              • Exhibit 138: Danfoss AS - Segment focus
            • 12.8 Eesiflo Technologies Inc.
              • Exhibit 139: Eesiflo Technologies Inc. - Overview
              • Exhibit 140: Eesiflo Technologies Inc. - Product / Service
              • Exhibit 141: Eesiflo Technologies Inc. - Key offerings
            • 12.9 Emerson Electric Co.
              • Exhibit 142: Emerson Electric Co. - Overview
              • Exhibit 143: Emerson Electric Co. - Business segments
              • Exhibit 144: Emerson Electric Co. - Key news
              • Exhibit 145: Emerson Electric Co. - Key offerings
              • Exhibit 146: Emerson Electric Co. - Segment focus
            • 12.10 Endress Hauser Group Services AG
              • Exhibit 147: Endress Hauser Group Services AG - Overview
              • Exhibit 148: Endress Hauser Group Services AG - Product / Service
              • Exhibit 149: Endress Hauser Group Services AG - Key news
              • Exhibit 150: Endress Hauser Group Services AG - Key offerings
            • 12.11 Fuji Electric Co. Ltd.
              • Exhibit 151: Fuji Electric Co. Ltd. - Overview
              • Exhibit 152: Fuji Electric Co. Ltd. - Business segments
              • Exhibit 153: Fuji Electric Co. Ltd. - Key offerings
              • Exhibit 154: Fuji Electric Co. Ltd. - Segment focus
            • 12.12 General Electric Co.
              • Exhibit 155: General Electric Co. - Overview
              • Exhibit 156: General Electric Co. - Business segments
              • Exhibit 157: General Electric Co. - Key news
              • Exhibit 158: General Electric Co. - Key offerings
              • Exhibit 159: General Electric Co. - Segment focus
            • 12.13 Honeywell International Inc.
              • Exhibit 160: Honeywell International Inc. - Overview
              • Exhibit 161: Honeywell International Inc. - Business segments
              • Exhibit 162: Honeywell International Inc. - Key news
              • Exhibit 163: Honeywell International Inc. - Key offerings
              • Exhibit 164: Honeywell International Inc. - Segment focus
            • 12.14 Katronic AG and Co. KG
              • Exhibit 165: Katronic AG and Co. KG - Overview
              • Exhibit 166: Katronic AG and Co. KG - Product / Service
              • Exhibit 167: Katronic AG and Co. KG - Key offerings
            • 12.15 KROHNE Messtechnik GmbH
              • Exhibit 168: KROHNE Messtechnik GmbH - Overview
              • Exhibit 169: KROHNE Messtechnik GmbH - Product / Service
              • Exhibit 170: KROHNE Messtechnik GmbH - Key offerings
            • 12.16 Siemens AG
              • Exhibit 171: Siemens AG - Overview
              • Exhibit 172: Siemens AG - Business segments
              • Exhibit 173: Siemens AG - Key news
              • Exhibit 174: Siemens AG - Key offerings
              • Exhibit 175: Siemens AG - Segment focus
            • 12.17 Teledyne Technologies Inc.
              • Exhibit 176: Teledyne Technologies Inc. - Overview
              • Exhibit 177: Teledyne Technologies Inc. - Business segments
              • Exhibit 178: Teledyne Technologies Inc. - Key news
              • Exhibit 179: Teledyne Technologies Inc. - Key offerings
              • Exhibit 180: Teledyne Technologies Inc. - Segment focus

            13 Appendix

            • 13.1 Scope of the report
              • 13.2 Inclusions and exclusions checklist
                • Exhibit 181: Inclusions checklist
                • Exhibit 182: Exclusions checklist
              • 13.3 Currency conversion rates for US$
                • Exhibit 183: Currency conversion rates for US$
              • 13.4 Research methodology
                • Exhibit 184: Research methodology
                • Exhibit 185: Validation techniques employed for market sizing
                • Exhibit 186: Information sources
              • 13.5 List of abbreviations
                • Exhibit 187: List of abbreviations

              Research Methodology

              Technavio presents a detailed picture of the market by way of study, synthesis, and summation of data from multiple sources. The analysts have presented the various facets of the market with a particular focus on identifying the key industry influencers. The data thus presented is comprehensive, reliable, and the result of extensive research, both primary and secondary.

              INFORMATION SOURCES

              Primary sources

              • Manufacturers and suppliers
              • Channel partners
              • Industry experts
              • Strategic decision makers

              Secondary sources

              • Industry journals and periodicals
              • Government data
              • Financial reports of key industry players
              • Historical data
              • Press releases

              DATA ANALYSIS

              Data Synthesis

              • Collation of data
              • Estimation of key figures
              • Analysis of derived insights

              Data Validation

              • Triangulation with data models
              • Reference against proprietary databases
              • Corroboration with industry experts

              REPORT WRITING

              Qualitative

              • Market drivers
              • Market challenges
              • Market trends
              • Five forces analysis

              Quantitative

              • Market size and forecast
              • Market segmentation
              • Geographical insights
              • Competitive landscape

              Interested in this report?

              Get your sample now to see our research methodology and insights!

              Download Now

              Frequently Asked Questions

              Ultrasonic Flowmeter market growth will increase by 1363.18 million during 2024-2028 .

              The Ultrasonic Flowmeter market is expected to grow at a CAGR of 6.87% during 2024-2028 .

              Ultrasonic Flowmeter market is segmented by Technology( Transit-time, Doppler, Hybrid) Product( Spool piece ultrasonic flowmeter, Insertion ultrasonic flowmeter, Clamp-on ultrasonic flowmeter)

              Badger Meter Inc., Baker Hughes Co., Bronkhorst High Tech B.V., CMC Technologies Pty Ltd., Danfoss AS, Eesiflo Technologies Inc., Emerson Electric Co., Endress Hauser Group Services AG, FOX THERMAL INSTRUMENTS INC., Fuji Electric Co. Ltd., General Electric Co., Honeywell International Inc., IDEX Corp., Katronic AG and Co. KG, KROHNE Messtechnik GmbH, Omega Engineering Inc., Roper Technologies Inc., Siemens AG, Teledyne Technologies Inc., Fluenta AS are a few of the key vendors in the Ultrasonic Flowmeter market.

              APAC will register the highest growth rate of 28.94% among the other regions. Therefore, the Ultrasonic Flowmeter market in APAC is expected to garner significant business opportunities for the vendors during the forecast period.

              US, China, India, Germany, UK

              • Increased adoption of ultrasonic flowmeters in various industriesUltrasonic flowmeters are increasingly being adopted across a wide range of industries is the driving factor this market.
              • including oil and gas is the driving factor this market.
              • water and wastewater management is the driving factor this market.
              • chemicals is the driving factor this market.
              • and pharmaceuticals. This growing diversity of applications is driving market expansion. Ultrasonic flowmeters are used for measuring the flow of crude oil is the driving factor this market.
              • natural gas is the driving factor this market.
              • and refined petroleum products. They are vital for custody transfer is the driving factor this market.
              • process control is the driving factor this market.
              • and monitoring of pipeline transportation. In water and wastewater management is the driving factor this market.
              • ultrasonic flowmeters are employed for measuring clean water is the driving factor this market.
              • wastewater is the driving factor this market.
              • and sludge flow rates. They are crucial for billing is the driving factor this market.
              • process optimization is the driving factor this market.
              • and environmental compliance. Ultrasonic flowmeters are used to measure various chemicals and fluids in industrial processes. They are chosen for their accuracy is the driving factor this market.
              • non-invasive nature is the driving factor this market.
              • and compatibility with a wide range of chemical substances. Ultrasonic flowmeters play a role in pharmaceutical manufacturing is the driving factor this market.
              • particularly in monitoring the flow of liquids and gases in critical processes is the driving factor this market.
              • ensuring quality and consistency. The increasing adoption of ultrasonic flowmeters across these industries is driven by the need for accurate is the driving factor this market.
              • reliable is the driving factor this market.
              • and non-invasive flow measurement solutions. As technology continues to evolve is the driving factor this market.
              • ultrasonic flowmeters are likely to find applications in even more sectors and niches as their capabilities and versatility continue to expand is the driving factor this market.
              • which will have a positive impact on the growth of the global ultrasonic flowmeter market during the forecast period. is the driving factor this market.

              The Ultrasonic Flowmeter market vendors should focus on grabbing business opportunities from the Transit-time segment as it accounted for the largest market share in the base year.