Ultrasound Equipment Market Size 2026-2030
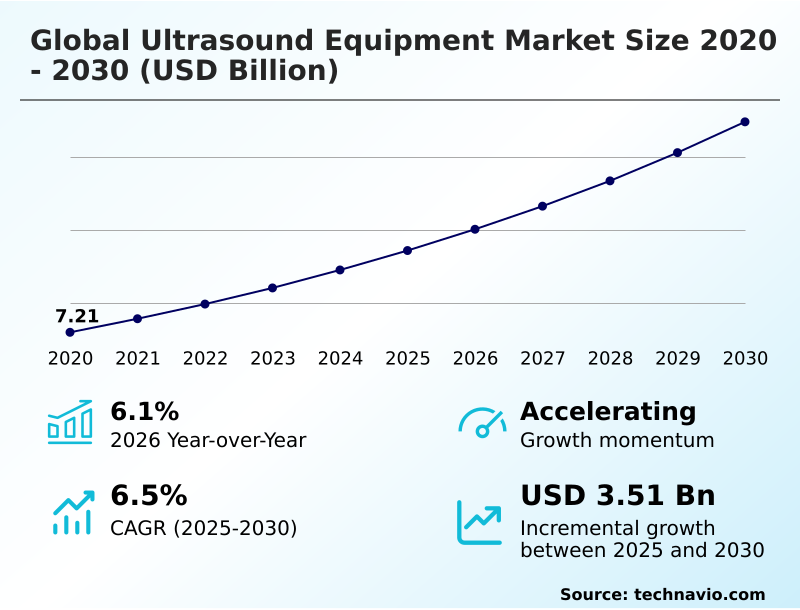
The ultrasound equipment market size is valued to increase by USD 3.51 billion, at a CAGR of 6.5% from 2025 to 2030. Broader applications of ultrasound equipment will drive the ultrasound equipment market.
Major Market Trends & Insights
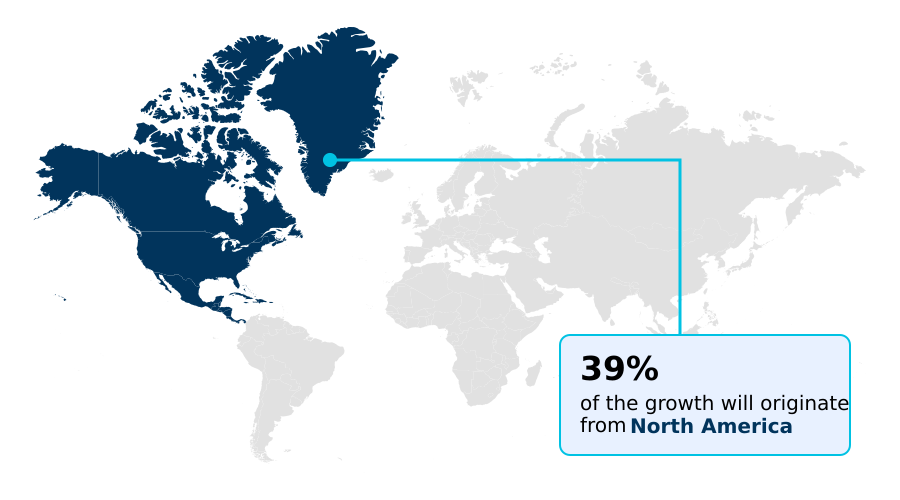
- North America dominated the market and accounted for a 38.7% growth during the forecast period.
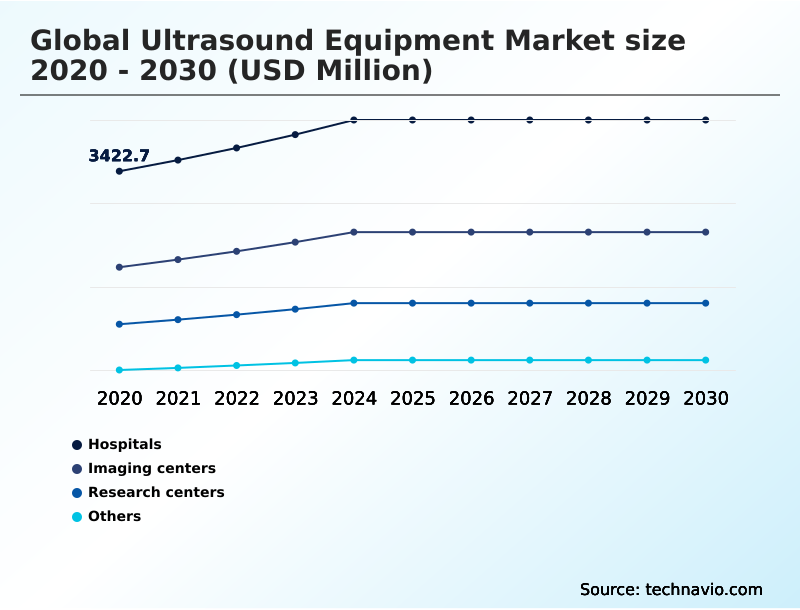
- By End-user - Hospitals segment was valued at USD 4.16 billion in 2024
- By Product Type - Stationary ultrasound equipment segment accounted for the largest market revenue share in 2024
Market Size & Forecast
- Market Opportunities: USD 5.74 billion
- Market Future Opportunities: USD 3.51 billion
- CAGR from 2025 to 2030 : 6.5%
Market Summary
- The Ultrasound Equipment Market is undergoing a significant transformation, driven by technological advancements and shifting healthcare paradigms. The increasing emphasis on early diagnosis and preventive medicine has broadened the scope of applications for these systems far beyond traditional radiology and obstetrics.
- Innovations in transducer technology and real-time 3D/4D imaging are enhancing diagnostic accuracy, while the development of portable and handheld ultrasound devices is decentralizing care, enabling rapid point-of-care ultrasound (POCUS) assessments in emergency rooms, clinics, and even remote settings.
- For example, a regional health network can strategically deploy cloud-connected ultrasound platforms to standardize diagnostic quality across its facilities, enabling remote consultations and reducing the need for patient transfers. However, challenges such as the high cost of advanced systems and the need for stringent regulatory compliance for software-driven features like AI-powered image enhancement moderate the pace of adoption.
- The convergence of AI, miniaturization, and connectivity continues to redefine the market's trajectory, moving toward more accessible, intelligent, and integrated diagnostic solutions.
What will be the Size of the Ultrasound Equipment Market during the forecast period?
Get Key Insights on Market Forecast (PDF) Get Free Sample
How is the Ultrasound Equipment Market Segmented?
The ultrasound equipment industry research report provides comprehensive data (region-wise segment analysis), with forecasts and estimates in "USD million" for the period 2026-2030, as well as historical data from 2020-2024 for the following segments.
- End-user
- Hospitals
- Imaging centers
- Research centers
- Others
- Product type
- Stationary ultrasound equipment
- Portable ultrasound equipment
- Technology
- 2D ultrasound
- 3D and 4D ultrasound
- Doppler ultrasound
- Geography
- North America
- US
- Canada
- Mexico
- Europe
- Germany
- UK
- France
- Asia
- Rest of World (ROW)
- North America
By End-user Insights
The hospitals segment is estimated to witness significant growth during the forecast period.
Hospitals remain the primary end-user segment, driving demand for advanced stationary and portable ultrasound equipment.
These institutions require versatile platforms that support a wide range of applications, from emergency bedside diagnostics using point-of-care ultrasound (POCUS) to complex procedures like image-guided biopsies.
The need for seamless integration with electronic health records and PACS is critical, promoting the adoption of cloud-connected ultrasound systems.
Investment is focused on high-performance hardware featuring advanced transducer technology and AI-powered image enhancement to improve diagnostic accuracy and workflow efficiency. For instance, facilities implementing automated fetal biometry automation have reported a 20% reduction in sonographer measurement time.
This focus on both high-throughput stationary systems and flexible handheld ultrasound devices solidifies the hospital segment's foundational role in the market.
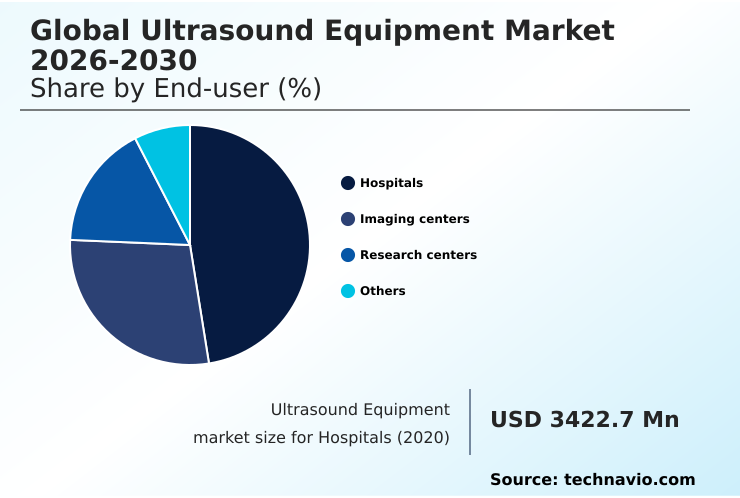
The Hospitals segment was valued at USD 4.16 billion in 2024 and showed a gradual increase during the forecast period.
Regional Analysis
North America is estimated to contribute 38.7% to the growth of the global market during the forecast period.Technavio’s analysts have elaborately explained the regional trends and drivers that shape the market during the forecast period.
See How Ultrasound Equipment Market Demand is Rising in North America Get Free Sample
The geographic landscape of the market is characterized by a mix of mature and high-growth regions.
North America maintains a significant market share, driven by high healthcare spending and rapid adoption of premium technologies like real-time 3D/4D imaging and AI-powered diagnostic tools. Europe follows, with a strong emphasis on value-based healthcare and regulatory compliance.
However, Asia is the fastest-growing region, with a CAGR of 7.4%, representing over 30% of the incremental growth opportunity.
This expansion is fueled by government initiatives to modernize healthcare infrastructure and the rising demand for affordable diagnostic solutions in countries like China and India.
The deployment of portable ultrasound scanners in these emerging markets is crucial for addressing healthcare access disparities, with some programs improving prenatal screening availability in remote areas by over 40%.
Market Dynamics
Our researchers analyzed the data with 2025 as the base year, along with the key drivers, trends, and challenges. A holistic analysis of drivers will help companies refine their marketing strategies to gain a competitive advantage.
- Strategic decision-making in the global ultrasound equipment market 2026-2030 is increasingly complex, influenced by the interplay between technological innovation and economic pressures. Healthcare providers must weigh the benefits of AI in ultrasound for diagnostic accuracy against the costs of implementation and training. The debate over stationary vs.
- portable ultrasound cost-effectiveness is central to procurement strategies, with many institutions adopting hybrid models. Portable devices are proving essential for improving care in rural clinics, while high-end stationary systems remain the standard for specialized hospital departments. The impact of regulatory compliance on ultrasound development continues to shape product roadmaps, as manufacturers navigate varying international standards.
- Moreover, the role of ultrasound in preventive medicine is expanding, compelling a shift in how these technologies are integrated into primary care pathways. As evidence of clinical efficacy grows, ultrasound equipment for home monitoring is emerging as a new frontier.
- Facilities adopting systems with advanced workflow automation report efficiency gains that are nearly double those of centers relying on legacy equipment, highlighting the tangible benefits of technological upgrades in a value-driven healthcare environment. The market's future will be defined by how vendors and providers balance these competing priorities to deliver accessible, high-quality care.
What are the key market drivers leading to the rise in the adoption of Ultrasound Equipment Industry?
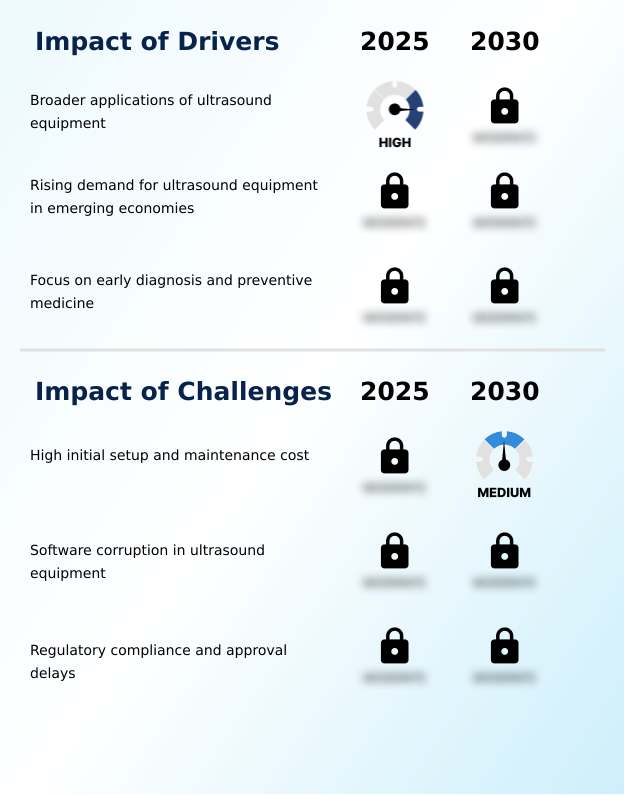
- The expansion of ultrasound equipment into broader clinical and non-clinical applications is a key driver for market growth.
- Market growth is sustained by several key drivers, primarily the broadening applications of ultrasound technology. Beyond traditional diagnostics, its use in interventional ultrasound for guiding minimally invasive procedures has expanded its presence in surgical settings.
- The rising demand from emerging economies, where governments are investing in healthcare infrastructure, provides a significant tailwind, with portable systems addressing the need for cost-effective diagnostics.
- For instance, some national health programs have increased access to prenatal screenings in rural areas by over 30% through mobile ultrasound initiatives. The global focus on preventive medicine further drives demand, as non-invasive ultrasound is ideal for routine screening.
- The use of cardiac ultrasound assessment for early detection of cardiovascular issues can lower long-term treatment costs by up to 20%.
What are the market trends shaping the Ultrasound Equipment Industry?
- A key trend shaping the market is the integration of AI-powered image enhancement. This technology is driving significant workflow automation and diagnostic improvements.
- Key trends reshaping the market are centered on intelligence, connectivity, and portability. The adoption of AI-powered image enhancement is a primary trend, where deep learning algorithms automate repetitive tasks and improve diagnostic consistency; some systems reduce cardiac measurement times by over 40%.
- This is complemented by the rise of wireless, cloud-connected ultrasound platforms, which streamline data management and enable tele-ultrasound consultations, cutting down image review turnaround times by as much as 50% in multi-site health systems. Concurrently, the expansion of point-of-care ultrasound (POCUS) is democratizing diagnostics, with handheld ultrasound devices empowering clinicians to make immediate decisions at the bedside.
- This shift toward portable ultrasound scanners is driven by their ability to reduce diagnostic delays and improve patient throughput in crowded emergency departments and outpatient clinics.
What challenges does the Ultrasound Equipment Industry face during its growth?
- The high initial setup and ongoing maintenance costs for advanced ultrasound systems present a significant challenge to market growth.
- Despite strong growth drivers, the market faces several challenges. The high initial setup and maintenance costs of advanced systems remain a significant barrier, particularly for smaller clinics and facilities in resource-limited regions. Software corruption and cybersecurity vulnerabilities in increasingly complex, connected systems pose a critical risk; unplanned downtime can reduce departmental efficiency by as much as 15%.
- Navigating the fragmented landscape of regulatory compliance and approval delays presents another major hurdle for manufacturers. Introducing novel features, especially those involving AI, can extend product launch timelines by 18-24 months, slowing innovation and increasing development costs. These factors collectively temper market expansion by constraining affordability, introducing operational risks, and impeding the rapid commercialization of next-generation technologies.
Exclusive Technavio Analysis on Customer Landscape
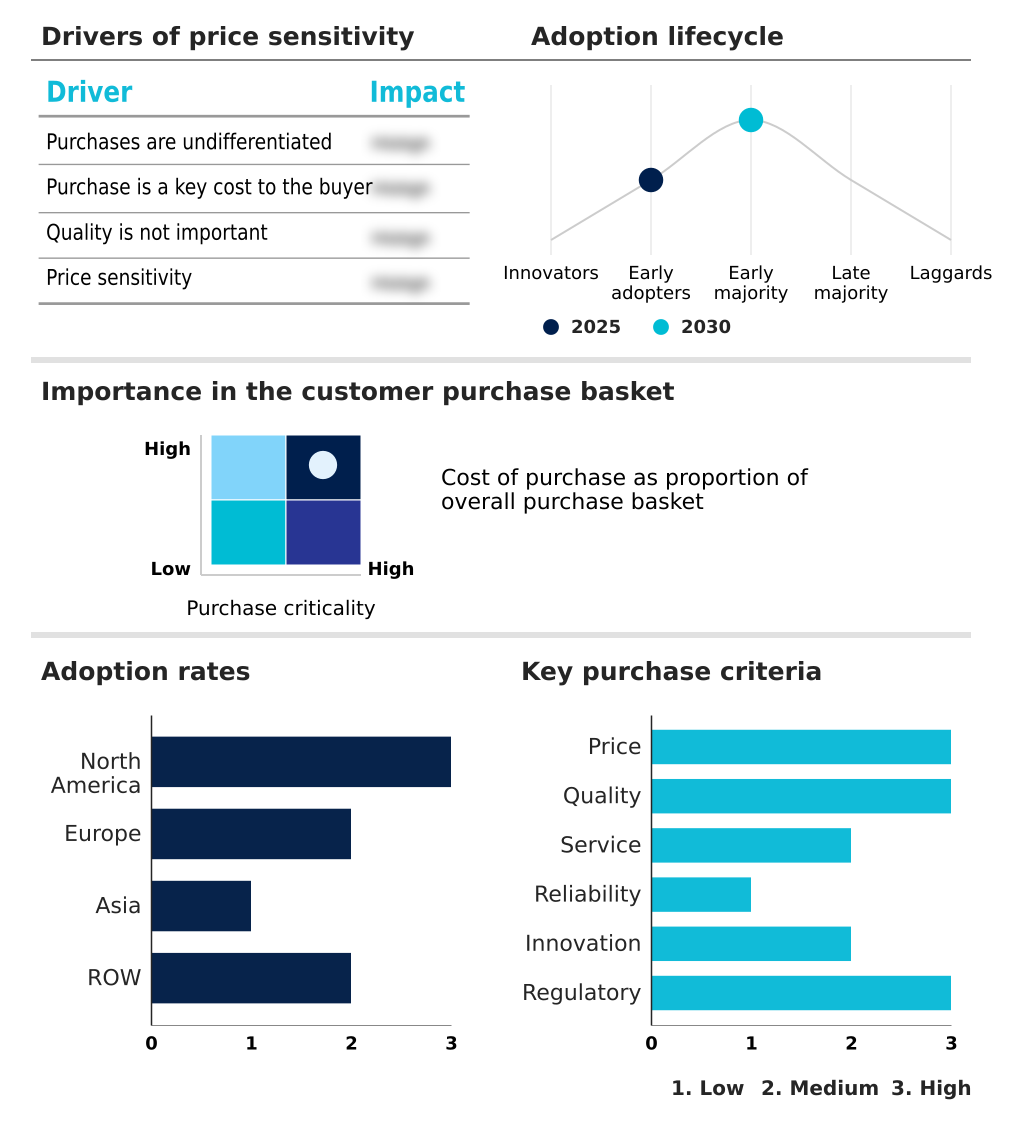
The ultrasound equipment market forecasting report includes the adoption lifecycle of the market, covering from the innovator’s stage to the laggard’s stage. It focuses on adoption rates in different regions based on penetration. Furthermore, the ultrasound equipment market report also includes key purchase criteria and drivers of price sensitivity to help companies evaluate and develop their market growth analysis strategies.
Customer Landscape of Ultrasound Equipment Industry
Competitive Landscape
Companies are implementing various strategies, such as strategic alliances, ultrasound equipment market forecast, partnerships, mergers and acquisitions, geographical expansion, and product/service launches, to enhance their presence in the industry.
Boston Scientific Corp. - Key offerings include advanced diagnostic imaging solutions integrating AI, cloud connectivity, and high-resolution transducers to enhance clinical workflows and diagnostic precision across multiple care settings.
The industry research and growth report includes detailed analyses of the competitive landscape of the market and information about key companies, including:
- Boston Scientific Corp.
- Chison Medical Technologies Co
- ContextVision AB
- Esaote SpA
- FUJIFILM Holdings Corp.
- GE HealthCare Technologies
- Canon Inc.
- GlobalMedia Group LLC
- Healcerion Co. Ltd.
- Hologic Inc.
- Konica Minolta Inc.
- Shenzhen Mindray Co. Ltd.
- Koninklijke Philips N.V.
- Samsung Electronics Co. Ltd.
- Siemens AG
- Sonostar
- Shenzhen Bestman Instrument Co
- Telemed Ultrasound
- Trivitron Healthcare
Qualitative and quantitative analysis of companies has been conducted to help clients understand the wider business environment as well as the strengths and weaknesses of key industry players. Data is qualitatively analyzed to categorize companies as pure play, category-focused, industry-focused, and diversified; it is quantitatively analyzed to categorize companies as dominant, leading, strong, tentative, and weak.
Recent Development and News in Ultrasound equipment market
- In August 2025, Philips announced a $150 million investment to expand its Pennsylvania ultrasound manufacturing facility, enhancing production of AI-based systems and software for cardiovascular and maternal care.
- In March 2025, NVIDIA and GE HealthCare announced a collaboration to advance autonomous diagnostic imaging by leveraging the NVIDIA Isaac for Healthcare simulation platform to accelerate the development of AI-driven ultrasound systems.
- In November 2025, Samsung launched the AI-powered R20 ultrasound system, introducing its Crystal Architecture platform to deliver enhanced image clarity and automated measurements for general imaging applications.
- In June 2025, Philips launched the Flash 5100 POC ultrasound system, a highly portable platform combining advanced imaging, smart automation, and real-time workflow for critical and emergency care settings.
Dive into Technavio’s robust research methodology, blending expert interviews, extensive data synthesis, and validated models for unparalleled Ultrasound Equipment Market insights. See full methodology.
| Market Scope | |
|---|---|
| Page number | 297 |
| Base year | 2025 |
| Historic period | 2020-2024 |
| Forecast period | 2026-2030 |
| Growth momentum & CAGR | Accelerate at a CAGR of 6.5% |
| Market growth 2026-2030 | USD 3512.2 million |
| Market structure | Fragmented |
| YoY growth 2025-2026(%) | 6.1% |
| Key countries | US, Canada, Mexico, Germany, UK, France, Italy, Spain, Russia, China, India, Japan, South Korea, Indonesia, Thailand, Brazil, Saudi Arabia, UAE, Nigeria, Argentina, Colombia, South Africa and Israel |
| Competitive landscape | Leading Companies, Market Positioning of Companies, Competitive Strategies, and Industry Risks |
Research Analyst Overview
- The ultrasound equipment market is characterized by rapid innovation, where software-defined capabilities are becoming as crucial as hardware performance. Core technologies such as advanced transducer technology, real-time 3D/4D imaging, and sophisticated signal processing continue to evolve, enhancing image quality and diagnostic confidence.
- The integration of AI-powered image enhancement and workflow automation is a key differentiator, with systems demonstrating over a 30% improvement in measurement consistency across different operators. This trend is compelling a strategic shift at the boardroom level, as procurement decisions now involve evaluating subscription-based software models versus traditional capital expenditures.
- The expansion into new applications, including interventional ultrasound and point-of-care ultrasound (POCUS), is broadening the user base beyond traditional radiology. Furthermore, the development of portable and handheld ultrasound devices, often paired with cloud-connected ultrasound platforms, is democratizing access to diagnostic imaging, enabling use in diverse clinical settings and supporting tele-ultrasound initiatives.
What are the Key Data Covered in this Ultrasound Equipment Market Research and Growth Report?
-
What is the expected growth of the Ultrasound Equipment Market between 2026 and 2030?
-
USD 3.51 billion, at a CAGR of 6.5%
-
-
What segmentation does the market report cover?
-
The report is segmented by End-user (Hospitals, Imaging centers, Research centers, and Others), Product Type (Stationary ultrasound equipment, and Portable ultrasound equipment), Technology (2D ultrasound, 3D and 4D ultrasound, and Doppler ultrasound) and Geography (North America, Europe, Asia, Rest of World (ROW))
-
-
Which regions are analyzed in the report?
-
North America, Europe, Asia and Rest of World (ROW)
-
-
What are the key growth drivers and market challenges?
-
Broader applications of ultrasound equipment, High initial setup and maintenance cost
-
-
Who are the major players in the Ultrasound Equipment Market?
-
Boston Scientific Corp., Chison Medical Technologies Co, ContextVision AB, Esaote SpA, FUJIFILM Holdings Corp., GE HealthCare Technologies, Canon Inc., GlobalMedia Group LLC, Healcerion Co. Ltd., Hologic Inc., Konica Minolta Inc., Shenzhen Mindray Co. Ltd., Koninklijke Philips N.V., Samsung Electronics Co. Ltd., Siemens AG, Sonostar, Shenzhen Bestman Instrument Co, Telemed Ultrasound and Trivitron Healthcare
-
Market Research Insights
- Market dynamics are increasingly shaped by the push for operational efficiency and improved clinical outcomes. The adoption of tele-ultrasound platforms has been shown to expand specialist access to underserved areas, improving diagnostic service coverage by over 30% in some rural health programs.
- Furthermore, the integration of ultrasound workflow automation tools can reduce examination times by up to 25%, allowing for higher patient throughput. As healthcare providers prioritize value-based care, technologies that demonstrate clear ROI, such as portable ultrasound scanners that minimize the need for costly departmental scans, are gaining traction.
- This shift is compelling manufacturers to focus on software-driven features and flexible deployment models to meet evolving customer demands for both performance and economic efficiency.
We can help! Our analysts can customize this ultrasound equipment market research report to meet your requirements.
 RIA -
RIA - 
