US|North America Snack Bars Market Analysis, Size, and Forecast 2024-2028

US|North America Snack Bars Market Analysis, Size, and Forecast 2024-2028

Published: May 2024 140 Pages SKU: IRTNTR41135

Market Overview at a Glance

$886.7 Mn
Market Opportunity
2.17%
CAGR
2.11
YoY growth 2023-2024(%)

US Snack Bars Market Size 2024-2028 

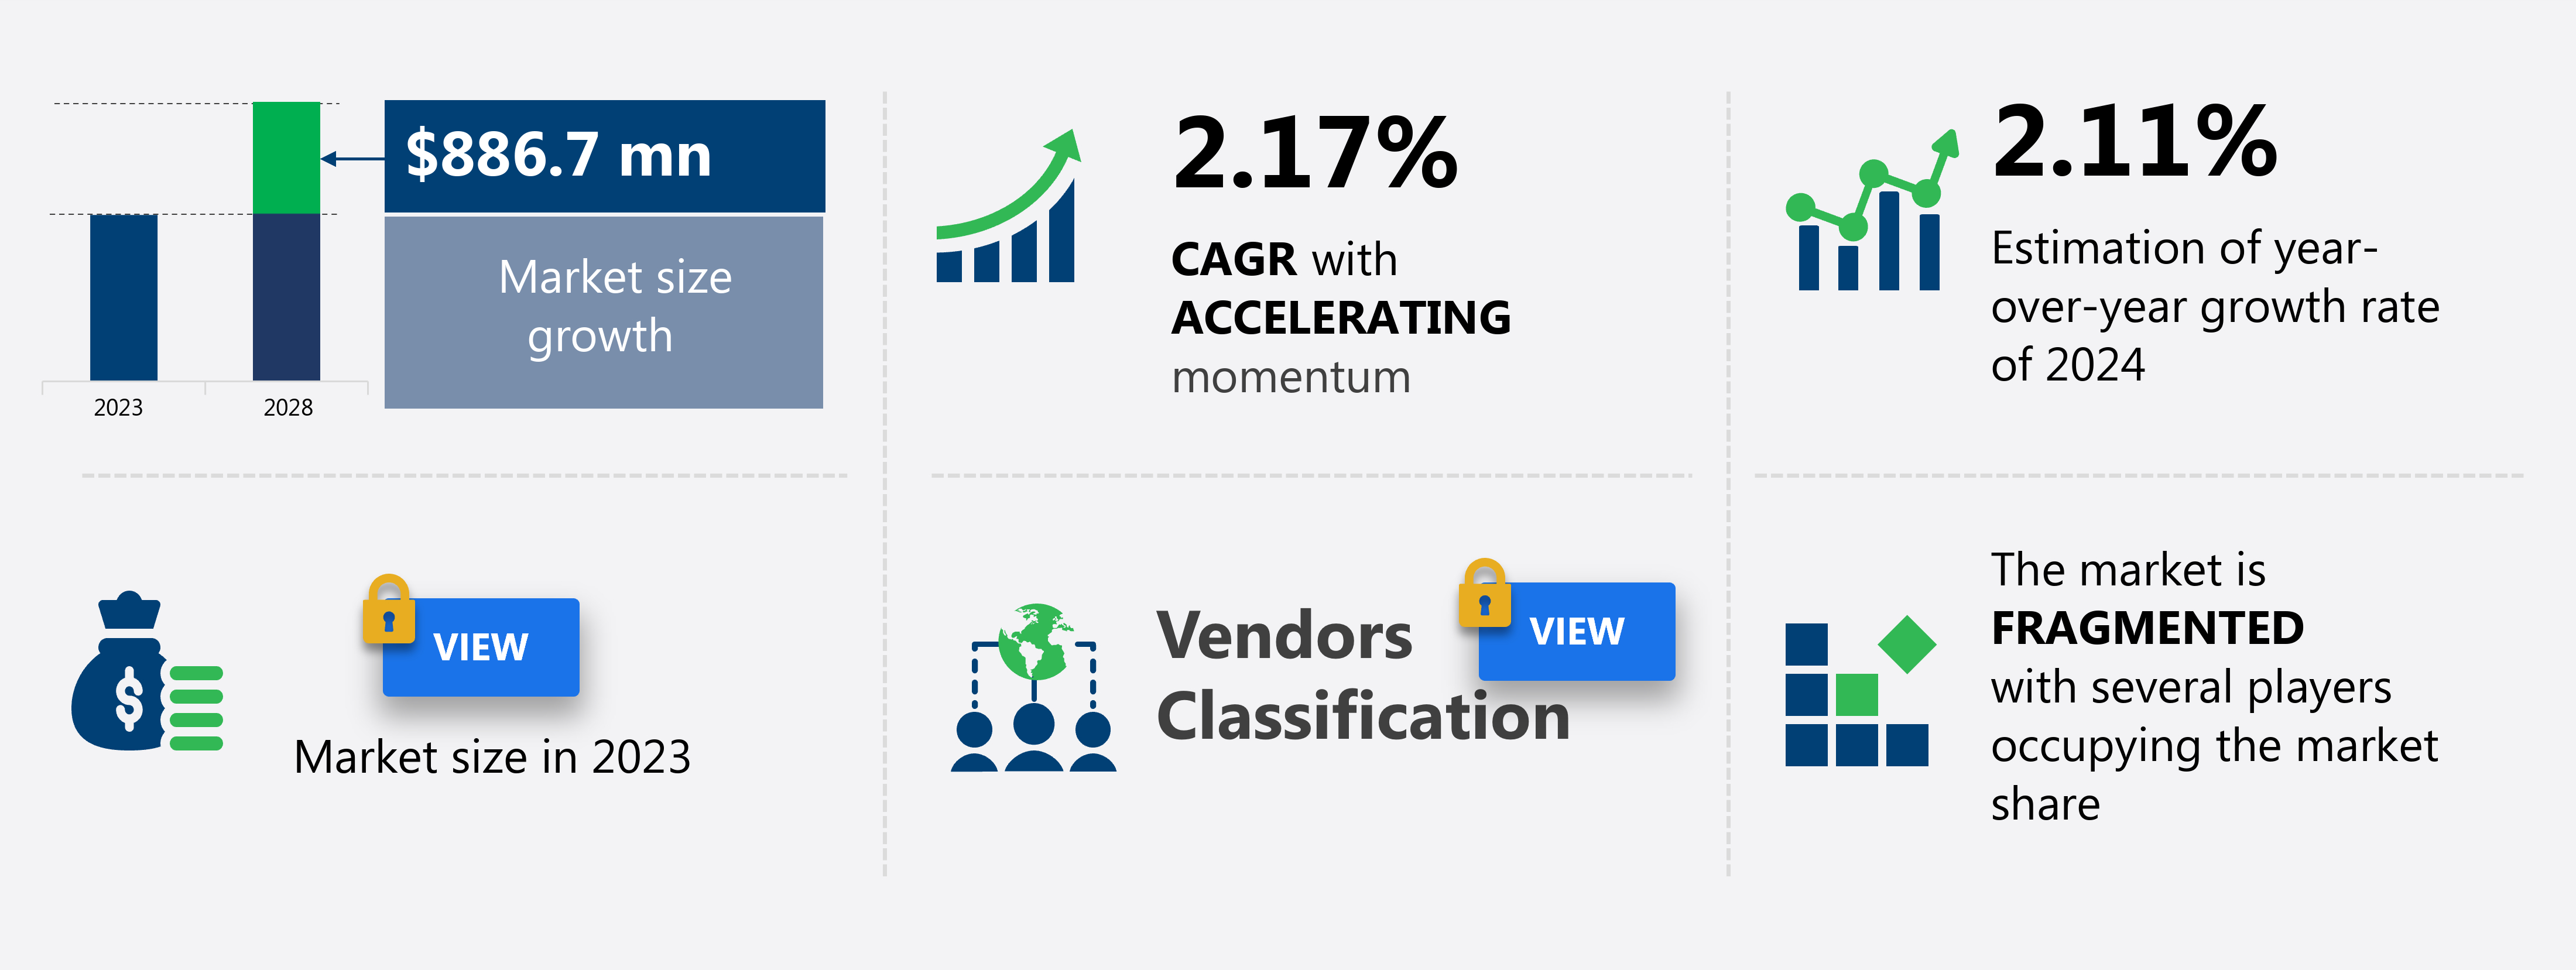
The US snack bars market size is forecast to increase by USD 886.7 million at a CAGR of 2.17% between 2023 and 2028.

  • The Snack Bars market in the US is witnessing significant growth, driven by the increasing preference for convenient and nutritious on-the-go food options. The rising trend of consumers opting for breakfast alternatives that can be easily carried and consumed during busy workdays is fueling the demand for snack bars. The online retail channel is experiencing significant growth due to increasing internet penetration and smartphone usage. Grocery delivery chains further boost online sales. Grocery delivery chains and convenience stores are other significant distribution channels for snack bars in the US. However, the market faces challenges, including the risk of product recalls due to contamination issues, which can negatively impact brand reputation and consumer trust. Companies must prioritize food safety and quality control measures to mitigate these risks and maintain consumer confidence.
  • Additionally, the competitive landscape is intensifying, with numerous players vying for market share. To capitalize on opportunities, companies must differentiate their offerings through unique flavors, innovative ingredients, and targeted marketing strategies. Adapting to evolving consumer preferences and navigating regulatory requirements will be crucial for success in the Snack Bars market.

What will be the size of the US Snack Bars Market during the forecast period?

Snack Bars Market in US Size

 Explore in-depth regional segment analysis with market size data - historical 2018-2022 and forecasts 2024-2028 - in the full report.  
Request Free Sample

  • The US snack bar market exhibits dynamic trends, with a focus on organic certification, functional ingredients, and convenient packaging design. Impulse buying drives sales, particularly for dairy-free, gluten-free, and weight management options. Prebiotic additions and probiotic supplements enhance consumer appeal, while sports nutrition and energy bars cater to active lifestyles. Brands prioritize customer satisfaction and brand loyalty through GMO-free, low-sugar, and high-protein offerings.
  • Meal replacement and vegetarian bars cater to diverse dietary needs, with nut-free, soy-free, added minerals, and added vitamins options also available. The product lifecycle of snack bars continues to evolve, with on-the-go convenience, healthy snacking, and portable snacking remaining key drivers.

How is this market segmented?

The market research report provides comprehensive data (region-wise segment analysis), with forecasts and estimates in "USD million" for the period 2024-2028, as well as historical data from 2018-2022 for the following segments.
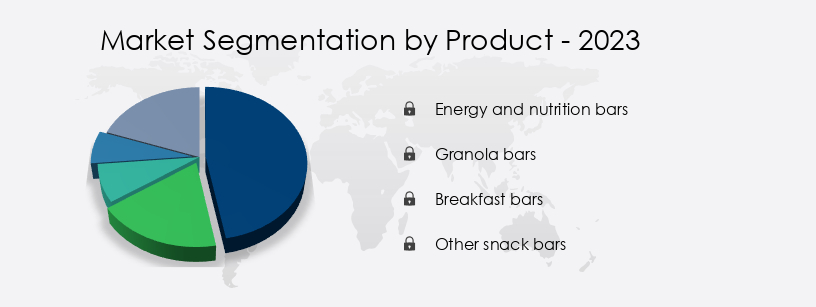
  • Product
    • Energy and nutrition bars
    • Granola bars
    • Breakfast bars
    • Other snack bars
  • Distribution Channel
    • Offline distribution
    • Online distribution
  • Flavor
    • Sweet
    • Savory
    • Nutty
    • Fruity
    • Chocolate
  • Nature
    • Conventional
    • Organic
    • Gluten-Free
    • Vegan
  • Geography
    • North America
      • US

By Product Insights

The energy and nutrition bars segment is estimated to witness significant growth during the forecast period.

The snack bar market in the US is witnessing significant growth due to the increasing preference for convenient, nutritious, and functional food options. Direct-to-consumer sales are gaining traction as consumers seek personalized and customized snack bar varieties. Texture analysis and sensory evaluation are crucial in the manufacturing process to ensure consumer satisfaction and product consistency. Production efficiency and ingredient traceability are essential for maintaining cost optimization and ensuring food safety regulations. New product development is a key trend, with a focus on reducing sugar content, increasing protein content, and incorporating fiber and health claims. Brand positioning and pricing strategies vary based on target audience demographics and consumer preferences.

Retail landscape and distribution channels are evolving, with e-commerce sales and wholesale distribution becoming increasingly important. Shelf life, ingredient combinations, and nutritional labeling are critical factors in product formulation and quality control. Competitor analysis and supply chain management are essential for cost optimization and ingredient sourcing. Consumer demographics and flavor profiles influence sales channels and product innovation. The market is expected to continue growing as consumers seek functional and convenient snack options, with a focus on cost optimization, ingredient traceability, and food safety regulations.

Snack Bars Market in US Share by Product

Request Free Sample

The Energy and nutrition bars segment was valued at  USD 3959.40 million in 2018 and showed a gradual increase during the forecast period.

Market Dynamics


The US snack bars market is thriving, driven by demand for healthy snack bars like protein bars, energy bars, and plant-based snack bars. Consumers seek organic snack bars, gluten-free snack bars, and vegan snack bars for health-conscious diets. Low-sugar snack bars and meal replacement bars cater to weight loss and on-the-go snacking needs. Innovations like functional ingredient snack bars, sustainable packaging snack bars, and clean label snack bars appeal to eco-conscious buyers. Niche products, such as best protein bars for fitness in US, organic snack bars for healthy eating, and vegan snack bars for plant-based diets, dominate searches. Snack bars with superfoods USA and eco-friendly packaging snack bars reflect evolving preferences, boosting market growth.

Our researchers analyzed the data with 2023 as the base year, along with the key drivers, trends, and challenges. A holistic analysis of drivers will help companies refine their marketing strategies to gain a competitive advantage.

What are the US Snack Bars Market market drivers leading to the rise in adoption of the Industry?

  • The introduction of new products serves as the primary catalyst for market growth. 
  • The snack bars market in the US is experiencing growth due to the rising demand for convenient and nutritious food options. New product launches have been a significant factor fueling market expansion. For instance, in February 2023, Natural Balance Foods introduced Nakd Fruit and Fibre bars, featuring Apple and Cinnamon, and Strawberry and Raspberry flavors. Quaker Oats, a subsidiary of PepsiCo Inc., also entered the market with Quaker Chewy Granola bars in October 2022.
  • These new offerings cater to consumers' increasing preference for snack bars as meal replacements or between-meal options. The convenience they provide, coupled with their nutritional value, makes them an attractive choice for health-conscious consumers.

What are the US Snack Bars Market market trends shaping the Industry?

  • The increasing preference for convenient breakfast solutions is a notable trend in the current market. On-the-go options, such as grab-and-go meals and ready-to-eat cereals, are in high demand among consumers seeking efficiency and flexibility in their morning routines.
  • The snack bars market in the US is experiencing significant growth due to the increasing preference for convenient and nutritious on-the-go breakfast options among consumers. Direct-to-consumer sales and new product development are key market trends driving this growth. Consumers value the texture analysis and production efficiency of snack bars, making them an attractive choice for breakfast. Moreover, ingredient traceability and adherence to food safety regulations are crucial factors influencing the market. The manufacturing process is continually evolving to reduce fat and sugar content while maintaining taste and appeal.
  • These factors collectively contribute to the market's growth during the forecast period. Snack bars offer a harmonious blend of convenience and nutrition, making them an immersive and thematically emphasized breakfast alternative for time-pressed consumers.

How does US Snack Bars Market market faces challenges face during its growth?

  • Product recalls pose a significant challenge to industry growth, as companies must address safety concerns and restore consumer trust following the withdrawal of faulty products from the market. 
  • The snack bars market in the US is characterized by intense competition and a focus on brand positioning based on protein content, calorie count, and sensory evaluation. The retail landscape is diverse, with sales channels ranging from supermarkets and convenience stores to online platforms. companies prioritize the use of packaging materials that ensure product freshness and consumer convenience. However, product recalls due to contamination or incorrect labeling can significantly impact a company's brand image and sales. For instance, a protein bar manufacturer, Built Brands, recalled its Banana Cream Pie Puffs in June 2022.
  • Competitor analysis plays a crucial role in market dynamics, with companies constantly innovating to meet the evolving preferences of their target audience. In this context, maintaining product safety and quality is essential to mitigate risks and sustain long-term growth.

Exclusive US Snack Bars Market Customer Landscape

The market forecasting report includes the adoption lifecycle of the market, covering from the innovator's stage to the laggard's stage. It focuses on adoption rates in different regions based on penetration. Furthermore, the report also includes key purchase criteria and drivers of price sensitivity to help companies evaluate and develop their market growth analysis strategies.
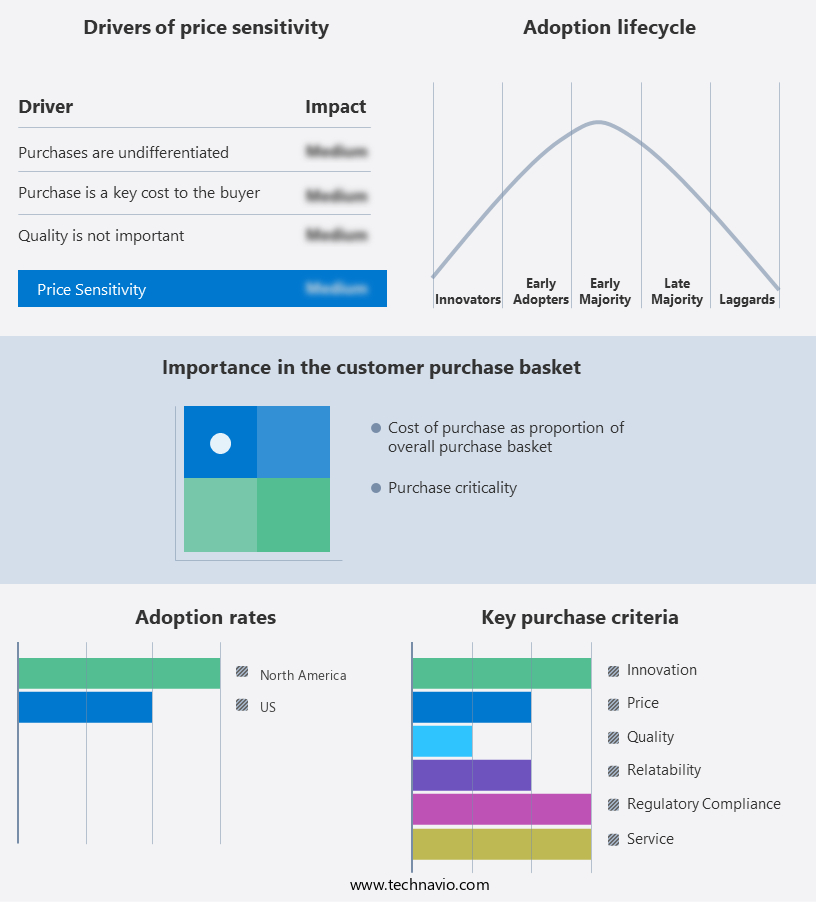
Snack Bars Market in US Share by Geography

 Customer Landscape

Key Companies & Market Insights

Companies are implementing various strategies, such as strategic alliances, market forecast partnerships, mergers and acquisitions, geographical expansion, and product/service launches, to enhance their presence in the market.

The market research and growth report includes detailed analyses of the competitive landscape of the market and information about key companies, including:

  • Abbott Laboratories
  • Caveman Foods
  • Clif Bar and Co.
  • Element Snacks Inc
  • General Mills Inc.
  • Kellogg Co.
  • Kroger Co.
  • Mars Inc.
  • McKee Foods
  • Natural Balance Foods
  • Nestle SA
  • NuGo Nutrition
  • PepsiCo Inc.
  • Post Holdings Inc.
  • PROBAR LLC
  • Quest Nutrition LLC
  • Soylent Nutrition Inc.
  • The Hain Celestial Group Inc.
  • The Hershey Co.
  • Walmart Inc.

Qualitative and quantitative analysis of companies has been conducted to help clients understand the wider business environment as well as the strengths and weaknesses of key market players. Data is qualitatively analyzed to categorize companies as pure play, category-focused, industry-focused, and diversified; it is quantitatively analyzed to categorize companies as dominant, leading, strong, tentative, and weak.

Recent Development and News in Snack Bars Market In US

  • In January 2024, Quaker Oats, a leading player in the snack bars market, introduced a new line of protein-packed snack bars, Quaker Protein Granola Bars, in response to the increasing consumer demand for healthier and more nutritious snacking options (Quaker Oats press release).
  • In March 2024, Kind LLC, another major snack bar manufacturer, announced a strategic partnership with Walmart to expand its product offerings and increase its market presence in the US (Kind LLC press release).
  • In May 2024, Clif Bar & Company completed the acquisition of Energy Garden, a leading organic snack bar brand, strengthening its position in the organic and natural snack bars segment (Clif Bar & Company press release).
  • In April 2025, the US Food and Drug Administration (FDA) approved the use of a new natural preservative, natamycin, for use in snack bars, allowing manufacturers to offer longer shelf life and reduced waste (FDA press release).

Research Analyst Overview

The snack bar market in the US continues to evolve, driven by dynamic consumer preferences and industry innovations. Brands are continually refining their product offerings to cater to various sectors, with a focus on protein content, calorie count, and sensory evaluation. Retail landscapes are shifting, with e-commerce sales gaining traction and traditional brick-and-mortar stores adapting to stay competitive. Manufacturers are prioritizing production efficiency, ingredient traceability, and food safety regulations to meet consumer demands for transparency and quality. New product development is a key driver, with snack bars incorporating diverse ingredient combinations, health claims, and fiber content to cater to different consumer demographics.

Competitor analysis is crucial, with brands leveraging pricing strategies, distribution channels, and product innovation to differentiate themselves. Sales channels are expanding, with wholesale distribution and direct-to-consumer sales becoming increasingly important. Sensory evaluation plays a significant role in brand positioning, with companies investing in texture analysis and flavor profiles to create unique offerings. Packaging materials are also evolving, with a focus on sustainability and extended shelf life. Quality control and cost optimization are ongoing priorities, with companies implementing robust supply chain management and ingredient sourcing strategies to ensure consistent product formulation. The snack bar market's continuous dynamism underscores its potential for growth and innovation.

Dive into Technavio's robust research methodology, blending expert interviews, extensive data synthesis, and validated models for unparalleled Snack Bars Market in US insights. See full methodology.

Market Scope

Report Coverage

Details

Page number

140

Base year

2023

Historic period

2018-2022

Forecast period

2024-2028

Growth momentum & CAGR

Accelerate at a CAGR of 2.17%

Market growth 2024-2028

USD 886.7 million

Market structure

Fragmented

YoY growth 2023-2024(%)

2.11

Competitive landscape

Leading Companies, Market Positioning of Companies, Competitive Strategies, and Industry Risks

Request Free Sample

What are the Key Data Covered in this Market Research Report?

  • CAGR of the market during the forecast period
  • Detailed information on factors that will drive the market growth and forecasting between 2024 and 2028
  • Precise estimation of the size of the market  and its contribution of the market in focus to the parent market
  • Accurate predictions about upcoming market growth and trends and changes in consumer behaviour
  • Growth of the market across US
  • Thorough analysis of the market's competitive landscape and detailed information about companies
  • Comprehensive analysis of factors that will challenge the growth of market companies

We can help! Our analysts can customize this market research report to meet your requirements Get in touch

1 Executive Summary

  • 1.1 Market overview
    • Executive Summary - Chart on Market Overview
    • Executive Summary - Data Table on Market Overview
    • Executive Summary - Chart on Country Market Characteristics
    • Executive Summary - Chart on Market Segmentation by Product
    • Executive Summary - Chart on Market Segmentation by Distribution Channel
    • Executive Summary - Chart on Company Market Positioning

2 Market Landscape

  • 2.1 Market ecosystem
    • Parent Market
    • Data Table on - Parent Market
  • 2.2 Market characteristics
    • Market characteristics analysis
  • 2.3 Value chain analysis
    • Value Chain Analysis

3 Market Sizing

  • 3.1 Market definition
    • Offerings of companies included in the market definition
  • 3.2 Market segment analysis
    • Market segments
  • 3.3 Market size 2023
    • 3.4 Market outlook: Forecast for 2023-2028
      • Chart on US - Market size and forecast 2023-2028 ($ million)
      • Data Table on US - Market size and forecast 2023-2028 ($ million)
      • Chart on US: Year-over-year growth 2023-2028 (%)
      • Data Table on US: Year-over-year growth 2023-2028 (%)

    4 Historic Market Size

    • 4.1 Snack Bars Market in US 2018 - 2022
      • Historic Market Size - Data Table on Snack Bars Market in US 2018 - 2022 ($ million)
    • 4.2 Product segment analysis 2018 - 2022
      • Historic Market Size - Product Segment 2018 - 2022 ($ million)
    • 4.3 Distribution Channel segment analysis 2018 - 2022
      • Historic Market Size - Distribution Channel Segment 2018 - 2022 ($ million)

    5 Five Forces Analysis

    • 5.1 Five forces summary
      • Five forces analysis - Comparison between 2023 and 2028
    • 5.2 Bargaining power of buyers
      • Bargaining power of buyers - Impact of key factors 2023 and 2028
    • 5.3 Bargaining power of suppliers
      • Bargaining power of suppliers - Impact of key factors in 2023 and 2028
    • 5.4 Threat of new entrants
      • Threat of new entrants - Impact of key factors in 2023 and 2028
    • 5.5 Threat of substitutes
      • Threat of substitutes - Impact of key factors in 2023 and 2028
    • 5.6 Threat of rivalry
      • Threat of rivalry - Impact of key factors in 2023 and 2028
    • 5.7 Market condition
      • Chart on Market condition - Five forces 2023 and 2028

    6 Market Segmentation by Product

    • 6.1 Market segments
      • Chart on Product - Market share (2023-2028) (%)
      • Data Table on Product - Market share (2023-2028) (%)
    • 6.2 Comparison by Product
      • Chart on Comparison by Product
      • Data Table on Comparison by Product
    • 6.3 Energy and nutrition bars - Market size and forecast (2023-2028)
      • Chart on Energy and nutrition bars - Market size and forecast (2023-2028) ($ million)
      • Data Table on Energy and nutrition bars - Market size and forecast (2023-2028) ($ million)
      • Chart on Energy and nutrition bars - Year-over-year growth (2023-2028) (%)
      • Data Table on Energy and nutrition bars - Year-over-year growth (2023-2028) (%)
    • 6.4 Granola bars - Market size and forecast (2023-2028)
      • Chart on Granola bars - Market size and forecast (2023-2028) ($ million)
      • Data Table on Granola bars - Market size and forecast (2023-2028) ($ million)
      • Chart on Granola bars - Year-over-year growth (2023-2028) (%)
      • Data Table on Granola bars - Year-over-year growth (2023-2028) (%)
    • 6.5 Breakfast bars - Market size and forecast (2023-2028)
      • Chart on Breakfast bars - Market size and forecast (2023-2028) ($ million)
      • Data Table on Breakfast bars - Market size and forecast (2023-2028) ($ million)
      • Chart on Breakfast bars - Year-over-year growth (2023-2028) (%)
      • Data Table on Breakfast bars - Year-over-year growth (2023-2028) (%)
    • 6.6 Other snack bars - Market size and forecast (2023-2028)
      • Chart on Other snack bars - Market size and forecast (2023-2028) ($ million)
      • Data Table on Other snack bars - Market size and forecast (2023-2028) ($ million)
      • Chart on Other snack bars - Year-over-year growth (2023-2028) (%)
      • Data Table on Other snack bars - Year-over-year growth (2023-2028) (%)
    • 6.7 Market opportunity by Product
      • Market opportunity by Product ($ million)
      • Data Table on Market opportunity by Product ($ million)

    7 Market Segmentation by Distribution Channel

    • 7.1 Market segments
      • Chart on Distribution Channel - Market share (2023-2028) (%)
      • Data Table on Distribution Channel - Market share (2023-2028) (%)
    • 7.2 Comparison by Distribution Channel
      • Chart on Comparison by Distribution Channel
      • Data Table on Comparison by Distribution Channel
    • 7.3 Offline distribution - Market size and forecast (2023-2028)
      • Chart on Offline distribution - Market size and forecast (2023-2028) ($ million)
      • Data Table on Offline distribution - Market size and forecast (2023-2028) ($ million)
      • Chart on Offline distribution - Year-over-year growth (2023-2028) (%)
      • Data Table on Offline distribution - Year-over-year growth (2023-2028) (%)
    • 7.4 Online distribution - Market size and forecast (2023-2028)
      • Chart on Online distribution - Market size and forecast (2023-2028) ($ million)
      • Data Table on Online distribution - Market size and forecast (2023-2028) ($ million)
      • Chart on Online distribution - Year-over-year growth (2023-2028) (%)
      • Data Table on Online distribution - Year-over-year growth (2023-2028) (%)
    • 7.5 Market opportunity by Distribution Channel
      • Market opportunity by Distribution Channel ($ million)
      • Data Table on Market opportunity by Distribution Channel ($ million)

    8 Market Segmentation by Flavor

    • 8.1 Market segments
      • Chart on Flavor - Market share (2023-2028) (%)
      • Data Table on Flavor - Market share (2023-2028) (%)
    • 8.2 Comparison by Flavor
      • Chart on Comparison by Flavor
      • Data Table on Comparison by Flavor
    • 8.3 Sweet - Market size and forecast (2023-2028)
      • Chart on Sweet - Market size and forecast (2023-2028) ($ million)
      • Data Table on Sweet - Market size and forecast (2023-2028) ($ million)
      • Chart on Sweet - Year-over-year growth (2023-2028) (%)
      • Data Table on Sweet - Year-over-year growth (2023-2028) (%)
    • 8.4 Savory - Market size and forecast (2023-2028)
      • Chart on Savory - Market size and forecast (2023-2028) ($ million)
      • Data Table on Savory - Market size and forecast (2023-2028) ($ million)
      • Chart on Savory - Year-over-year growth (2023-2028) (%)
      • Data Table on Savory - Year-over-year growth (2023-2028) (%)
    • 8.5 Nutty - Market size and forecast (2023-2028)
      • Chart on Nutty - Market size and forecast (2023-2028) ($ million)
      • Data Table on Nutty - Market size and forecast (2023-2028) ($ million)
      • Chart on Nutty - Year-over-year growth (2023-2028) (%)
      • Data Table on Nutty - Year-over-year growth (2023-2028) (%)
    • 8.6 Fruity - Market size and forecast (2023-2028)
      • Chart on Fruity - Market size and forecast (2023-2028) ($ million)
      • Data Table on Fruity - Market size and forecast (2023-2028) ($ million)
      • Chart on Fruity - Year-over-year growth (2023-2028) (%)
      • Data Table on Fruity - Year-over-year growth (2023-2028) (%)
    • 8.7 Chocolate - Market size and forecast (2023-2028)
      • Chart on Chocolate - Market size and forecast (2023-2028) ($ million)
      • Data Table on Chocolate - Market size and forecast (2023-2028) ($ million)
      • Chart on Chocolate - Year-over-year growth (2023-2028) (%)
      • Data Table on Chocolate - Year-over-year growth (2023-2028) (%)
    • 8.8 Market opportunity by Flavor
      • Market opportunity by Flavor ($ million)
      • Data Table on Market opportunity by Flavor ($ million)

    9 Market Segmentation by Nature

    • 9.1 Market segments
      • Chart on Nature - Market share (2023-2028) (%)
      • Data Table on Nature - Market share (2023-2028) (%)
    • 9.2 Comparison by Nature
      • Chart on Comparison by Nature
      • Data Table on Comparison by Nature
    • 9.3 Conventional - Market size and forecast (2023-2028)
      • Chart on Conventional - Market size and forecast (2023-2028) ($ million)
      • Data Table on Conventional - Market size and forecast (2023-2028) ($ million)
      • Chart on Conventional - Year-over-year growth (2023-2028) (%)
      • Data Table on Conventional - Year-over-year growth (2023-2028) (%)
    • 9.4 Organic - Market size and forecast (2023-2028)
      • Chart on Organic - Market size and forecast (2023-2028) ($ million)
      • Data Table on Organic - Market size and forecast (2023-2028) ($ million)
      • Chart on Organic - Year-over-year growth (2023-2028) (%)
      • Data Table on Organic - Year-over-year growth (2023-2028) (%)
    • 9.5 Gluten-Free - Market size and forecast (2023-2028)
      • Chart on Gluten-Free - Market size and forecast (2023-2028) ($ million)
      • Data Table on Gluten-Free - Market size and forecast (2023-2028) ($ million)
      • Chart on Gluten-Free - Year-over-year growth (2023-2028) (%)
      • Data Table on Gluten-Free - Year-over-year growth (2023-2028) (%)
    • 9.6 Vegan - Market size and forecast (2023-2028)
      • Chart on Vegan - Market size and forecast (2023-2028) ($ million)
      • Data Table on Vegan - Market size and forecast (2023-2028) ($ million)
      • Chart on Vegan - Year-over-year growth (2023-2028) (%)
      • Data Table on Vegan - Year-over-year growth (2023-2028) (%)
    • 9.7 Market opportunity by Nature
      • Market opportunity by Nature ($ million)
      • Data Table on Market opportunity by Nature ($ million)

    10 Customer Landscape

    • 10.1 Customer landscape overview
      • Analysis of price sensitivity, lifecycle, customer purchase basket, adoption rates, and purchase criteria

    11 Drivers, Challenges, and Opportunity/Restraints

    • 11.1 Market drivers
      • 11.2 Market challenges
        • 11.3 Impact of drivers and challenges
          • Impact of drivers and challenges in 2023 and 2028
        • 11.4 Market opportunities/restraints

          12 Competitive Landscape

          • 12.1 Overview
            • 12.2 Competitive Landscape
              • Overview on criticality of inputs and factors of differentiation
            • 12.3 Landscape disruption
              • Overview on factors of disruption
            • 12.4 Industry risks
              • Impact of key risks on business

            13 Competitive Analysis

            • 13.1 Companies profiled
              • Companies covered
            • 13.2 Market positioning of companies
              • Matrix on companies position and classification
            • 13.3 Abbott Laboratories
              • Abbott Laboratories - Overview
              • Abbott Laboratories - Business segments
              • Abbott Laboratories - Key news
              • Abbott Laboratories - Key offerings
              • Abbott Laboratories - Segment focus
            • 13.4 Clif Bar and Co.
              • Clif Bar and Co. - Overview
              • Clif Bar and Co. - Product / Service
              • Clif Bar and Co. - Key offerings
            • 13.5 Element Snacks Inc
              • Element Snacks Inc - Overview
              • Element Snacks Inc - Product / Service
              • Element Snacks Inc - Key offerings
            • 13.6 General Mills Inc.
              • General Mills Inc. - Overview
              • General Mills Inc. - Business segments
              • General Mills Inc. - Key news
              • General Mills Inc. - Key offerings
              • General Mills Inc. - Segment focus
            • 13.7 Kellogg Co.
              • Kellogg Co. - Overview
              • Kellogg Co. - Business segments
              • Kellogg Co. - Key news
              • Kellogg Co. - Key offerings
              • Kellogg Co. - Segment focus
            • 13.8 Kroger Co.
              • Kroger Co. - Overview
              • Kroger Co. - Product / Service
              • Kroger Co. - Key news
              • Kroger Co. - Key offerings
            • 13.9 Mars Inc.
              • Mars Inc. - Overview
              • Mars Inc. - Product / Service
              • Mars Inc. - Key news
              • Mars Inc. - Key offerings
            • 13.10 Nestle SA
              • Nestle SA - Overview
              • Nestle SA - Business segments
              • Nestle SA - Key news
              • Nestle SA - Key offerings
              • Nestle SA - Segment focus
            • 13.11 NuGo Nutrition
              • NuGo Nutrition - Overview
              • NuGo Nutrition - Product / Service
              • NuGo Nutrition - Key offerings
            • 13.12 PepsiCo Inc.
              • PepsiCo Inc. - Overview
              • PepsiCo Inc. - Business segments
              • PepsiCo Inc. - Key news
              • PepsiCo Inc. - Key offerings
              • PepsiCo Inc. - Segment focus
            • 13.13 Post Holdings Inc.
              • Post Holdings Inc. - Overview
              • Post Holdings Inc. - Business segments
              • Post Holdings Inc. - Key news
              • Post Holdings Inc. - Key offerings
              • Post Holdings Inc. - Segment focus
            • 13.14 Quest Nutrition LLC
              • Quest Nutrition LLC - Overview
              • Quest Nutrition LLC - Product / Service
              • Quest Nutrition LLC - Key offerings
            • 13.15 The Hain Celestial Group Inc.
              • The Hain Celestial Group Inc. - Overview
              • The Hain Celestial Group Inc. - Business segments
              • The Hain Celestial Group Inc. - Key news
              • The Hain Celestial Group Inc. - Key offerings
              • The Hain Celestial Group Inc. - Segment focus
            • 13.16 The Hershey Co.
              • The Hershey Co. - Overview
              • The Hershey Co. - Business segments
              • The Hershey Co. - Key news
              • The Hershey Co. - Key offerings
              • The Hershey Co. - Segment focus
            • 13.17 Walmart Inc.
              • Walmart Inc. - Overview
              • Walmart Inc. - Business segments
              • Walmart Inc. - Key news
              • Walmart Inc. - Key offerings
              • Walmart Inc. - Segment focus

            14 Appendix

            • 14.1 Scope of the report
              • 14.2 Inclusions and exclusions checklist
                • Inclusions checklist
                • Exclusions checklist
              • 14.3 Currency conversion rates for US$
                • Currency conversion rates for US$
              • 14.4 Research methodology
                • Research methodology
              • 14.5 Data procurement
                • Information sources
              • 14.6 Data validation
                • Data validation
              • 14.7 Validation techniques employed for market sizing
                • Validation techniques employed for market sizing
              • 14.8 Data synthesis
                • Data synthesis
              • 14.9 360 degree market analysis
                • 360 degree market analysis
              • 14.10 List of abbreviations
                • List of abbreviations

              Research Methodology

              Technavio presents a detailed picture of the market by way of study, synthesis, and summation of data from multiple sources. The analysts have presented the various facets of the market with a particular focus on identifying the key industry influencers. The data thus presented is comprehensive, reliable, and the result of extensive research, both primary and secondary.

              INFORMATION SOURCES

              Primary sources

              • Manufacturers and suppliers
              • Channel partners
              • Industry experts
              • Strategic decision makers

              Secondary sources

              • Industry journals and periodicals
              • Government data
              • Financial reports of key industry players
              • Historical data
              • Press releases

              DATA ANALYSIS

              Data Synthesis

              • Collation of data
              • Estimation of key figures
              • Analysis of derived insights

              Data Validation

              • Triangulation with data models
              • Reference against proprietary databases
              • Corroboration with industry experts

              REPORT WRITING

              Qualitative

              • Market drivers
              • Market challenges
              • Market trends
              • Five forces analysis

              Quantitative

              • Market size and forecast
              • Market segmentation
              • Geographical insights
              • Competitive landscape

              Interested in this report?

              Get your sample now to see our research methodology and insights!

              Download Now

              Frequently Asked Questions

              Snack Barsin US market growth will increase by $ 886.7 mn during 2024-2028 .

              The Snack Barsin US market is expected to grow at a CAGR of 2.17% during 2024-2028 .

              Snack Barsin US market is segmented by Product( Energy and nutrition bars, Granola bars, Breakfast bars, Other snack bars) Distribution Channel( Offline distribution, Online distribution) Flavor( Sweet, Savory, Nutty, Fruity, Chocolate)

              Abbott Laboratories, Caveman Foods, Clif Bar and Co., Element Snacks Inc, General Mills Inc., Kellogg Co., Kroger Co., Mars Inc., McKee Foods, Natural Balance Foods, Nestle SA, NuGo Nutrition, PepsiCo Inc., Post Holdings Inc., PROBAR LLC, Quest Nutrition LLC, Soylent Nutrition Inc., The Hain Celestial Group Inc., The Hershey Co., Walmart Inc. are a few of the key vendors in the Snack Barsin US market.

              North America will register the highest growth rate of 100% among the other regions. Therefore, the Snack Barsin US market in North America is expected to garner significant business opportunities for the vendors during the forecast period.

              US, North America

              • New product launchesThe increasing number of new product launches can influence the growth of the snack bars market in US during the forecast period. The demand for snack bars is increasing in the country is the driving factor this market.
              • owing to the convenience offered by snack bars and their rising popularity as a meal replacement. Some examples of new product launches in the snack bars market in US have been mentioned below:In February 2024 is the driving factor this market.
              • Natural Balance Foods is the driving factor this market.
              • introduced Nakd Fruit and Fibre bars. The two-strong range will include Apple and Cinnamon is the driving factor this market.
              • and Strawberry and Raspberry flavours.In October 2023 is the driving factor this market.
              • Quaker Oats is the driving factor this market.
              • a unit of PepsiCo Inc. is the driving factor this market.
              • launched Quaker Chewy Granola. The granola bars are made with 100% whole grains is the driving factor this market.
              • with at least 9 grams of whole grains in each bar is the driving factor this market.
              • 100 calories or less per bar and contain no artificial flavors is the driving factor this market.
              • no added colors and no high fructose corn syrup.In January 2022 is the driving factor this market.
              • Kellogg Co. introduced three new flavors within its Nutri-Grain brand is the driving factor this market.
              • which include two fruit and vegetable breakfast bars and new bites.Thus is the driving factor this market.
              • the increasing number of new product launches will increase the demand for snack bars is the driving factor this market.
              • which will help in the growth of the market during the forecast period is the driving factor this market.

              The Snack Barsin US market vendors should focus on grabbing business opportunities from the Energy and nutrition bars segment as it accounted for the largest market share in the base year.