US Commercial Construction Market Size 2023- 2027
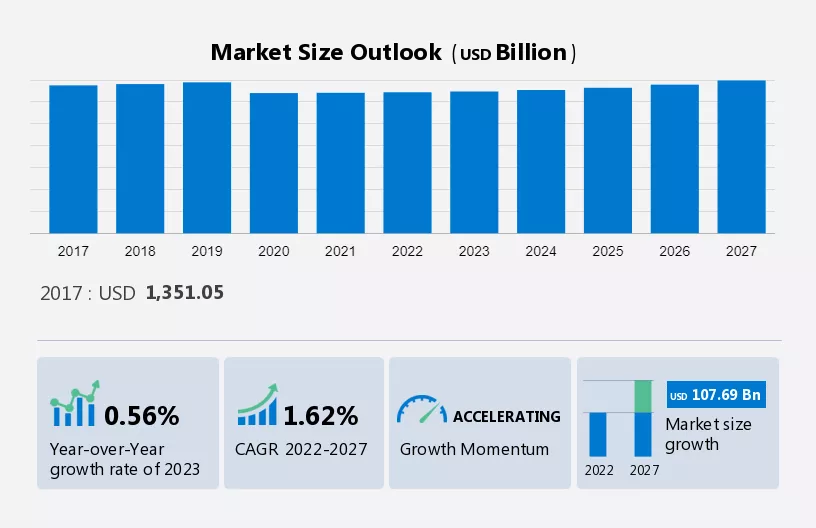
The US commercial construction market is estimated to grow at a CAGR of 1.62% between 2022 and 2027. Several key factors are fueling this growth trajectory. The rising demand for green building construction, fueled by sustainability initiatives, is playing a significant role. Additionally, the flourishing manufacturing and distribution sectors within the US are driving the need for expanded facilities. Finally, the robust real estate market is further adding impetus to the growth of this market segment.
This comprehensive report delves deep into the market segmentation, analyzing both the private and public construction sectors. It also provides a detailed breakdown of buildings and other construction types. Additionally, it offers an insightful analysis of the key drivers, emerging trends, and potential challenges influencing the market. Enhancing this analysis is the inclusion of historical market data spanning the years 2017 to 2021.
What will be the size of the US Commercial Construction Industry during the Market Forecast Period?
To learn more about this report, Download Report Sample
US Commercial Construction Market Dynamics and Customer Landscape
The increase in the construction of green buildings is notably driving the market growth, although factors such as a lack of workforce in the construction industry may impede the market growth. Our researchers analyzed the data with 2022 as the base year and the key drivers, trends, and challenges. A holistic analysis of drivers will help companies refine their marketing strategies to gain a competitive advantage.
Key US Commercial Construction Market Driver
The increase in the construction of green buildings is notably driving the market growth. A substantial amount of energy is consumed in the construction, establishment, and subsequent services of a building. The greenhouse gas emissions from buildings are also way higher than that from the transportation sector. Buildings continuously consume energy from the surroundings without any replenishment. As the natural resource of energy becomes polluted, the quantity of sufficient energy required by the buildings is exhausted at the source. This highlights the need for appropriate energy-efficient buildings, such as green buildings.
Green buildings minimize energy consumption and efficiently utilize the available energy to meet all their requirements. In addition, the by-products released into the environment from the buildings are recycled. Therefore, such buildings help conserve energy while operating efficiently. Owing to the growing awareness of global warming and climate change the demand for green buildings will grow significantly. Therefore, such factors are expected to expand the market during the forecast period.
Significant Market Trend
The emergence of smart cities is an emerging trend in the market. The effective management of operations in a city smart cities involves the integration of information and communication and the adoption of the latest technologies. The emergence of smart cities leads to developments in functional areas such as transportation, traffic management, energy efficiency and sustainability, and governance.
The growing number of smart city projects across the US will also give rise to the need for the construction of advanced road network systems. Therefore, such factors are expected to create growth opportunities for vendors operating in this market and will focus on expanding roadways to align with the vision of smart city projects undertaken by the federal government of the US. Thus, factors like these will fuel the market growth during the forecast period.
Major Market Challenge
The lack of workforce in the construction industry is a major challenge impeding the market growth. In this industry, the demand for both skilled and unskilled workforce is high. This shortage is more prominent in the case of skilled workers, as vendors in the construction industry are not able to find enough skilled workforce to carry out their operations.
Despite the growing demand for construction, companies need to turn down new orders owing to the lack of skilled workforces such as technicians, site managers, and plumbers. According to the German Chambers of Commerce and Industry, the lack of a skilled workforce is one of the significant issues hindering the growth of the market in the US during the forecast period.
Key Commercial Construction Market Customer Landscape
The report includes the adoption lifecycle of the market, covering from the innovator’s stage to the laggard’s stage. It focuses on adoption rates in different regions based on penetration. Furthermore, the report also includes key purchase criteria and drivers of price sensitivity to help companies evaluate and develop their growth strategies.
Global Commercial Construction Market Customer Landscape
Who are the Major Commercial Construction Market Vendors in the US?
Vendors are implementing various strategies, such as strategic alliances, partnerships, mergers and acquisitions, geographical expansion, and product/service launches, to enhance their presence in the market.
Clark Construction Group LLC - The company offers building and construction of facilities across the US The key offerings of the company include commercial construction such as offices, hotels, resorts, and others.
The report also includes detailed analyses of the competitive landscape of the market and information about 15 market vendors, including:
- Actividades de Construccion y Servicios SA
- AECOM
- Bechtel Corp.
- Clayco
- DPR Construction
- Ferrovial SA
- Fluor Corp.
- Gilbane Inc.
- Hensel Phelps
- HOCHTIEF AG
- Holder Construction Group LLC
- Kiewit Corp.
- Parsons Corp.
- PCL Constructors Inc.
- Skanska AB
Through qualitative analysis, vendors are classified as pure play, category-focused, industry-focused, and diversified. Quantitative analysis categorizes them as dominant, leading, strong, tentative, and weak. This comprehensive examination aids clients in comprehending the broader business landscape and evaluating the strengths and weaknesses of major market participants.
What is the Fastest-Growing Segment in the Commercial Construction Market in US?
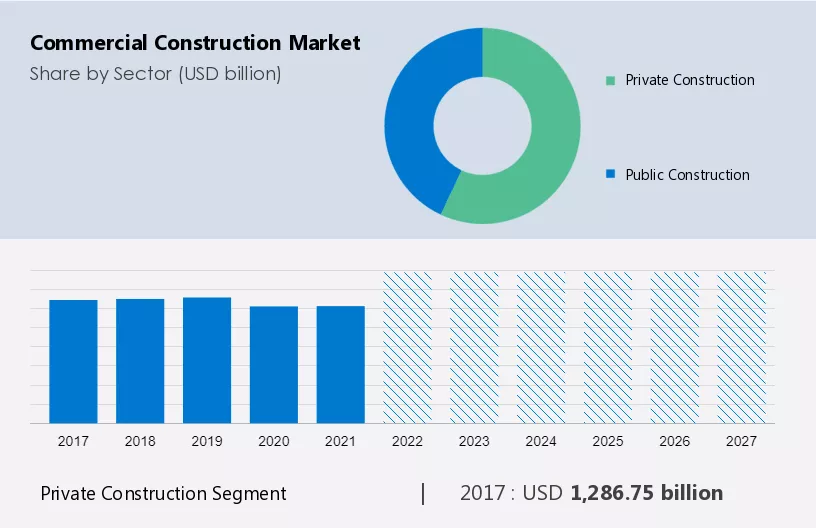
The market share growth by the private construction segment will be significant during the forecast period. The private construction segment of the commercial construction market in US incorporates the construction of restaurants, grocery stores, shopping centers, office facilities, hospitals, and educational institutions.
Get a glance at the market contribution of various segments Request a PDF Sample
The private construction segment was valued at USD 1,286.75 billion in 2017 and continued to grow until 2021. Owing to rapid urbanization there have been huge investments in the US construction sector. The private construction segment in the US is also increasing owing to the surging demand for new office spaces and administrative buildings along with the expansion of the existing office spaces. Furthermore, the private construction segment of the commercial construction market in US is expected to be leveraged during the forecast period due to the growing expansions of industrial facilities backed by surging industrialization and friendly government policies. Therefore, such establishments are expected to propel the growth of the private construction segment during the forecast period.
Parent Market Analysis
Technavio categorizes the commercial construction market in US as a part of the global construction and engineering market. The global construction and engineering market cover companies that are primarily engaged in non-residential construction, including engineering service providers and EPC contractors. Our research report has extensively covered external factors influencing the parent market growth during the forecast period.
Segment Overview
The report forecasts market growth by revenue at global, regional & country levels and provides an analysis of the latest trends and growth opportunities from 2023 to 2027. The market has been segmented by Sector (Private construction and Public construction), Type (Building and Others), and Geography (North America). Additional find region-wise segment analysis forecast (2023 to 2027) and historical insight (2017 to 2022)
- Sector Outlook (USD Billion, 2023 - 2027)
- Private construction
- Public construction
- Type Outlook (USD Billion, 2023 - 2027)
|
Commercial Construction Market Scope
|
|
Report Coverage
|
Details
|
|
Page number
|
120
|
|
Base year
|
2022
|
|
Historic period
|
2017-2021
|
|
Forecast period
|
2023-2027
|
|
Growth momentum & CAGR
|
Accelerate at a CAGR of 1.62%
|
|
Market growth 2023-2027
|
USD 107.69 billion
|
|
Market structure
|
Fragmented
|
|
YoY growth 2022-2023(%)
|
0.56
|
|
Competitive landscape
|
Leading Vendors, Market Positioning of Vendors, Competitive Strategies, and Industry Risks |
|
Key companies profiled
|
Actividades de Construccion y Servicios SA, AECOM, Bechtel Corp., Clark Construction Group LLC, Clayco, DPR Construction, Ferrovial SA, Fluor Corp., Gilbane Inc., Hensel Phelps, HOCHTIEF AG, Holder Construction Group LLC, Kiewit Corp., Parsons Corp., PCL Constructors Inc., Skanska AB, STO Building Group, The Walsh Group, and Tutor Perini Corp.
|
|
Market dynamics
|
Parent market analysis, Market growth inducers and obstacles, Fast-growing and slow-growing segment analysis, COVID-19 impact and recovery analysis and future consumer dynamics, and Market condition analysis for the forecast period.
|
|
Customization purview
|
If our report has not included the data that you are looking for, you can reach out to our analysts and get segments customized.
|
Request PDF sample
What are the Key Data Covered in the Report?
- CAGR of the market during the forecast period
- Detailed information on factors that will drive the growth of the market between 2023 and 2027
- Precise estimation of the commercial construction market size and its contribution to the parent market
- Accurate predictions about upcoming trends and changes in consumer behavior
- Growth of the market industry across the US
- A thorough analysis of the market’s competitive landscape and detailed information about vendors
- Comprehensive analysis of factors that will challenge the growth of commercial construction market vendors in the US
We can help! Our analysts can customize this report to meet your requirements. Get in touch
1 Executive Summary
- 1.1 Market overview
- Executive Summary – Chart on Market Overview
- Executive Summary – Data Table on Market Overview
- Executive Summary – Chart on Country Market Characteristics
- Executive Summary – Chart on Market Segmentation by Sector
- Executive Summary – Chart on Market Segmentation by Type
- Executive Summary – Chart on Vendor Market Positioning
2 Market Landscape
- 2.1 Market ecosystem
- Parent market
- Market Characteristics
3 Market Sizing
- 3.1 Market definition
- Offerings of vendors included in the market definition
- 3.2 Market segment analysis
- 3.4 Market outlook Forecast for 2022-2027
- Chart on US - Market size and forecast 2022-2027 ($ billion)
- Data Table on US - Market size and forecast 2022-2027 ($ billion)
- Chart on US Year-over-year growth 2022-2027 (%)
- Data Table on US Year-over-year growth 2022-2027 (%)
4 Historic Market Size
- 4.1 Commercial construction market in US 2017 - 2021
- Historic Market Size – Data Table on Commercial construction market in US 2017 - 2021 ($ million)
- 4.2 Sector Segment Analysis 2017 - 2021
- Historic Market Size – Sector Segment 2017 - 2021 ($ million)
- 4.3 Type Segment Analysis 2017 - 2021
- Historic Market Size – Type Segment 2017 - 2021 ($ million)
5 Five Forces Analysis
- 5.1 Five forces summary
- Five forces analysis - Comparison between 2022 and 2027
- 5.2 Bargaining power of buyers
- Chart on Bargaining power of buyers – Impact of key factors 2022 and 2027
- 5.3 Bargaining power of suppliers
- Bargaining power of suppliers – Impact of key factors in 2022 and 2027
- 5.4 Threat of new entrants
- Threat of new entrants – Impact of key factors in 2022 and 2027
- 5.5 Threat of substitutes
- Threat of substitutes – Impact of key factors in 2022 and 2027
- 5.6 Threat of rivalry
- Threat of rivalry – Impact of key factors in 2022 and 2027
- 5.7 Market condition
- Chart on Market condition - Five forces 2022 and 2027
6 Market Segmentation by Sector
- 6.1 Market segments
- Chart on Sector - Market share 2022-2027 (%)
- Data Table on Sector - Market share 2022-2027 (%)
- 6.2 Comparison by Sector
- Chart on Comparison by Sector
- Data Table on Comparison by Sector
- 6.3 Private construction - Market size and forecast 2022-2027
- Chart on Private construction - Market size and forecast 2022-2027 ($ billion)
- Data Table on Private construction - Market size and forecast 2022-2027 ($ billion)
- Chart on Private construction - Year-over-year growth 2022-2027 (%)
- Data Table on Private construction - Year-over-year growth 2022-(%)
- 6.4 Public construction - Market size and forecast 2022-2027
- Chart on Public construction - Market size and forecast 2022-2027 ($ billion )
- Data Table on Public construction - Market size and forecast 2022-2027 ($ billion)
- Chart on Public construction - Year-over-year growth 2022-2027 (%)
- Data Table on Public construction - Year-over-year growth 2022-2027 (%)
- 6.5 Market opportunity by Sector
- Market opportunity by Sector ($ billion)
7 Market Segmentation by Type
- 7.1 Market segments
- Chart on Type - Market share 2022-2027 (%)
- Data Table on Type - Market share 2022-2027 (%)
- 7.2 Comparison by Type
- Chart on Comparison by Type
- Data Table on Comparison by Type
- 7.3 Building - Market size and forecast 2022-2027
- Chart on Building - Market size and forecast 2022-2027 ($ billion)
- Data Table on Building - Market size and forecast 2022-2027 ($ billion)
- Chart on Building - Year-over-year growth 2022-2027 (%)
- Data Table on Building - Year-over-year growth 2022-2027 (%)
- 7.4 Others - Market size and forecast 2022-2027
- Chart on Others - Market size and forecast 2022-2027 ($ billion)
- Data Table on Others - Market size and forecast 2022-2027 ($ billion)
- Chart on Others - Year-over-year growth 2022-2027 (%)
- Data Table on Others - Year-over-year growth 2022-2027 (%)
- 7.5 Market opportunity by Type
- Market opportunity by Type ($ billion)
8 Customer Landscape
- 8.1 Customer landscape overview
- Analysis of price sensitivity, lifecycle, customer purchase basket, adoption rates, and purchase criteria
9 Drivers, Challenges, and Trends
- 9.3 Impact of drivers and challenges
- Impact of drivers and challenges in 2022 and 2027
10 Vendor Landscape
- 10.2 Vendor landscape
- Overview on Criticality of inputs and Factors of differentiation
- 10.3 Landscape disruption
- Overview on factors of disruption
- 10.4 Industry risks
- Impact of key risks on business
11 Vendor Analysis
- 11.2 Market positioning of vendors
- Matrix on vendor position and classification
- 11.3 Actividades de Construccion y Servicios SA
- Actividades de Construccion y Servicios SA - Overview
- Actividades de Construccion y Servicios SA - Product / Service
- Actividades de Construccion y Servicios SA - Key offerings
- 11.4 AECOM
- AECOM - Overview
- AECOM - Business segments
- AECOM - Key news
- AECOM - Key offerings
- AECOM - Segment focus
- 11.5 Bechtel Corp.
- Bechtel Corp. - Overview
- Bechtel Corp. - Product / Service
- Bechtel Corp. - Key news
- Bechtel Corp. - Key offerings
- 11.6 Clark Construction Group LLC
- Clark Construction Group LLC - Overview
- Clark Construction Group LLC - Product / Service
- Clark Construction Group LLC - Key offerings
- 11.7 DPR Construction
- DPR Construction - Overview
- DPR Construction - Product / Service
- DPR Construction - Key offerings
- 11.8 Ferrovial SA
- Ferrovial SA - Overview
- Ferrovial SA - Business segments
- Ferrovial SA - Key offerings
- Ferrovial SA - Segment focus
- 11.9 Fluor Corp.
- Fluor Corp. - Overview
- Fluor Corp. - Business segments
- Fluor Corp. - Key offerings
- Fluor Corp. - Segment focus
- 11.10 Gilbane Inc.
- Gilbane Inc. - Overview
- Gilbane Inc. - Product / Service
- Gilbane Inc. - Key offerings
- 11.11 HOCHTIEF AG
- HOCHTIEF AG - Overview
- HOCHTIEF AG - Business segments
- HOCHTIEF AG - Key offerings
- HOCHTIEF AG - Segment focus
- 11.12 Kiewit Corp.
- Kiewit Corp. - Overview
- Kiewit Corp. - Product / Service
- Kiewit Corp. - Key offerings
- 11.13 Parsons Corp.
- Parsons Corp. - Overview
- Parsons Corp. - Business segments
- Parsons Corp. - Key offerings
- Parsons Corp. - Segment focus
- 11.14 Skanska AB
- Skanska AB - Overview
- Skanska AB - Business segments
- Skanska AB - Key offerings
- Skanska AB - Segment focus
- 11.15 STO Building Group
- STO Building Group - Overview
- STO Building Group - Product / Service
- STO Building Group - Key offerings
- 11.16 The Walsh Group
- The Walsh Group - Overview
- The Walsh Group - Product / Service
- The Walsh Group - Key offerings
- 11.17 Tutor Perini Corp.
- Tutor Perini Corp. - Overview
- Tutor Perini Corp. - Business segments
- Tutor Perini Corp. - Key offerings
- Tutor Perini Corp. - Segment focus
12 Appendix
- 12.2 Inclusions and exclusions checklist
- Inclusions checklist
- Exclusions checklist
- 12.3 Currency conversion rates for US$
- Currency conversion rates for US$
- 12.4 Research methodology
- Research methodology
- Validation techniques employed for market sizing
- Information sources
- 12.5 List of abbreviations
7 Market Segmentation by Type
- 7.1 Market segments
- Chart on Type - Market share 2023-2028 (%)
- Data Table on Type - Market share 2023-2028 (%)
- 7.2 Comparison by Type
- Chart on Comparison by Type
- Data Table on Comparison by Type
- 7.3 Natural fibers - Market size and forecast 2023-2028
- Chart on Natural fibers - Market size and forecast 2023-2028 ($ billion)
- Data Table on Natural fibers - Market size and forecast 2023-2028 ($ billion)
- Chart on Natural fibers - Year-over-year growth 2023-2028 (%)
- Data Table on Natural fibers - Year-over-year growth 2023-2028 (%)
- 7.4 Polyesters - Market size and forecast 2023-2028
- Chart on Polyesters - Market size and forecast 2023-2028 ($ billion)
- Data Table on Polyesters - Market size and forecast 2023-2028 ($ billion)
- Chart on Polyesters - Year-over-year growth 2023-2028 (%)
- Data Table on Polyesters - Year-over-year growth 2023-2028 (%)
- 7.5 Nylons - Market size and forecast 2023-2028
- Chart on Nylons - Market size and forecast 2023-2028 ($ billion)
- Data Table on Nylons - Market size and forecast 2023-2028 ($ billion)
- Chart on Nylons - Year-over-year growth 2023-2028 (%)
- Data Table on Nylons - Year-over-year growth 2023-2028 (%)
- 7.6 Others - Market size and forecast 2023-2028
- Chart on Others - Market size and forecast 2023-2028 ($ billion)
- Data Table on Others - Market size and forecast 2023-2028 ($ billion)
- Chart on Others - Year-over-year growth 2023-2028 (%)
- Data Table on Others - Year-over-year growth 2023-2028 (%)
- 7.7 Market opportunity by Type
- Market opportunity by Type ($ billion)
- Data Table on Market opportunity by Type ($ billion)
8 Market Segmentation by Application
- 8.1 Market segments
- Chart on Application - Market share 2023-2028 (%)
- Data Table on Application - Market share 2023-2028 (%)
- 8.2 Comparison by Application
- Chart on Comparison by Application
- Data Table on Comparison by Application
- 8.3 Fashion - Market size and forecast 2023-2028
- Chart on Fashion - Market size and forecast 2023-2028 ($ billion)
- Data Table on Fashion - Market size and forecast 2023-2028 ($ billion)
- Chart on Fashion - Year-over-year growth 2023-2028 (%)
- Data Table on Fashion - Year-over-year growth 2023-2028 (%)
- 8.4 Technical - Market size and forecast 2023-2028
- Chart on Technical - Market size and forecast 2023-2028 ($ billion)
- Data Table on Technical - Market size and forecast 2023-2028 ($ billion)
- Chart on Technical - Year-over-year growth 2023-2028 (%)
- Data Table on Technical - Year-over-year growth 2023-2028 (%)
- 8.5 Household - Market size and forecast 2023-2028
- Chart on Household - Market size and forecast 2023-2028 ($ billion)
- Data Table on Household - Market size and forecast 2023-2028 ($ billion)
- Chart on Household - Year-over-year growth 2023-2028 (%)
- Data Table on Household - Year-over-year growth 2023-2028 (%)
- 8.6 Others - Market size and forecast 2023-2028
- Chart on Others - Market size and forecast 2023-2028 ($ billion)
- Data Table on Others - Market size and forecast 2023-2028 ($ billion)
- Chart on Others - Year-over-year growth 2023-2028 (%)
- Data Table on Others - Year-over-year growth 2023-2028 (%)
- 8.7 Market opportunity by Application
- Market opportunity by Application ($ billion)
- Data Table on Market opportunity by Application ($ billion)
9 Customer Landscape
- 9.1 Customer landscape overview
- Analysis of price sensitivity, lifecycle, customer purchase basket, adoption rates, and purchase criteria
10 Geographic Landscape
- 10.1 Geographic segmentation
- Chart on Market share by geography 2023-2028 (%)
- Data Table on Market share by geography 2023-2028 (%)
- 10.2 Geographic comparison
- Chart on Geographic comparison
- Data Table on Geographic comparison
- 10.3 APAC - Market size and forecast 2023-2028
- Chart on APAC - Market size and forecast 2023-2028 ($ billion)
- Data Table on APAC - Market size and forecast 2023-2028 ($ billion)
- Chart on APAC - Year-over-year growth 2023-2028 (%)
- Data Table on APAC - Year-over-year growth 2023-2028 (%)
- 10.4 North America - Market size and forecast 2023-2028
- Chart on North America - Market size and forecast 2023-2028 ($ billion)
- Data Table on North America - Market size and forecast 2023-2028 ($ billion)
- Chart on North America - Year-over-year growth 2023-2028 (%)
- Data Table on North America - Year-over-year growth 2023-2028 (%)
- 10.5 Europe - Market size and forecast 2023-2028
- Chart on Europe - Market size and forecast 2023-2028 ($ billion)
- Data Table on Europe - Market size and forecast 2023-2028 ($ billion)
- Chart on Europe - Year-over-year growth 2023-2028 (%)
- Data Table on Europe - Year-over-year growth 2023-2028 (%)
- 10.6 South America - Market size and forecast 2023-2028
- Chart on South America - Market size and forecast 2023-2028 ($ billion)
- Data Table on South America - Market size and forecast 2023-2028 ($ billion)
- Chart on South America - Year-over-year growth 2023-2028 (%)
- Data Table on South America - Year-over-year growth 2023-2028 (%)
- 10.7 Middle East and Africa - Market size and forecast 2023-2028
- Chart on Middle East and Africa - Market size and forecast 2023-2028 ($ billion)
- Data Table on Middle East and Africa - Market size and forecast 2023-2028 ($ billion)
- Chart on Middle East and Africa - Year-over-year growth 2023-2028 (%)
- Data Table on Middle East and Africa - Year-over-year growth 2023-2028 (%)
- 10.8 China - Market size and forecast 2023-2028
- Chart on China - Market size and forecast 2023-2028 ($ billion)
- Data Table on China - Market size and forecast 2023-2028 ($ billion)
- Chart on China - Year-over-year growth 2023-2028 (%)
- Data Table on China - Year-over-year growth 2023-2028 (%)
- 10.9 US - Market size and forecast 2023-2028
- Chart on US - Market size and forecast 2023-2028 ($ billion)
- Data Table on US - Market size and forecast 2023-2028 ($ billion)
- Chart on US - Year-over-year growth 2023-2028 (%)
- Data Table on US - Year-over-year growth 2023-2028 (%)
- 10.10 Japan - Market size and forecast 2023-2028
- Chart on Japan - Market size and forecast 2023-2028 ($ billion)
- Data Table on Japan - Market size and forecast 2023-2028 ($ billion)
- Chart on Japan - Year-over-year growth 2023-2028 (%)
- Data Table on Japan - Year-over-year growth 2023-2028 (%)
- 10.11 India - Market size and forecast 2023-2028
- Chart on India - Market size and forecast 2023-2028 ($ billion)
- Data Table on India - Market size and forecast 2023-2028 ($ billion)
- Chart on India - Year-over-year growth 2023-2028 (%)
- Data Table on India - Year-over-year growth 2023-2028 (%)
- 10.12 Germany - Market size and forecast 2023-2028
- Chart on Germany - Market size and forecast 2023-2028 ($ billion)
- Data Table on Germany - Market size and forecast 2023-2028 ($ billion)
- Chart on Germany - Year-over-year growth 2023-2028 (%)
- Data Table on Germany - Year-over-year growth 2023-2028 (%)
- 10.13 Market opportunity by geography
- Market opportunity by geography ($ billion)
- Data Tables on Market opportunity by geography ($ billion)
11 Drivers, Challenges, and Trends
- 11.3 Impact of drivers and challenges
- Impact of drivers and challenges in 2023 and 2028
12 Vendor Landscape
- 12.2 Vendor landscape
- Overview on Criticality of inputs and Factors of differentiation
- 12.3 Landscape disruption
- Overview on factors of disruption
- 12.4 Industry risks
- Impact of key risks on business
13 Vendor Analysis
- 13.2 Market positioning of vendors
- Matrix on vendor position and classification
- 13.3 B.C.CORP.
- B.C.CORP. - Overview
- B.C.CORP. - Product / Service
- B.C.CORP. - Key offerings
- 13.4 BSL Ltd.
- BSL Ltd. - Overview
- BSL Ltd. - Business segments
- BSL Ltd. - Key offerings
- BSL Ltd. - Segment focus
- 13.5 China Petrochemical Corp.
- China Petrochemical Corp. - Overview
- China Petrochemical Corp. - Business segments
- China Petrochemical Corp. - Key offerings
- China Petrochemical Corp. - Segment focus
- 13.6 Donear Industries Ltd.
- Donear Industries Ltd. - Overview
- Donear Industries Ltd. - Business segments
- Donear Industries Ltd. - Key offerings
- Donear Industries Ltd. - Segment focus
- 13.7 Hyosung TNC Corp.
- Hyosung TNC Corp. - Overview
- Hyosung TNC Corp. - Product / Service
- Hyosung TNC Corp. - Key offerings
- 13.8 Industria de Diseno Textil SA
- Industria de Diseno Textil SA - Overview
- Industria de Diseno Textil SA - Business segments
- Industria de Diseno Textil SA - Key offerings
- Industria de Diseno Textil SA - Segment focus
- 13.9 JCT Ltd.
- JCT Ltd. - Overview
- JCT Ltd. - Product / Service
- JCT Ltd. - Key offerings
- 13.10 Koch Industries Inc.
- Koch Industries Inc. - Overview
- Koch Industries Inc. - Product / Service
- Koch Industries Inc. - Key offerings
- 13.11 Lu Thai Textile Co. Ltd.
- Lu Thai Textile Co. Ltd. - Overview
- Lu Thai Textile Co. Ltd. - Product / Service
- Lu Thai Textile Co. Ltd. - Key offerings
- 13.12 Modern Woollens
- Modern Woollens - Overview
- Modern Woollens - Business segments
- Modern Woollens - Key offerings
- Modern Woollens - Segment focus
- 13.13 Nisshinbo Holdings Inc.
- Nisshinbo Holdings Inc. - Overview
- Nisshinbo Holdings Inc. - Business segments
- Nisshinbo Holdings Inc. - Key offerings
- Nisshinbo Holdings Inc. - Segment focus
- 13.14 paramounttextiles
- paramounttextiles - Overview
- paramounttextiles - Product / Service
- paramounttextiles - Key offerings
- 13.15 Paulo de Oliveira
- Paulo de Oliveira - Overview
- Paulo de Oliveira - Product / Service
- Paulo de Oliveira - Key offerings
- 13.16 Successors Reda SBpA
- Successors Reda SBpA - Overview
- Successors Reda SBpA - Product / Service
- Successors Reda SBpA - Key offerings
- 13.17 Toray Industries Inc.
- Toray Industries Inc. - Overview
- Toray Industries Inc. - Business segments
- Toray Industries Inc. - Key offerings
- Toray Industries Inc. - Segment focus
14 Appendix
- 14.2 Inclusions and exclusions checklist
- Inclusions checklist
- Exclusions checklist
- 14.3 Currency conversion rates for US$
- Currency conversion rates for US$
- 14.4 Research methodology
- Research methodology
- Validation techniques employed for market sizing
- Information sources
- 14.5 List of abbreviations


