US Commercial Construction Market Size 2026-2030
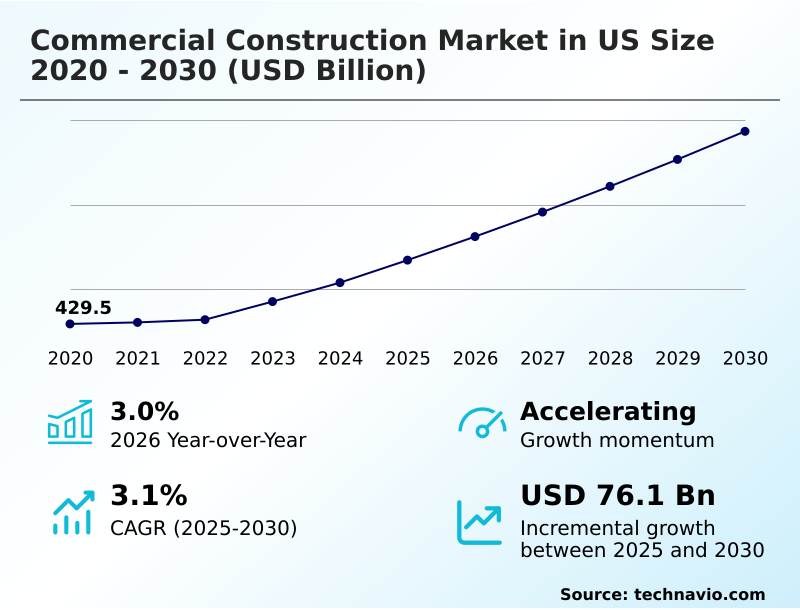
The us commercial construction market size is valued to increase by USD 76.1 billion, at a CAGR of 3.1% from 2025 to 2030. Infrastructure investments boosting construction activity nationwide will drive the us commercial construction market.
Major Market Trends & Insights
- By Sector - Private construction segment was valued at USD 434 billion in 2024
- By Type - New construction segment accounted for the largest market revenue share in 2024
Market Size & Forecast
- Market Opportunities: USD 113.8 billion
- Market Future Opportunities: USD 76.1 billion
- CAGR from 2025 to 2030 : 3.1%
Market Summary
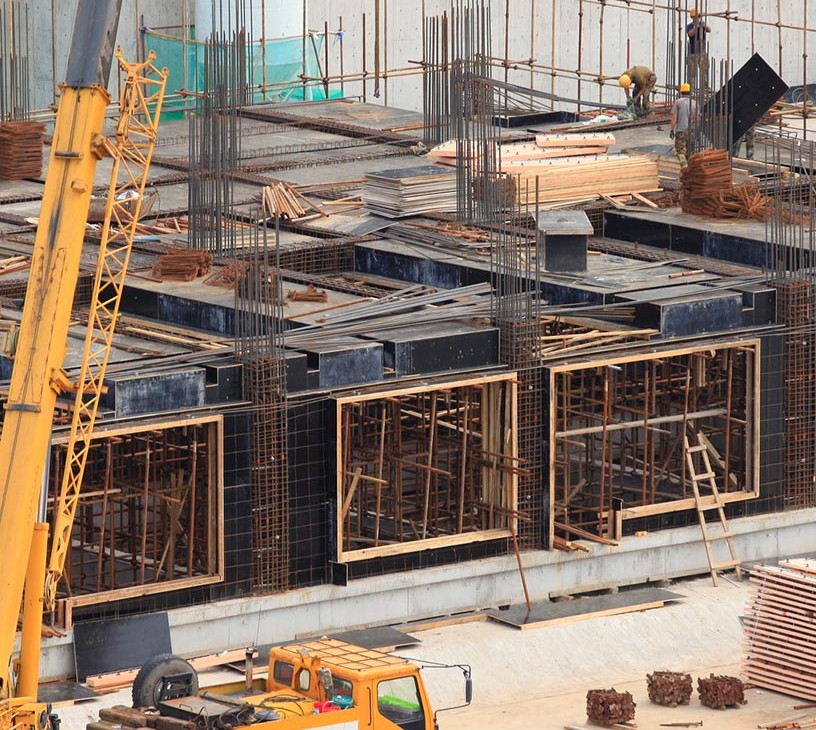
- The commercial construction market in US is undergoing a significant transformation, driven by technological integration and a heightened focus on sustainability. This evolution moves beyond traditional building methods to embrace digital workflows and innovative materials. Key drivers include substantial investments in public infrastructure and the expansion of corporate facilities, particularly for technology and logistics hubs.
- Firms are increasingly adopting advanced tools to enhance project efficiency. For instance, a developer of a large mixed-use project might leverage building information modeling (BIM) to create a dynamic 3D model, enabling seamless collaboration between architects, engineers, and contractors.
- This approach mitigates costly rework by identifying system clashes before construction begins, ensuring that complex mechanical, electrical, and plumbing installations are optimized. However, the industry grapples with persistent challenges, including skilled labor shortages and volatile material costs, which exert pressure on budgets and timelines.
- Trends such as prefabrication and modular construction are gaining traction as viable strategies to address these issues, promising faster, more controlled, and less wasteful project delivery, ultimately reshaping the competitive landscape for all stakeholders involved in bringing modern commercial structures to life.
What will be the Size of the US Commercial Construction Market during the forecast period?
Get Key Insights on Market Forecast (PDF) Get Free Sample
How is the US Commercial Construction Market Segmented?
The us commercial construction industry research report provides comprehensive data (region-wise segment analysis), with forecasts and estimates in "USD billion" for the period 2026-2030, as well as historical data from 2020-2024 for the following segments.
- Sector
- Private construction
- Public construction
- Type
- New construction
- Renovation
- End-user
- Office buildings
- Healthcare facilities
- Retail spaces
- Hotels and hospitality
- Others
- Geography
- North America
- US
- North America
By Sector Insights
The private construction segment is estimated to witness significant growth during the forecast period.
The private construction segment is shaped by robust commercial real estate development, encompassing diverse structures from corporate offices to industrial warehouses. Investment is heavily geared toward integrating sustainable technologies and achieving long-term facility lifecycle management.
Modern office projects increasingly require advanced structural engineering and meticulous MEP systems coordination to support hybrid work models. Industrial growth, fueled by e-commerce, demands sophisticated logistics hubs, while the healthcare sector is expanding with specialized outpatient facilities.
Developers utilize advanced project management software for construction cost estimation and subcontractor management. The adoption of building information modeling (BIM) enhances planning accuracy, reducing rework by up to 15%.
This focus on digital tools and geotechnical engineering ensures projects meet modern efficiency and resilience standards.
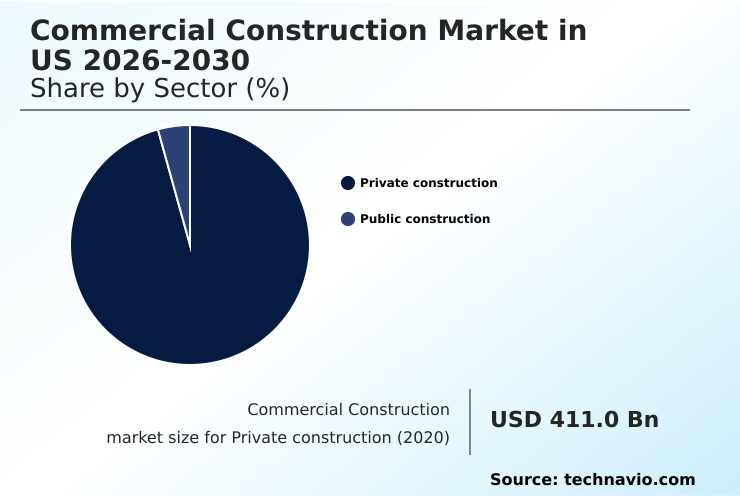
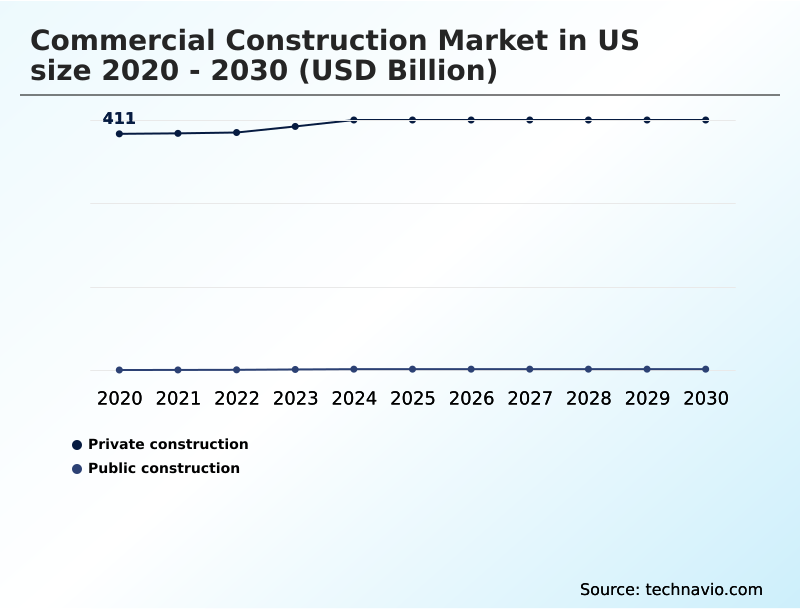
The Private construction segment was valued at USD 434 billion in 2024 and showed a gradual increase during the forecast period.
Market Dynamics
Our researchers analyzed the data with 2025 as the base year, along with the key drivers, trends, and challenges. A holistic analysis of drivers will help companies refine their marketing strategies to gain a competitive advantage.
- Strategic decision-making in the commercial construction market in US is increasingly complex, requiring a thorough analysis of long-term value and operational efficiency. The debate over modular vs traditional construction timeline comparison is central to project planning, as offsite methods can significantly accelerate delivery.
- Simultaneously, evaluating the roi of sustainable building materials has become a critical exercise for developers aiming to meet both regulatory demands and corporate ESG goals. The role of bim in reducing project costs is undisputed, offering tangible savings through clash detection and optimized scheduling.
- However, even with advanced tools, firms must implement robust strategies for managing construction labor shortages, a persistent issue that threatens project viability. Addressing this requires a multi-faceted approach, from workforce development programs to the adoption of labor-saving technologies.
- Furthermore, the impact of interest rates on construction financing directly influences project feasibility, compelling firms to seek alternative funding models and practice rigorous financial oversight. Firms that excel in green building project management often report client utility savings that are twice as high as those using conventional methods, providing a powerful competitive differentiator.
- Ultimately, effective construction project risk management strategies are essential for navigating these interconnected challenges and capitalizing on market opportunities.
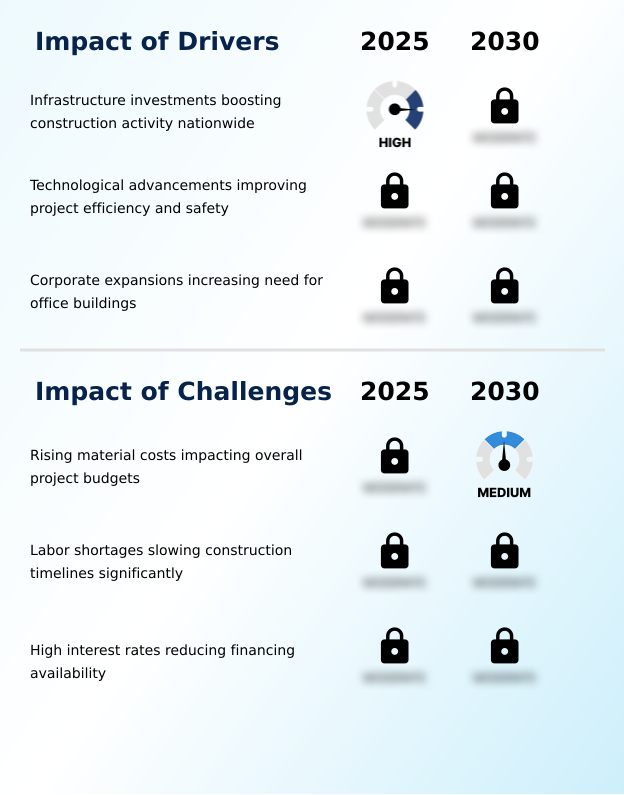
What are the key market drivers leading to the rise in the adoption of US Commercial Construction Industry?
- Nationwide infrastructure investments are a key driver for the market, significantly boosting construction activity.
- Growth in the commercial construction market in US is propelled by technological advancements and strategic investments. The use of digital twin technology is becoming a cornerstone of modern projects, offering a virtual replica for lifecycle management.
- This, combined with virtual reality walkthroughs, enhances stakeholder collaboration and decision-making. Federal and state-level backing for urban infrastructure projects, often structured as public-private partnerships in construction, creates sustained demand.
- A significant driver is the push for carbon-neutral construction, with firms using advanced framing solutions and structural insulated panels to create highly efficient buildings.
- The adoption of integrated project delivery models has been shown to improve project outcomes by 15% by fostering better alignment among teams.
- This emphasis on technology and resilient building design ensures the industry can meet the demands of a modern economy.
What are the market trends shaping the US Commercial Construction Industry?
- The adoption of modular construction is an emerging market trend. This approach is driven by the demand for faster project delivery and increased efficiency.
- Key trends in the commercial construction market in US are centered on efficiency and intelligence. The adoption of modular construction and offsite manufacturing is accelerating, with projects leveraging these methods seeing timelines shorten by up to 30%. This is complemented by the integration of IoT sensors for real-time construction monitoring, which has improved asset tracking accuracy by over 20%.
- Drone-based site inspection provides invaluable data for progress verification and safety compliance. Firms are also turning to predictive analytics for construction to forecast potential delays and budget overruns.
- In parallel, there's a growing movement toward adaptive reuse projects, where older buildings are retrofitted with smart building systems and energy-efficient HVAC design, transforming them into modern, high-performance assets that meet contemporary commercial demands.
What challenges does the US Commercial Construction Industry face during its growth?
- Rising material costs present a key challenge to industry growth by impacting overall project budgets.
- The commercial construction market in US faces significant headwinds that impact profitability and timelines. Persistent labor shortages challenge labor productivity in construction, extending project schedules by an average of 15% in high-demand areas. This is compounded by complex supply chain logistics for construction, where disruptions can lead to costly delays.
- Firms are adopting lean construction principles and technologies like construction robotics and automated earth-movers to mitigate these labor-related issues. Volatile pricing for sustainable building materials and components used in prefabrication requires sophisticated construction contract negotiation and construction risk assessment to protect margins.
- Navigating these financial and operational pressures is critical for firms aiming to deliver projects on time and within budget, making efficient resource management a top priority.
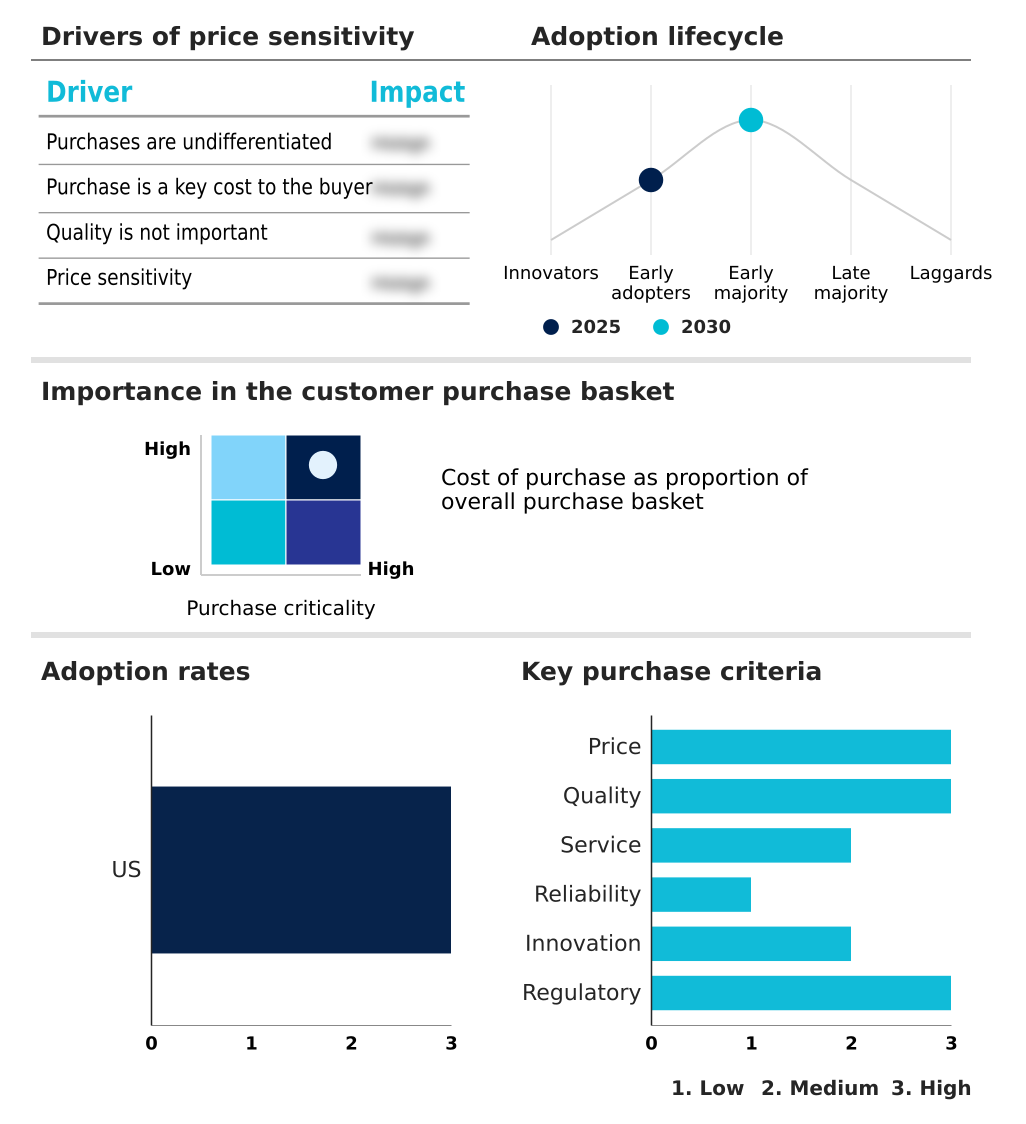
Exclusive Technavio Analysis on Customer Landscape
The us commercial construction market forecasting report includes the adoption lifecycle of the market, covering from the innovator’s stage to the laggard’s stage. It focuses on adoption rates in different regions based on penetration. Furthermore, the us commercial construction market report also includes key purchase criteria and drivers of price sensitivity to help companies evaluate and develop their market growth analysis strategies.
Customer Landscape of US Commercial Construction Industry
Competitive Landscape
Companies are implementing various strategies, such as strategic alliances, us commercial construction market forecast, partnerships, mergers and acquisitions, geographical expansion, and product/service launches, to enhance their presence in the industry.
ACS ACTIVIDADES DE - Delivering integrated commercial construction solutions, encompassing advanced data center campuses, wellness facilities, and large-scale urban redevelopment projects emphasizing innovation and quality.
The industry research and growth report includes detailed analyses of the competitive landscape of the market and information about key companies, including:
- ACS ACTIVIDADES DE
- AECOM
- Bechtel Corp.
- Clark Group
- Clayco
- DPR Construction
- Ferrovial SA
- Fluor Corp.
- Gilbane Inc.
- Hensel Phelps
- Holder Construction Group LLC
- Kiewit Corp.
- Parsons Corp.
- PCL Constructors Inc.
- Skanska AB
- STO Building Group
- The Walsh Group
- Turner Construction Co.
- Tutor Perini Corp.
Qualitative and quantitative analysis of companies has been conducted to help clients understand the wider business environment as well as the strengths and weaknesses of key industry players. Data is qualitatively analyzed to categorize companies as pure play, category-focused, industry-focused, and diversified; it is quantitatively analyzed to categorize companies as dominant, leading, strong, tentative, and weak.
Recent Development and News in Us commercial construction market
- In August 2024, a leading technology firm announced plans for a new hyperscale data center campus in the Midwest, designed to support advanced AI and cloud computing infrastructure.
- In November 2024, a major real estate investment trust acquired a portfolio of logistics facilities, with plans to upgrade them with automated sorting systems and robotics to enhance supply chain efficiency.
- In February 2025, a prominent healthcare provider broke ground on a state-of-the-art outpatient care center, featuring specialized diagnostic labs and telehealth integration to serve a growing suburban population.
- In May 2025, a global hospitality group initiated a large-scale renovation project to convert a historic downtown building into a luxury hotel, focusing on sustainable materials and preserving architectural heritage.
Dive into Technavio’s robust research methodology, blending expert interviews, extensive data synthesis, and validated models for unparalleled US Commercial Construction Market insights. See full methodology.
| Market Scope | |
|---|---|
| Page number | 182 |
| Base year | 2025 |
| Historic period | 2020-2024 |
| Forecast period | 2026-2030 |
| Growth momentum & CAGR | Accelerate at a CAGR of 3.1% |
| Market growth 2026-2030 | USD 76.1 billion |
| Market structure | Fragmented |
| YoY growth 2025-2026(%) | 3.0% |
| Key countries | US |
| Competitive landscape | Leading Companies, Market Positioning of Companies, Competitive Strategies, and Industry Risks |
Research Analyst Overview
- The commercial construction market is advancing through a period of intense technological adoption and strategic realignment. Central to this evolution is the integration of digital twin technology and project management software, which are redefining workflows from initial design to long-term operations.
- The use of building information modeling (BIM) paired with predictive analytics for construction enables superior MEP systems coordination and geotechnical engineering insights. In boardrooms, a key decision revolves around capital allocation for sustainable building materials and green building certification versus conventional approaches. Firms that have embraced integrated project delivery and lean construction principles report significant efficiency gains.
- The deployment of construction robotics, automated earth-movers, and drone-based site inspection is addressing labor productivity gaps. Furthermore, innovations like virtual reality walkthroughs, advanced framing solutions, and structural insulated panels enhance quality control. The use of prefabrication, offsite manufacturing, and materials such as self-healing concrete and cross-laminated timber is becoming standard for high-performance building envelope design.
- This shift is crucial, as firms utilizing digital tools for structural engineering have achieved up to a 15% reduction in material waste, directly impacting project profitability.
What are the Key Data Covered in this US Commercial Construction Market Research and Growth Report?
-
What is the expected growth of the US Commercial Construction Market between 2026 and 2030?
-
USD 76.1 billion, at a CAGR of 3.1%
-
-
What segmentation does the market report cover?
-
The report is segmented by Sector (Private construction, and Public construction), Type (New construction, and Renovation), End-user (Office buildings, Healthcare facilities, Retail spaces, Hotels and hospitality, and Others) and Geography (North America)
-
-
Which regions are analyzed in the report?
-
North America
-
-
What are the key growth drivers and market challenges?
-
Infrastructure investments boosting construction activity nationwide, Rising material costs impacting overall project budgets
-
-
Who are the major players in the US Commercial Construction Market?
-
ACS ACTIVIDADES DE, AECOM, Bechtel Corp., Clark Group, Clayco, DPR Construction, Ferrovial SA, Fluor Corp., Gilbane Inc., Hensel Phelps, Holder Construction Group LLC, Kiewit Corp., Parsons Corp., PCL Constructors Inc., Skanska AB, STO Building Group, The Walsh Group, Turner Construction Co. and Tutor Perini Corp.
-
Market Research Insights
- The commercial construction market in US is defined by a dynamic interplay between technological innovation and economic pressures. Firms are leveraging smart building systems and real-time construction monitoring to gain a competitive edge, with some achieving a 20% reduction in project delays.
- The emphasis on sustainability is evident in adaptive reuse projects and carbon-neutral construction, as organizations align with stringent building code compliance. These initiatives are not merely cosmetic; the adoption of energy-efficient HVAC design can lower operational expenditures by over 15%.
- Furthermore, as construction risk assessment becomes more sophisticated, companies are refining their construction contract negotiation strategies to mitigate the impact of market volatility. Effective subcontractor management and precise construction cost estimation remain critical for maintaining profitability in a complex environment.
We can help! Our analysts can customize this us commercial construction market research report to meet your requirements.
 RIA -
RIA - 
