US Interactive Residential Security Market Size 2024-2028
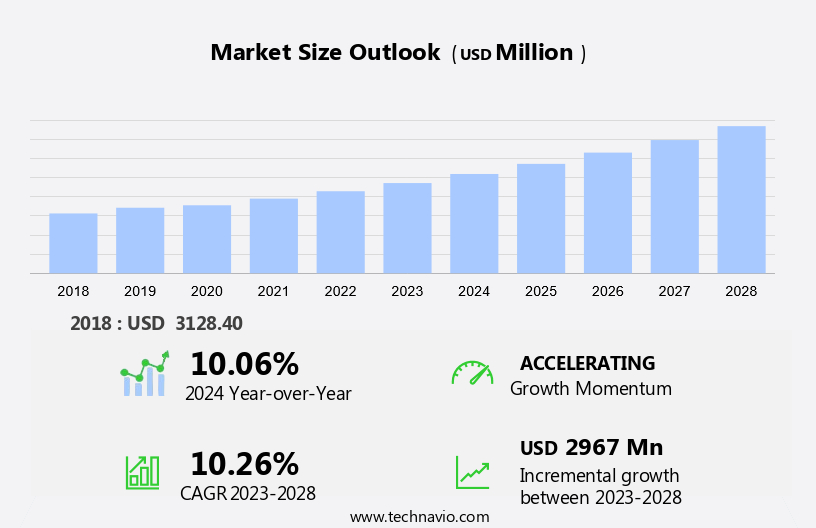
The US interactive residential security market size is forecast to increase by USD 2.97 billion at a CAGR of 10.26% between 2023 and 2028.
- In the US residential security market, the rising concern for personal safety and increasing crime rates have fueled the demand for advanced and smart security solutions. companies are responding to this trend by launching innovative products, such as sensors and cameras, integrated with remote monitoring capabilities. These solutions enable homeowners to monitor their properties in real-time and receive instant alerts in case of suspicious activity. However, the high initial costs associated with these systems may act as a barrier to adoption, particularly for single-parent families and other budget-conscious households.
- Additionally, the integration of cybersecurity measures is becoming increasingly important to protect against potential hacking threats. Despite this, the market is expected to continue growing, driven by the desire for enhanced home security and the ongoing development of cutting-edge technology. As smart city projects continue to roll out across the US, the interactive residential security market is expected to grow further, offering new opportunities for companies to expand their offerings.
What will be the Size of the Market During the Forecast Period?
Similarly, smart devices, such as cameras and sensors, play a crucial role in modern home security systems. These devices can be connected to the internet, enabling cybersecurity measures to protect against potential intrusions. Moreover, the increasing popularity of Smart Homes and smart city projects further enhances the demand for advanced home security systems. However, it is essential to address technical flaws that may arise in these systems. For instance, ensuring proper power management intergrated circuit and visit management can prevent false alarms and maintain system reliability. Single-parent families and apartment units, in particular, may benefit significantly from these advanced security solutions.
Market Segmentation
The market research report provides comprehensive data (region-wise segment analysis), with forecasts and estimates in "USD billion" for the period 2024-2028, as well as historical data from 2018-2022 for the following segments.
- Type
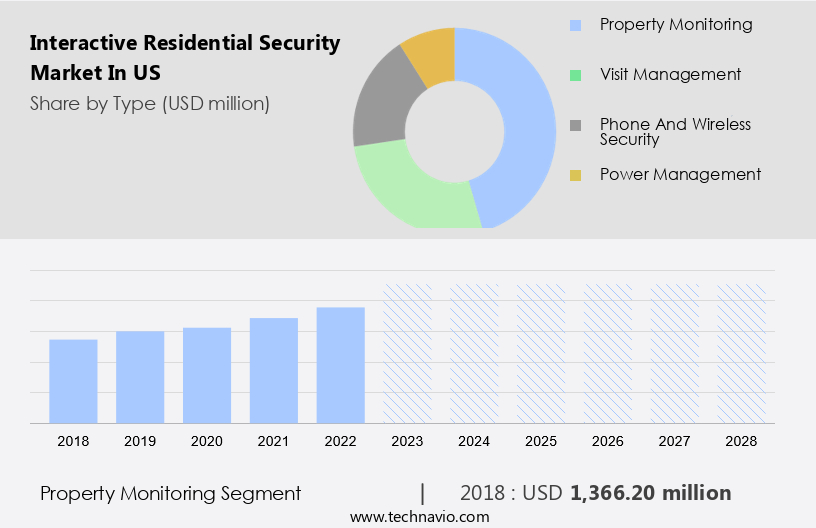
- Property monitoring
- Visit management
- Phone and wireless security
- Power management
- Application
- Apartment
- Standalone unit
- Service
- Intrusion protection
- Remote monitoring
- Security system integration service
- Others
- Geography
- US
By Type Insights
The property monitoring segment is estimated to witness significant growth during the forecast period. In the United States residential security market, interactive property monitoring solutions are gaining popularity as homeowners seek advanced methods to safeguard their homes. These systems incorporate technologies such as video surveillance, alarm systems, and access control, as well as fire protection services. The primary motivation for homeowners to invest in property monitoring is the heightened concern for security, coupled with technological advancements that make monitoring systems more effective and cost-efficient. High-definition video surveillance systems, real-time alerts, and remote access capabilities are among the innovations driving the growth of the property monitoring segment. Hardware and software components work together to ensure comprehensive protection, with system complexities designed to cater to various home security needs. The integration of these systems with smart home technology further enhances their appeal and functionality.
Get a glance at the market share of various segments Request Free Sample
The property monitoring segment was valued at USD 1.37 billion in 2018 and showed a gradual increase during the forecast period.
Market Dynamic
Our market researchers analyzed the data with 2023 as the base year, along with the key drivers, trends, and challenges. A holistic analysis of drivers will help companies refine their marketing strategies to gain a competitive advantage.The interactive residential security market in the US is witnessing significant growth as homeowners increasingly prioritize safety and convenience. This market encompasses a range of home security systems designed to protect homes against various threats, including theft and robbery, as well as providing energy-saving solutions and smart features. One of the primary drivers of this market is the integration of wireless technology and miniaturized sensors into home security systems. These advancements enable remote monitoring and real-time alerts, allowing homeowners to stay informed about their property's security status from anywhere.
US Interactive Residential Security Market Driver
- Rising crime rates across the US are the key drivers of the market. The escalating crime rates in the United States have fueled the demand for sophisticated home security systems. According to the FBI's Uniform Crime Reporting (UCR) Program, the US experienced a concerning rise in violent crimes in 2022, with property crimes being more common. In fact, the FBI reported 1,954.4 property crimes per 100,000 people, compared to 380.7 violent crimes per 100,000 people. Among property crimes, larceny/theft was the most frequent, followed by motor vehicle theft and burglary.
- Similarly, this trend has heightened homeowners' concerns regarding home safety, leading to an increase in investments in advanced interactive security systems. These systems integrate miniaturized Sensors, internet usage, and smart devices for home automation, offering DIY solutions, video surveillance systems, fire protection systems, and access control systems. Homeowners can remotely monitor and control these systems using their smartphones or computers, providing them with peace of mind and enhanced security for their homes.
US Interactive Residential Security Market Trends
- The increasing focus of market players on new product launches is the upcoming trend in the market. In the US market, the interactive residential security sector is witnessing substantial growth due to the heightened priority given by companies to introduce advanced security solutions. As competition intensifies and consumer demands shift, companies are allocating substantial resources toward research and development. This investment is geared towards introducing innovative security systems that offer improved threat detection capabilities, often leveraging technologies such as artificial intelligence and machine learning. Additionally, there is a growing emphasis on ensuring compatibility with smart home ecosystems to provide enhanced convenience and control for homeowners.
- For instance, Brinks Home, a subsidiary of Monitronics International Inc., unveiled new offerings in August 2024 to cater to these evolving needs. The importance of cybersecurity in residential security systems is also gaining prominence, as the increasing prevalence of digital connectivity necessitates strong security measures to protect against potential cyber threats. Furthermore, single-parent families and other demographics prioritize safety and security, making the market particularly relevant to their needs. In the context of smart city projects, interactive residential security systems are increasingly being integrated into urban planning initiatives to promote public safety and security.
US Interactive Residential Security Market Challenge
- High initial costs related to interactive residential security solutions are the key challenges affecting the market growth. The Interactive Residential Security Market in the US continues to gain traction with the integration of advanced technologies such as Intruder Alarm Systems, Remote Monitoring Services, and Cloud services. Smart city ideas and Security concerns have become a priority for homeowners, leading to an increased adoption of Home Security Systems and Smart Home Security solutions. However, the high initial costs associated with these systems remain a significant barrier to entry for potential customers. Installing a comprehensive security solution involves substantial expenses for hardware components like cameras, sensors, smart locks, and control panels, as well as professional installation fees. For instance, a feature-rich system from leading providers such as ADT or Vivint can cost several hundred to thousands of dollars upfront, depending on the desired level of customization and features.
- Moreover, ongoing subscription fees for monitoring services add to the long-term financial commitment. Despite these costs, the benefits of interactive residential security systems, including remote access, real-time alerts, and advanced analytics, make them an attractive investment for homeowners seeking peace of mind and enhanced safety. As the market continues to evolve, providers are exploring various pricing models and financing options to make these systems more accessible to a wider audience.
Exclusive Customer Landscape
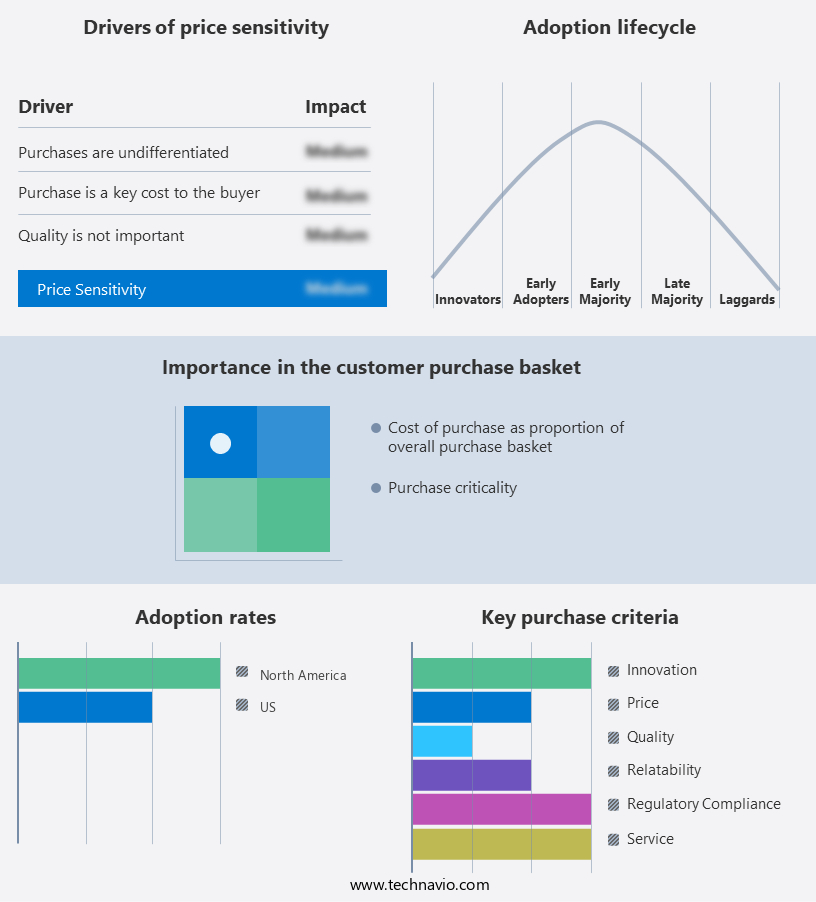
The market forecasting report includes the adoption lifecycle of the market, covering from the innovator's stage to the laggard's stage. It focuses on adoption rates in different regions based on penetration. Furthermore, the report also includes key purchase criteria and drivers of price sensitivity to help companies evaluate and develop their market growth analysis strategies.
Customer Landscape
Key Companies & Market Insights
Companies are implementing various strategies, such as strategic alliances, partnerships, mergers and acquisitions, geographical expansion, and product/service launches, to enhance their presence in the market.
ADT Inc: The company offers interactive residential security in US such as ADT interactive home security system with smart alarm system.
The market research and growth report includes detailed analyses of the competitive landscape of the market and information about key companies, including:
- Alphabet Inc.
- AT and T
- Comcast Corp.
- Cove Smart LLC
- East West Manufacturing
- Frontpoint Security Solutions LLC
- Honeywell International Inc.
- Leviton Manufacturing Co. Inc.
- LG Electronics Inc.
- Link Interactive
- Monitronics International Inc.
- NETGEAR Inc.
- Nice SpA
- Nortek Security and Control LLC
- Ring LLC
- Samsung Electronics Co. Ltd.
- Scout Security Ltd.
- Simplisafe Inc.
- Somfy Group
- Vivint Inc.
- Wyze Labs Inc.
Qualitative and quantitative analysis of companies has been conducted to help clients understand the wider business environment as well as the strengths and weaknesses of key market players. Data is qualitatively analyzed to categorize companies as pure play, category-focused, industry-focused, and diversified; it is quantitatively analyzed to categorize companies as dominant, leading, strong, tentative, and weak.
Research Analyst Overview
Residential security is a critical concern for homeowners in the US, with the demand for advanced security systems continuing to grow. These systems encompass various safety measures such as intruder alarm systems, access control systems, fire protection systems, and Video Surveillance Systems. Smart features, energy-saving solutions, and wireless technology are increasingly popular in residential security systems. Miniaturized sensors and cameras enable remote monitoring services, while cloud services offer convenience and flexibility. Home automation integrates security systems with other smart devices, allowing homeowners to manage their property from anywhere. DIY solutions have gained traction due to their affordability and ease of installation.
Furthermore, remote monitoring capabilities allow them to keep an eye on their property even when they are away, providing peace of mind and enhanced safety. Burglary statistics indicate that residential properties are targeted more frequently than commercial establishments. As such, property monitoring remains a critical concern for homeowners. The integration of smart home security systems into daily life can help mitigate these risks and ensure the safety of families and their belongings. In conclusion, the interactive residential security market in the US continues to evolve, offering innovative solutions that cater to homeowners' needs for safety, convenience, and energy efficiency. By addressing technical challenges and focusing on cybersecurity, this market is poised to deliver significant value to its customers.
However, technical flaws in these systems can pose risks, necessitating the need for strong Cybersecurity measures. Theft and robbery statistics, particularly in single-parent families, fuel the market's growth. Smart city projects also contribute to the adoption of advanced security systems, with internet usage and smart devices playing a significant role. Installation costs and system complexities remain challenges, but the benefits of enhanced property security and personal safety outweigh these concerns. Hardware and software innovations continue to shape the market, with artificial intelligence, facial recognition, and cloud-based surveillance gaining popularity. Fire protection services, access control systems, and alarm systems are essential components of a comprehensive residential security solution. Property monitoring, power management, visit management, and apartment/unit security are other areas of focus. Overall, the interactive residential security market offers numerous opportunities for innovation and growth.
|
Market Scope |
|
|
Report Coverage |
Details |
|
Page number |
183 |
|
Base year |
2023 |
|
Historic period |
2018-2022 |
|
Forecast period |
2024-2028 |
|
Growth momentum & CAGR |
Accelerate at a CAGR of 10.26% |
|
Market growth 2024-2028 |
USD 2.97 billion |
|
Market structure |
Fragmented |
|
YoY growth 2023-2024(%) |
10.06 |
|
Key companies profiled |
ADT Inc., Alphabet Inc., AT and T, Comcast Corp., Cove Smart LLC, East West Manufacturing, Frontpoint Security Solutions LLC, Honeywell International Inc., Leviton Manufacturing Co. Inc., LG Electronics Inc., Link Interactive, Monitronics International Inc., NETGEAR Inc., Nice SpA, Nortek Security and Control LLC, Ring LLC, Samsung Electronics Co. Ltd., Scout Security Ltd., Simplisafe Inc., Somfy Group, Vivint Inc., and Wyze Labs Inc. |
|
Market dynamics |
Parent market analysis, market growth inducers and obstacles,market forecast , fast-growing and slow-growing segment analysis, COVID-19 impact and recovery analysis and future consumer dynamics, market condition analysis for the forecast period |
|
Customization purview |
If our market report has not included the data that you are looking for, you can reach out to our analysts and get segments customized. |
|
Competitive landscape |
Leading Companies, Market Positioning of Companies, Competitive Strategies, and Industry Risks |
What are the Key Data Covered in this Market Research Report?
- CAGR of the market during the forecast period
- Detailed information on factors that will drive the market growth and forecasting between 2024 and 2028
- Precise estimation of the size of the market and its contribution of the market in focus to the parent market
- Accurate predictions about upcoming market growth and trends and changes in consumer behaviour
- Growth of the market across US
- Thorough analysis of the market's competitive landscape and detailed information about companies
- Comprehensive analysis of factors that will challenge the growth of market companies
We can help! Our analysts can customize this market research report to meet your requirements Get in touch
 RIA -
RIA - 
