Used Car Market Size 2026-2030
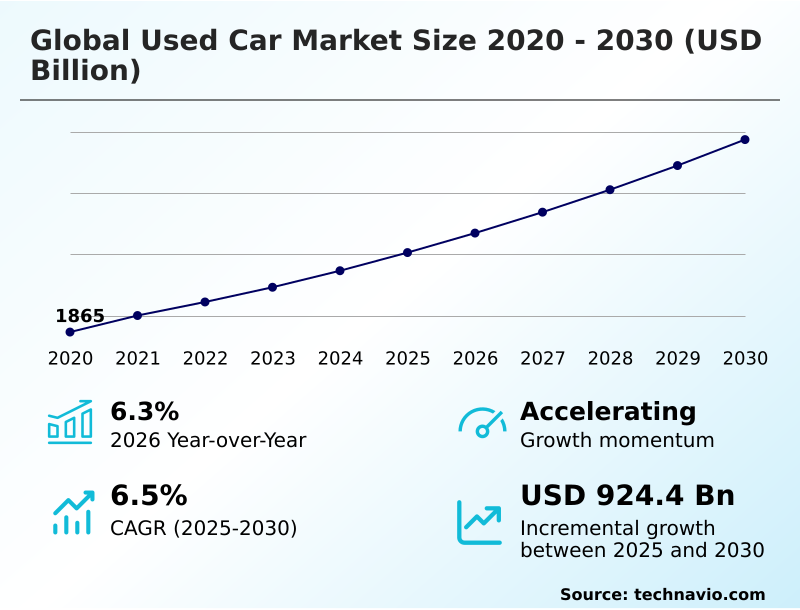
The used car market size is valued to increase by USD 924.4 billion, at a CAGR of 6.5% from 2025 to 2030. Escalating new vehicle costs and heightened consumer price sensitivity will drive the used car market.
Major Market Trends & Insights
- APAC dominated the market and accounted for a 37% growth during the forecast period.
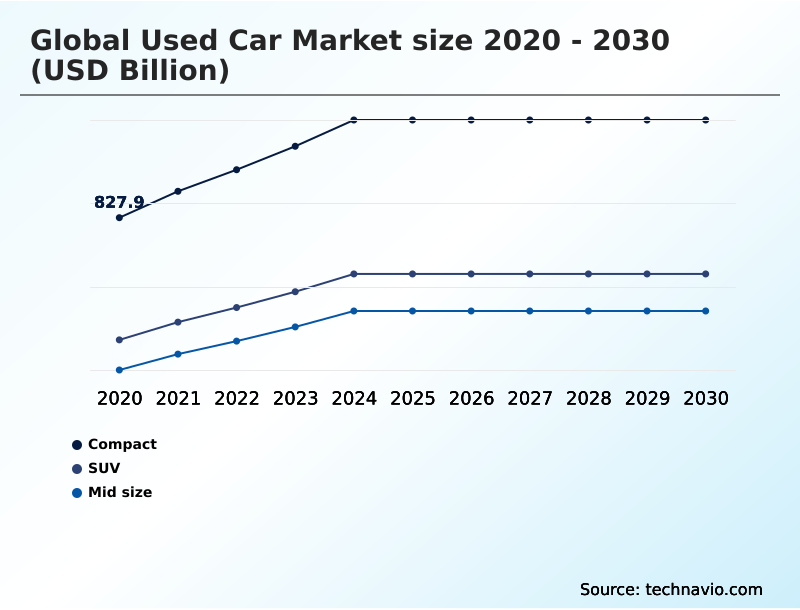
- By Vehicle Type - Compact segment was valued at USD 1048.1 billion in 2024
- By Channel - Unorganized segment accounted for the largest market revenue share in 2024
Market Size & Forecast
- Market Opportunities: USD 1574.8 billion
- Market Future Opportunities: USD 924.4 billion
- CAGR from 2025 to 2030 : 6.5%
Market Summary
- The used car market is a dynamic ecosystem shaped by the core principles of affordability and value. A central driver is the widening affordability gap for new vehicles, which steers a large consumer base toward pre-owned options.
- This shift is supported by the digital transformation of the industry, where an e-commerce platform can leverage a dynamic pricing algorithm to offer transparent value. For instance, a dealership group can implement an omnichannel retail strategy, integrating online vehicle valuation tools with physical showrooms to streamline the trade-in valuation tool and process.
- However, challenges persist in managing inventory turnover ratio, especially with the influx of vehicles requiring complex reconditioning for features like advanced driver-assistance systems. Effective vehicle lifecycle management and robust automotive financing solutions are critical for navigating market fragmentation and maintaining profitability in this evolving landscape, where a comprehensive vehicle history report is now a standard expectation.
What will be the Size of the Used Car Market during the forecast period?
Get Key Insights on Market Forecast (PDF) Get Free Sample
How is the Used Car Market Segmented?
The used car industry research report provides comprehensive data (region-wise segment analysis), with forecasts and estimates in "USD billion" for the period 2026-2030, as well as historical data from 2020-2024 for the following segments.
- Vehicle type
- Compact
- SUV
- Mid size
- Channel
- Unorganized
- Organized
- Fuel type
- Petrol
- Diesel
- Electric
- Geography
- APAC
- China
- Japan
- India
- North America
- US
- Canada
- Mexico
- Europe
- Germany
- UK
- France
- Middle East and Africa
- Saudi Arabia
- South Africa
- UAE
- South America
- Brazil
- Argentina
- Colombia
- Rest of World (ROW)
- APAC
By Vehicle Type Insights
The compact segment is estimated to witness significant growth during the forecast period.
The compact vehicle segment remains a cornerstone of the used car market, driven by a compelling value proposition of affordability and operational efficiency.
These vehicles serve as the most accessible entry point into ownership, appealing to budget-conscious consumers through lower acquisition prices, superior fuel economy, and reduced insurance premiums.
The high sales volume of new compacts ensures a deep and liquid secondary market with extensive consumer choice and predictable depreciation.
While facing strategic challenges from the rise of sub-compact SUVs, which see a buyer migration rate 20% higher, the segment maintains its crucial role.
Its relevance is anchored by its ability to deliver unparalleled economic efficiency and practicality, a core appeal that resonates with a stable base of pragmatic buyers globally and requires a distinct inventory acquisition strategy.
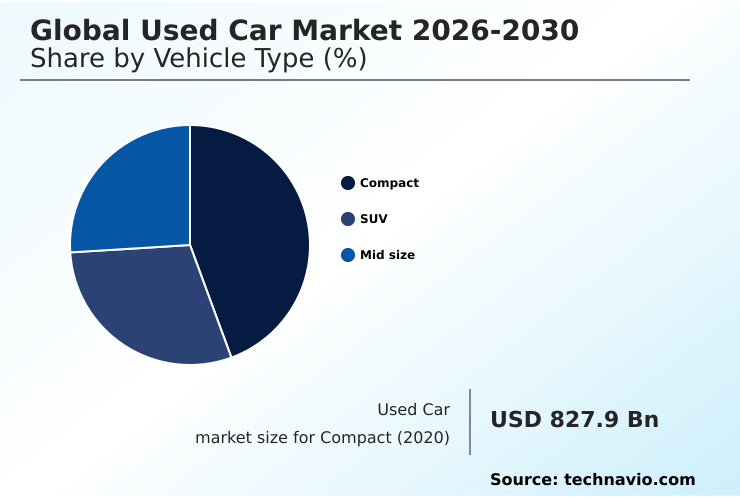
The Compact segment was valued at USD 1048.1 billion in 2024 and showed a gradual increase during the forecast period.
Regional Analysis
APAC is estimated to contribute 37% to the growth of the global market during the forecast period.Technavio’s analysts have elaborately explained the regional trends and drivers that shape the market during the forecast period.
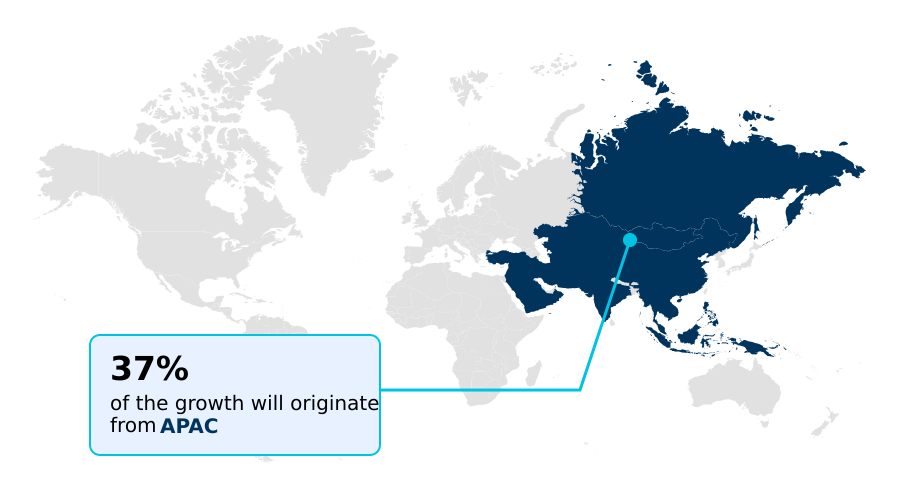
See How Used Car Market Demand is Rising in APAC Get Free Sample
The geographic landscape of the used car market is characterized by diverse regional dynamics and varying stages of maturity.
APAC is experiencing the fastest expansion, growing at a rate approximately 25% higher than North America, driven by rising disposable incomes and the formalization of markets through digital platforms.
This digital shift, a key aspect of cross-border trade, is improving market transparency and has reduced transaction times by over 30% in some emerging economies.
In mature markets like Europe, regulatory compliance with urban access restrictions is a dominant factor, influencing vehicle values. The right-hand-drive market in the UK remains somewhat insulated, while North America grapples with managing a vast, yet fragmenting, supply chain.
This global variance requires tailored procurement strategies to address regional consumer protection laws and asset depreciation.
Market Dynamics
Our researchers analyzed the data with 2025 as the base year, along with the key drivers, trends, and challenges. A holistic analysis of drivers will help companies refine their marketing strategies to gain a competitive advantage.
- Navigating the modern used car market requires a deep understanding of several interconnected factors. A key consideration is the impact of leasing on used inventory, as the flow of off-lease vehicles is a primary source of high-quality stock for many dealers.
- For the growing electric vehicle segment, a thorough used EV battery health assessment is non-negotiable, often being more critical to value than mileage. The debate between online vs physical used car sales continues, with most successful retailers adopting omnichannel strategies for used car retailers to satisfy diverse consumer preferences.
- The benefits of certified pre-owned program benefits, such as warranties and rigorous inspections, are a powerful tool for building consumer trust in online car marketplaces and justifying premium pricing. Furthermore, businesses must contend with cross-border used vehicle trade regulations and evolving legal aspects of private car sales.
- Proactive management of these issues, from the reconditioning process for modern vehicles to data analytics for used car pricing, is essential for success.
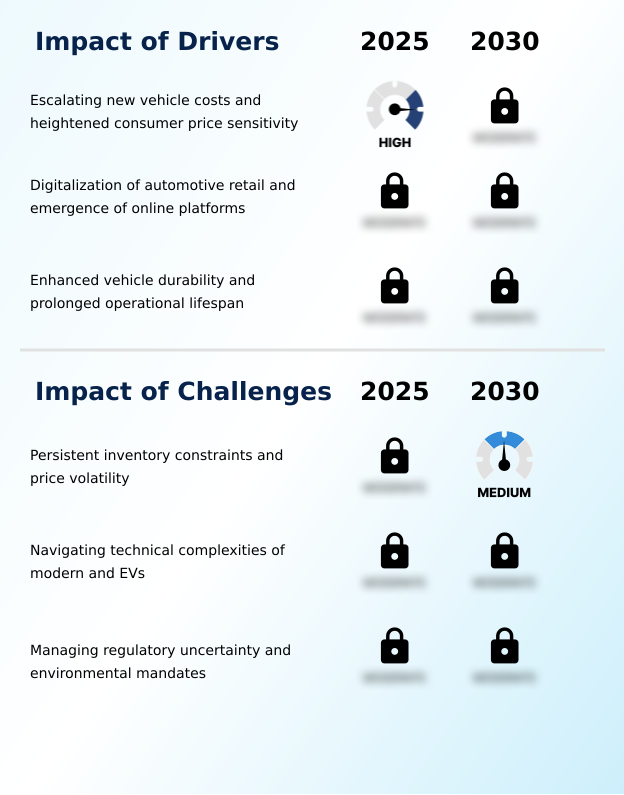
What are the key market drivers leading to the rise in the adoption of Used Car Industry?
- Escalating new vehicle costs, coupled with heightened consumer price sensitivity, serves as a primary driver for the expansion of the used car market.
- The market's primary drivers are both economic and technological. The persistent affordability gap between new and used vehicles continues to funnel a large consumer base into the secondary market.
- Digitalization acts as a powerful accelerator; online retail platforms have expanded dealer reach by over 300% by breaking down geographical barriers. These platforms offer enhanced transparency through tools like trade-in valuation tools and detailed vehicle information, strengthening consumer confidence.
- Furthermore, the remarkable improvement in modern vehicle durability has extended the average profitable vehicle lifecycle by nearly three years.
- This heightened reliability, supported by comprehensive scrappage policy impact analysis and a robust dealer-to-dealer auction network, reinforces the value proposition of purchasing a pre-owned vehicle, making it a sound financial decision.
What are the market trends shaping the Used Car Industry?
- The ongoing digital disruption, highlighted by the emergence of agile, technology-driven startups, represents a fundamental trend reshaping the market's traditional operational models and competitive dynamics.
- Key market trends are centered on technology and evolving consumer preferences. The rise of vehicle subscription services and other flexible ownership models is altering traditional purchasing patterns, with early adopters reporting a 15% increase in customer lifetime value over single-transaction buyers. This trend necessitates sophisticated remarketing processes.
- Simultaneously, the growth of the used EV market is compelling dealers to adopt new diagnostic capabilities; those offering certified battery health reports see a 50% reduction in sales objections. The expansion of peer-to-peer marketplaces continues, driven by technology that facilitates secure consumer-to-consumer transactions and provides online vehicle valuation, increasing market liquidity.
- This shift demands that traditional players innovate their own title verification and digital retailing offerings to remain competitive.
What challenges does the Used Car Industry face during its growth?
- Persistent inventory constraints and significant price volatility present a key challenge affecting the industry's growth trajectory and profitability.
- Persistent challenges in the used car market center on inventory, technology, and regulation. A structural scarcity of desirable late-model vehicles has driven wholesale acquisition costs up by over 20% in key segments, directly impacting retail affordability.
- The influx of technologically advanced vehicles creates significant operational hurdles; reconditioning costs for cars with complex advanced driver-assistance systems have increased by an estimated 40%. This technological shift requires substantial investment in training and equipment. Furthermore, navigating regulatory uncertainty, from end-of-life vehicle mandates to evolving consumer protection laws, adds complexity.
- This environment makes residual value forecasting exceptionally difficult and threatens the stability of asset depreciation, a core principle for both franchised dealership networks and independent used car dealers.
Exclusive Technavio Analysis on Customer Landscape
The used car market forecasting report includes the adoption lifecycle of the market, covering from the innovator’s stage to the laggard’s stage. It focuses on adoption rates in different regions based on penetration. Furthermore, the used car market report also includes key purchase criteria and drivers of price sensitivity to help companies evaluate and develop their market growth analysis strategies.
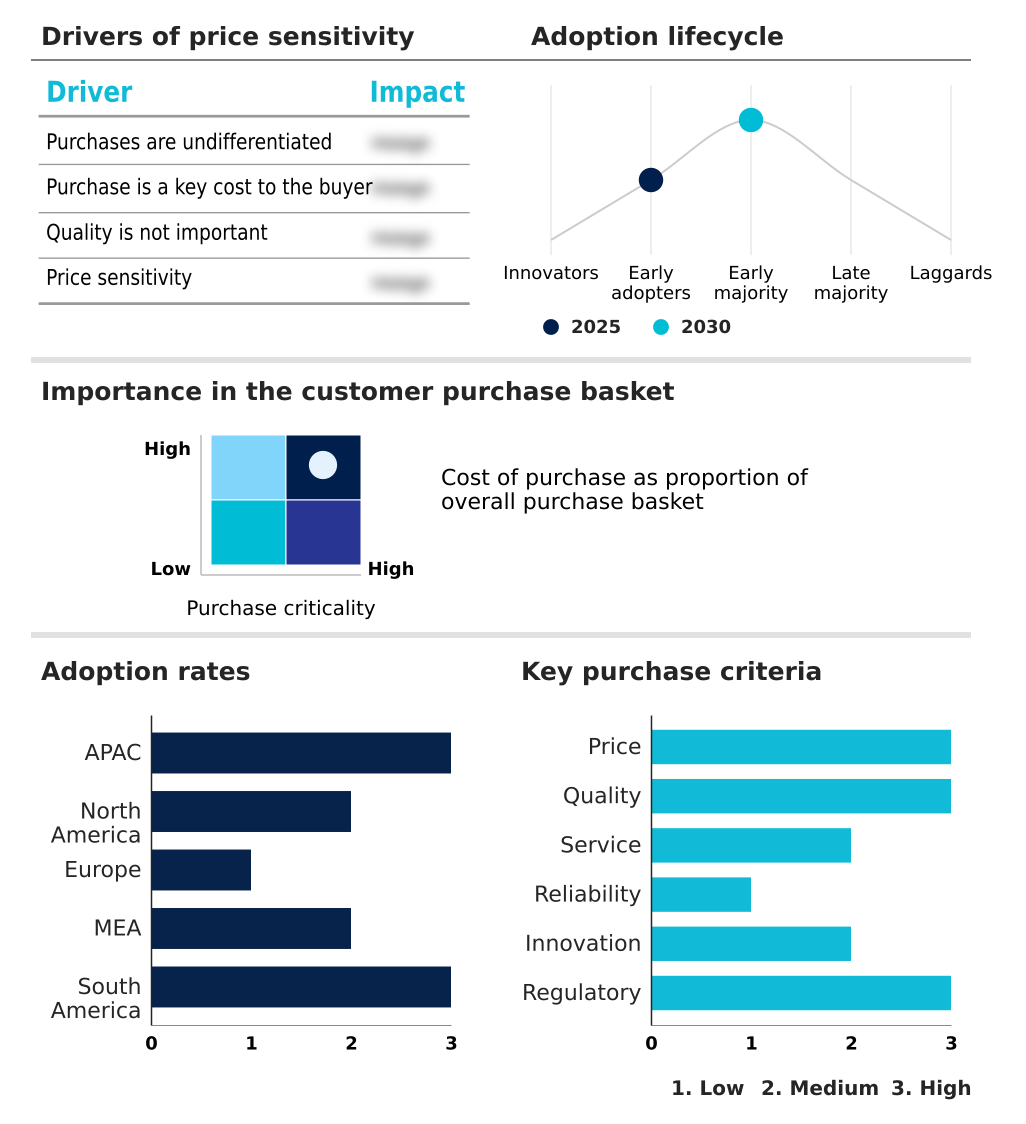
Customer Landscape of Used Car Industry
Competitive Landscape
Companies are implementing various strategies, such as strategic alliances, used car market forecast, partnerships, mergers and acquisitions, geographical expansion, and product/service launches, to enhance their presence in the industry.
Arnold Clark Automobiles Ltd. - Provides a full suite of used vehicle services, including certified sales, trade-in options, and integrated financing to facilitate the customer purchasing process.
The industry research and growth report includes detailed analyses of the competitive landscape of the market and information about key companies, including:
- Arnold Clark Automobiles Ltd.
- Asbury Automotive Group Inc.
- AutoNation Inc.
- Autotrader Inc
- CarGurus Inc.
- CarMax Inc.
- Cars.com LLC
- Cars24 Services Pvt. Ltd.
- Carvana Co.
- Droom Technology Pvt. Ltd.
- Emil Frey Group
- Group 1 Automotive Inc.
- Guazi
- Lithia Motors Inc.
- Manheim
- mobile.de GmbH
- OLX Global B.V.
- Penske Automotive Group Inc.
- Scout24 AG
- Sonic Automotive Inc.
Qualitative and quantitative analysis of companies has been conducted to help clients understand the wider business environment as well as the strengths and weaknesses of key industry players. Data is qualitatively analyzed to categorize companies as pure play, category-focused, industry-focused, and diversified; it is quantitatively analyzed to categorize companies as dominant, leading, strong, tentative, and weak.
Recent Development and News in Used car market
- In May 2025, Carvana Co. reported a 38% year-over-year revenue increase to $4.232 billion, underscoring the accelerating consumer shift towards fully online vehicle transaction models.
- In April 2025, the State Bank of India announced an auction for its used vehicles on an 'as is where is' basis, inviting bidders to inspect the vehicles and participate in a final e-auction, reflecting a move towards formalized asset disposal.
- In February 2025, Edmunds Incorporated reported that the volume of lease returns had reached its lowest point since 2024, signaling a significant industry-wide challenge in sourcing high-quality, late-model used vehicle inventory.
- In January 2025, Cars.com Incorporated finalized its acquisition of DealerClub for $25 million, a strategic action aimed at enhancing its wholesale operations and expanding its digital presence within the dealer-to-dealer auction space.
Dive into Technavio’s robust research methodology, blending expert interviews, extensive data synthesis, and validated models for unparalleled Used Car Market insights. See full methodology.
| Market Scope | |
|---|---|
| Page number | 297 |
| Base year | 2025 |
| Historic period | 2020-2024 |
| Forecast period | 2026-2030 |
| Growth momentum & CAGR | Accelerate at a CAGR of 6.5% |
| Market growth 2026-2030 | USD 924.4 billion |
| Market structure | Fragmented |
| YoY growth 2025-2026(%) | 6.3% |
| Key countries | China, Japan, India, South Korea, Australia, Indonesia, US, Canada, Mexico, Germany, UK, France, Italy, Spain, Poland, Saudi Arabia, South Africa, UAE, Egypt, Turkey, Brazil, Argentina and Colombia |
| Competitive landscape | Leading Companies, Market Positioning of Companies, Competitive Strategies, and Industry Risks |
Research Analyst Overview
- The used car market has matured into a sophisticated ecosystem where a comprehensive vehicle history report and a multi-point inspection are standard consumer expectations. Leading retailers are leveraging an omnichannel retail strategy to blend digital convenience with physical presence, a move that has been shown to boost customer loyalty by over 20%.
- The industry's reliance on the wholesale auction platform for inventory acquisition is being supplemented by advanced dealer management systems that optimize stock levels. While a certified pre-owned program remains a key value differentiator, new challenges are emerging. Accurately assessing high-voltage battery health in electric vehicles and forecasting the residual value of cars with over-the-air software updates require new expertise.
- The integration of a virtual vehicle tour and robust automotive financing solutions within a single e-commerce platform represents the new frontier for customer engagement and vehicle lifecycle management.
What are the Key Data Covered in this Used Car Market Research and Growth Report?
-
What is the expected growth of the Used Car Market between 2026 and 2030?
-
USD 924.4 billion, at a CAGR of 6.5%
-
-
What segmentation does the market report cover?
-
The report is segmented by Vehicle Type (Compact, SUV, and Mid size), Channel (Unorganized, and Organized), Fuel Type (Petrol, Diesel, and Electric) and Geography (APAC, North America, Europe, Middle East and Africa, South America)
-
-
Which regions are analyzed in the report?
-
APAC, North America, Europe, Middle East and Africa and South America
-
-
What are the key growth drivers and market challenges?
-
Escalating new vehicle costs and heightened consumer price sensitivity, Persistent inventory constraints and price volatility
-
-
Who are the major players in the Used Car Market?
-
Arnold Clark Automobiles Ltd., Asbury Automotive Group Inc., AutoNation Inc., Autotrader Inc, CarGurus Inc., CarMax Inc., Cars.com LLC, Cars24 Services Pvt. Ltd., Carvana Co., Droom Technology Pvt. Ltd., Emil Frey Group, Group 1 Automotive Inc., Guazi, Lithia Motors Inc., Manheim, mobile.de GmbH, OLX Global B.V., Penske Automotive Group Inc., Scout24 AG and Sonic Automotive Inc.
-
Market Research Insights
- Market dynamics are increasingly influenced by a shift in consumer behavior toward flexible ownership and evolving procurement strategies. The appeal of a lower total cost of ownership has been a consistent factor, but the rise of digital transformation is reshaping expectations. Online platforms have reduced information asymmetry by over 40%, empowering buyers and intensifying competition.
- In response, successful firms are adopting sophisticated customer relationship management systems that improve retention by more than 15%. This environment, marked by supply chain disruption and market fragmentation, demands greater operational efficiency. Businesses that effectively manage asset depreciation and navigate complex regulatory compliance are better positioned to capitalize on opportunities.
We can help! Our analysts can customize this used car market research report to meet your requirements.
 RIA -
RIA - 
