Used Construction Machinery Market Analysis APAC, North America, Europe, South America, Middle East and Africa - US, China, India, Japan, Germany - Size and Forecast 2023-2027

Used Construction Machinery Market Analysis APAC, North America, Europe, South America, Middle East and Africa - US, China, India, Japan, Germany - Size and Forecast 2023-2027

Published: Dec 2022 156 Pages SKU: IRTNTR74770

Market Overview at a Glance

$27.33 B
Market Opportunity
5.3%
CAGR
5.07
YoY growth 2022-2023(%)

Used Construction Machinery Market Size 2023-2027 

The used construction machinery market size is forecast to increase by USD 27.33 billion at a CAGR of 5.3% between 2022 and 2027.

  • The market is experiencing significant growth due to several key factors. One of the primary drivers is the expanding secondhand machine market, as construction companies increasingly turn to cost-effective solutions for acquiring equipment. Another trend influencing market growth is the rising popularity of used construction equipment rentals. This allows businesses to access high-quality machinery without the substantial upfront costs of purchasing new equipment. However, stringent regulations regarding the safety and maintenance of used machinery pose challenges for market growth. Adhering to these regulations can be costly, and failure to do so can result in penalties and reputational damage. Despite these challenges, the market is expected to continue expanding, driven by the cost savings and operational flexibility offered by used equipment.

What will be the Size of the Used Construction Machinery Market During the Forecast Period?

Used Construction Machinery Market Size

 Request Free Sample

  • The market in the United States is experiencing significant growth, driven by increased construction activities in the residential and commercial sectors, as well as infrastructure projects in the civil engineering sector. Urbanization and technological innovation are key factors fueling this demand, with online platforms providing easy access to a wide range of used heavy machinery, including excavators, loaders, cranes, motor graders, and more. Contractors in the real estate industry and OEMs are turning to these platforms to source cost-effective solutions for their projects. Europe's construction industry, particularly in the infrastructure sector, is also contributing to the market's growth, with projects such as railway tunnels, port extensions, and underwater tunnels requiring large quantities of used machinery.

    The Olympic Games and other major events are further driving demand for cranes and other heavy machinery services from providers like Atlas Crane Service. Overall, the market is expected to continue its robust growth trajectory in the coming years.

How is this Used Construction Machinery Industry segmented and which is the largest segment?

The used construction machinery industry research report provides comprehensive data (region-wise segment analysis), with forecasts and estimates in "USD billion" for the period 2023-2027, as well as historical data from 2017-2021 for the following segments.

  • Product
    • Crane
    • Excavator
    • Material handling equipment
    • Others
  • Application
    • Commercial
    • Residential
    • Infrastructure
  • Geography
    • APAC
      • China
      • India
      • Japan
    • North America
      • US
    • Europe
      • Germany
    • South America
    • Middle East and Africa

By Product Insights

  • The Crane segment is estimated to witness significant growth during the forecast period.

The market, specifically the crane segment, is experiencing consistent growth due to the increasing demand for cranes in construction and industrial applications. Cranes are essential for the construction of industrial plants in the chemical, energy, and power distribution sectors. In the construction industry, the increasing trend of building high-rise residential and commercial structures is driving the demand for used cranes. The Asia Pacific region and Nordic countries, such as Sweden and Finland, are expected to significantly contribute to the growth of the segment during the forecast period. The use of telematics in construction machinery is also gaining popularity, providing real-time data and improving efficiency and productivity.

Earthmoving equipment and loaders are other key components of the market, with their demand primarily driven by the residential and commercial construction sectors.

Used Construction Machinery Market Size

Get a glance at the used construction machinery industry share of various segments Request Free Sample

The Crane segment accounted for USD 43.42 billion in 2017 and showed a gradual increase during the forecast period.

Regional Insights

  • APAC is estimated to contribute 56% to the growth of the global market during the forecast period. Technavio's analysts have elaborately explained the regional trends and drivers that shape the market during the forecast period.

Used Construction Machinery Market Share by Geography

For more insights on the market share of various regions Request Free Sample

The market in APAC is experiencing steady growth due to increasing construction activities in emerging economies such as India and China. The demand for used machinery is being driven by the need to provide residential and commercial spaces for expanding urban populations and infrastructure projects. In India, for instance, the Odisha Economic Corridor Project received a USD8.58 billion investment in 2020, leading to the development of industrial clusters in Gopalpur, Bhubaneswar, Kalinganagar, Paradip, Kendrapada, Dhamra, and Subarnarekha. The real estate industry and infrastructure projects are the primary drivers of this market, with motor graders being a significant type of machinery in high demand.

Third-party e-commerce websites facilitate the buying and selling of used construction machinery, increasing operational efficiency and accessibility.

Market Dynamics

Our used construction machinery market researchers analyzed the data with 2022 as the base year, along with the key drivers, trends, and challenges. A holistic analysis of drivers will help companies refine their marketing strategies to gain a competitive advantage.

What are the key market drivers leading to the rise in adoption of Used Construction Machinery Industry?

Growing secondhand machine market is the key driver of the market.

  • The market in the US and Europe is experiencing significant growth due to the high demand for secondhand machinery in emerging economies, particularly in Asia. Urbanization and infrastructure development projects in regions like China, India, and Pakistan have led to a surge in the need for heavy machinery such as excavators, loaders, cranes, and earthmoving equipment. This trend is further fueled by technological innovations, including telematics, GPS tracking, autonomous features, automation, and technology-enabled equipment. Online platforms and third-party e-commerce websites have made it easier for contractors and dealers to buy and sell used machinery. Economic uncertainty and depreciation have also contributed to the growth of the market.

    Modern innovations in fuel efficiency and equipment fleet control have made used machinery a cost-effective alternative to new equipment. The construction industry, including residential and commercial construction, is a significant consumer of used machinery. The real estate industry, civil engineering sector, and infrastructure projects, such as Olympic Games, high-speed rail markets, railway tunnels, port extensions, underwater tunnels, and power sector projects, are major users of heavy machinery. Motor graders are also in high demand for traffic linking and road construction projects.

What are the market trends shaping the Used Construction Machinery Industry?

Growing trend of used construction equipment rentals is the upcoming trend in the market.

  • The market in the US is experiencing significant growth due to the surge in construction activities, driven by urbanization and infrastructure development. Online platforms have become a popular avenue for procuring used heavy machinery, including excavators, loaders, cranes, earthmoving equipment, and motor graders. Technological innovation, such as telematics, GPS tracking, autonomous features, automation, and technology-enabled equipment, is transforming the industry by enhancing operational efficiency, reducing downtime, and improving equipment fleet control. The real estate industry and commercial construction sectors are major consumers of used construction machinery, while the civil engineering sector is also a significant contributor to the market's growth.
  • Rapid urbanization and economic uncertainty have led to an increase in the demand for cost-effective solutions, making rental equipment a popular choice. Modern innovations, such as fuel efficiency and economic certifications like the Certified Pre-Owned Program, are gaining popularity among contractors and OEMs. The construction machinery market is also witnessing significant growth in the high-speed rail market, Olympic Games, infrastructure projects, railway tunnels, port extensions, underwater tunnels, and power sector. Environmental regulations, such as the EU's Stage V exhaust emission regulation and the US's strict emission regulations for construction machinery, are driving the market towards technology-enabled equipment and cleaner, greener manufacturing and construction processes.
  • Online marketplaces and third-party e-commerce websites, such as Atlas Crane Service, are providing dealers with a wider reach and greater market penetration. In conclusion, the market in the US is poised for significant growth, driven by construction activities, technological innovation, and environmental regulations. Online platforms, rental equipment, and technology-enabled equipment are key trends shaping the market, while the real estate industry, commercial construction, and civil engineering sectors are major consumers. 

What challenges does Used Construction Machinery Industry face during the growth?

Stringent regulations is a key challenge affecting the market growth.

  • Amidst the economic uncertainty following the 2008 financial crisis, construction and mining companies have been seeking cost-effective solutions for their machinery needs. High-priced, heavy construction equipment, such as excavators, loaders, and cranes, pose significant initial investment challenges for companies engaged in residential or commercial construction projects of modest scale or short duration. To address this issue, these firms have increasingly turned to renting used machinery as an alternative to purchasing new equipment. Renting offers several advantages, including reduced capital expenditures and lower maintenance costs. Online platforms have emerged as popular channels for renting construction machinery, providing easy access to a wide range of equipment from various dealers.
  • Rapid urbanization and infrastructure development projects, such as Olympic Games, high-speed rail markets, power sector expansion, and traffic linking, have further fueled the demand for used machinery. Technological innovations, like telematics, GPS tracking, autonomous features, automation, and technology-enabled equipment, have transformed the construction industry. These advancements have led to increased operational efficiency, reduced downtime, and improved equipment fleet control. As a result, rental companies offer certified pre-owned machinery that is equipped with these modern innovations, ensuring that customers receive machinery that is fuel-efficient, reliable, and technologically advanced. The real estate industry and civil engineering sector are significant consumers of used construction machinery.
  • Dealers play a crucial role in providing these companies with access to a diverse range of machinery, ensuring that they can meet the demands of their projects efficiently and cost-effectively. In conclusion, the market is a dynamic and evolving landscape, driven by the need for flexibility, cost savings, and technological innovation. Online marketplaces have emerged as essential intermediaries, connecting buyers and sellers, and enabling the efficient use of machinery in various construction activities.

Exclusive Customer Landscape

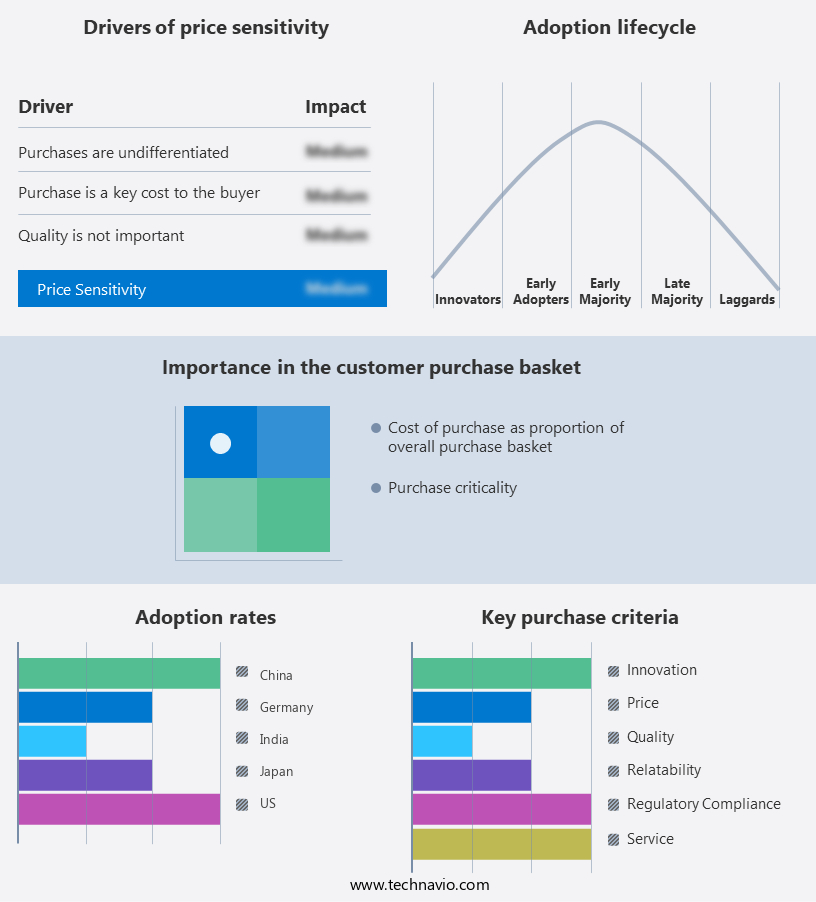
The used construction machinery market market forecasting report includes the adoption lifecycle of the market, covering from the innovator's stage to the laggard's stage. It focuses on adoption rates in different regions based on penetration. Furthermore, the report also includes key purchase criteria and drivers of price sensitivity to help companies evaluate and develop their market growth analysis strategies.

Used Construction Machinery Market Share by Geography

 Customer Landscape

Key Companies & Market Insights

Companies are implementing various strategies, such as strategic alliances, partnerships, mergers and acquisitions, geographical expansion, and product/service launches, to enhance their presence in the market.

AB Volvo  - Our company specializes in the sale of high-quality used construction machinery in the United States. Equipment offerings include excavators, wheel loaders, dump trucks, dozers, and numerous other machines to meet the diverse needs of the construction industry. We ensure each piece of machinery undergoes thorough inspections and maintenance before being sold, providing our clients with reliable and efficient solutions for their projects.

The market research and growth report includes detailed analyses of the competitive landscape of the used construction machinery market industry  and information about key companies, including:

  • AB Volvo
  • Ais Construction Equipment Service Corp.
  • Caterpillar Inc.
  • Deere and Co.
  • Equippo AG
  • Guangxi LiuGong Machinery Co. Ltd.
  • Hitachi Construction Machinery Co. Ltd.
  • Hyundai Construction Equipment Co. Ltd.
  • Infra Bazaar
  • Kobelco Construction Machinery Co. Ltd.
  • Komatsu Ltd.
  • Liebherr International AG
  • Mico Cranes & Equipment LLC
  • Plantmaster UK
  • Ritchie Bros. Auctioneers Inc.
  • Shriram Automall India Ltd.
  • Tadano Ltd.
  • Terex Corp.
  • Vintage Infra Equipment Solution Pvt. Ltd.
  • XCMG Group

Qualitative and quantitative analysis of companies has been conducted to help clients understand the wider business environment as well as the strengths and weaknesses of key market players. Data is qualitatively analyzed to categorize companies as pure play, category-focused, industry-focused, and diversified; it is quantitatively analyzed to categorize companies as dominant, leading, strong, tentative, and weak.

Research Analyst Overview

The market is experiencing significant growth due to the increasing demand for infrastructure development and urbanization. With technological innovation at the forefront, online platforms have become a popular avenue for procuring used heavy machinery, including excavators, loaders, cranes, and earthmoving equipment. Urbanization has led to an increase in residential and commercial construction projects, driving the demand for construction machinery. Technological advancements, such as telematics, GPS tracking, autonomous features, and automation, have transformed technology-enabled equipment into valuable assets for contractors in various sectors. Rapid urbanization and economic uncertainty have led to a growing preference for used machinery, as they offer cost savings and flexibility.

Depreciation of new machinery and the availability of modern innovations in used machinery have made it an attractive option for contractors. Fuel efficiency is a critical factor in the market, as it directly impacts operational efficiency and reduces overall costs. Rental equipment has become increasingly popular due to its flexibility and cost-effectiveness, particularly in the real estate industry and infrastructure projects. The construction sector is undergoing a digital transformation, with online marketplaces and third-party e-commerce websites offering a wide range of used machinery options. Atlas Crane Service and other dealers are leveraging technology to provide certified pre-owned programs, ensuring the quality and reliability of used machinery.

The civil engineering sector is a significant contributor to the market, with a high demand for motor graders and other earthmoving equipment. Infrastructure projects, such as railway tunnels, port extensions, underwater tunnels, and power sector development, require large quantities of used machinery to meet project deadlines. The high-speed rail market and Olympic games have further boosted the demand for used machinery, as they require significant infrastructure development and construction activities. Economic uncertainty and the need for operational efficiency have led contractors to seek out used machinery with the latest technological features, such as telematics and GPS tracking. In conclusion, the market is experiencing robust growth due to the increasing demand for infrastructure development and urbanization.

Technological innovation, cost savings, and operational efficiency are key drivers in the market, with online platforms and dealers offering a wide range of options for contractors. The future of the market looks promising, as it continues to play a vital role in meeting the infrastructure needs of various sectors.

Market Scope

Report Coverage

Details

Page number

156

Base year

2022

Historic period

2017-2021

Forecast period

2023-2027

Growth momentum & CAGR

Accelerate at a CAGR of 5.3%

Market growth 2023-2027

USD 27.33 billion

Market structure

Fragmented

YoY growth 2022-2023(%)

5.07

Regional analysis

APAC, North America, Europe, South America, and Middle East and Africa

Performing market contribution

APAC at 56%

Key countries

US, China, India, Japan, and Germany

Competitive landscape

Leading Companies, Market Positioning of Companies, Competitive Strategies, and Industry Risks

Key companies profiled

AB Volvo, Ais Construction Equipment Service Corp., Caterpillar Inc., Deere and Co., Equippo AG, Guangxi LiuGong Machinery Co. Ltd., Hitachi Construction Machinery Co. Ltd., Hyundai Construction Equipment Co. Ltd., Infra Bazaar, Kobelco Construction Machinery Co. Ltd., Komatsu Ltd., Liebherr International AG, Mico Cranes & Equipment LLC, Plantmaster UK, Ritchie Bros. Auctioneers Inc., Shriram Automall India Ltd., Tadano Ltd., Terex Corp., Vintage Infra Equipment Solution Pvt. Ltd., and XCMG Group

Market dynamics

Parent market analysis, market growth inducers and obstacles, market forecast, fast-growing and slow-growing segment analysis, COVID-19 impact and recovery analysis and future consumer dynamics, market condition analysis for the forecast period

Customization purview

If our market report has not included the data that you are looking for, you can reach out to our analysts and get segments customized.

Request Free Sample

What are the Key Data Covered in this Market Research and Growth Report?

  • CAGR of the market during the forecast period
  • Detailed information on factors that will drive the used construction machinery market industry growth and forecasting between 2023 and 2027
  • Precise estimation of the size of the market  and its contribution of the market in focus to the parent market
  • Accurate predictions about upcoming market growth and trends and changes in consumer behaviour
  • Growth of the market across APAC, North America, Europe, South America, and Middle East and Africa
  • Thorough analysis of the market's competitive landscape and detailed information about companies
  • Comprehensive analysis of factors that will challenge the growth of market companies

We can help! Our analysts can customize this market research report to meet your requirements. Get in touch

1 Executive Summary

  • 1.1 Market overview
    • Exhibit 01: Executive Summary – Chart on Market Overview
    • Exhibit 02: Executive Summary – Data Table on Market Overview
    • Exhibit 03: Executive Summary – Chart on Global Market Characteristics
    • Exhibit 04: Executive Summary – Chart on Market by Geography
    • Exhibit 05: Executive Summary – Chart on Market Segmentation by Product
    • Exhibit 06: Executive Summary – Chart on Market Segmentation by Application
    • Exhibit 07: Executive Summary – Chart on Incremental Growth
    • Exhibit 08: Executive Summary – Data Table on Incremental Growth
    • Exhibit 09: Executive Summary – Chart on Vendor Market Positioning

2 Market Landscape

  • 2.1 Market ecosystem
    • Exhibit 10: Parent market
    • Exhibit 11: Market Characteristics

3 Market Sizing

  • 3.1 Market definition
    • Exhibit 12: Offerings of vendors included in the market definition
  • 3.2 Market segment analysis
    • Exhibit 13: Market segments
  • 3.3 Market size 2022
    • 3.4 Market outlook: Forecast for 2022-2027
      • Exhibit 14: Chart on Global - Market size and forecast 2022-2027 ($ billion)
      • Exhibit 15: Data Table on Global - Market size and forecast 2022-2027 ($ billion)
      • Exhibit 16: Chart on Global Market: Year-over-year growth 2022-2027 (%)
      • Exhibit 17: Data Table on Global Market: Year-over-year growth 2022-2027 (%)

    4 Historic Market Size

    • 4.1 Global used construction machinery market 2017 - 2021
      • Exhibit 18: Historic Market Size – Data Table on Global used construction machinery market 2017 - 2021 ($ billion)
    • 4.2 Product Segment Analysis 2017 - 2021
      • Exhibit 19: Historic Market Size – Product Segment 2017 - 2021 ($ billion)
    • 4.3 Application Segment Analysis 2017 - 2021
      • Exhibit 20: Historic Market Size – Application Segment 2017 - 2021 ($ billion)
    • 4.4 Geography Segment Analysis 2017 - 2021
      • Exhibit 21: Historic Market Size – Geography Segment 2017 - 2021 ($ billion)
    • 4.5 Country Segment Analysis 2017 - 2021
      • Exhibit 22: Historic Market Size – Country Segment 2017 - 2021 ($ billion)

    5 Five Forces Analysis

    • 5.1 Five forces summary
      • Exhibit 23: Five forces analysis - Comparison between 2022 and 2027
    • 5.2 Bargaining power of buyers
      • Exhibit 24: Chart on Bargaining power of buyers – Impact of key factors 2022 and 2027
    • 5.3 Bargaining power of suppliers
      • Exhibit 25: Bargaining power of suppliers – Impact of key factors in 2022 and 2027
    • 5.4 Threat of new entrants
      • Exhibit 26: Threat of new entrants – Impact of key factors in 2022 and 2027
    • 5.5 Threat of substitutes
      • Exhibit 27: Threat of substitutes – Impact of key factors in 2022 and 2027
    • 5.6 Threat of rivalry
      • Exhibit 28: Threat of rivalry – Impact of key factors in 2022 and 2027
    • 5.7 Market condition
      • Exhibit 29: Chart on Market condition - Five forces 2022 and 2027

    6 Market Segmentation by Product

    • 6.1 Market segments
      • Exhibit 30: Chart on Product - Market share 2022-2027 (%)
      • Exhibit 31: Data Table on Product - Market share 2022-2027 (%)
    • 6.2 Comparison by Product
      • Exhibit 32: Chart on Comparison by Product
      • Exhibit 33: Data Table on Comparison by Product
    • 6.3 Crane - Market size and forecast 2022-2027
      • Exhibit 34: Chart on Crane - Market size and forecast 2022-2027 ($ billion)
      • Exhibit 35: Data Table on Crane - Market size and forecast 2022-2027 ($ billion)
      • Exhibit 36: Chart on Crane - Year-over-year growth 2022-2027 (%)
      • Exhibit 37: Data Table on Crane - Year-over-year growth 2022-2027 (%)
    • 6.4 Excavator - Market size and forecast 2022-2027
      • Exhibit 38: Chart on Excavator - Market size and forecast 2022-2027 ($ billion)
      • Exhibit 39: Data Table on Excavator - Market size and forecast 2022-2027 ($ billion)
      • Exhibit 40: Chart on Excavator - Year-over-year growth 2022-2027 (%)
      • Exhibit 41: Data Table on Excavator - Year-over-year growth 2022-2027 (%)
    • 6.5 Material handling equipment - Market size and forecast 2022-2027
      • Exhibit 42: Chart on Material handling equipment - Market size and forecast 2022-2027 ($ billion)
      • Exhibit 43: Data Table on Material handling equipment - Market size and forecast 2022-2027 ($ billion)
      • Exhibit 44: Chart on Material handling equipment - Year-over-year growth 2022-2027 (%)
      • Exhibit 45: Data Table on Material handling equipment - Year-over-year growth 2022-2027 (%)
    • 6.6 Others - Market size and forecast 2022-2027
      • Exhibit 46: Chart on Others - Market size and forecast 2022-2027 ($ billion)
      • Exhibit 47: Data Table on Others - Market size and forecast 2022-2027 ($ billion)
      • Exhibit 48: Chart on Others - Year-over-year growth 2022-2027 (%)
      • Exhibit 49: Data Table on Others - Year-over-year growth 2022-2027 (%)
    • 6.7 Market opportunity by Product
      • Exhibit 50: Market opportunity by Product ($ billion)

    7 Market Segmentation by Application

    • 7.1 Market segments
      • Exhibit 51: Chart on Application - Market share 2022-2027 (%)
      • Exhibit 52: Data Table on Application - Market share 2022-2027 (%)
    • 7.2 Comparison by Application
      • Exhibit 53: Chart on Comparison by Application
      • Exhibit 54: Data Table on Comparison by Application
    • 7.3 Commercial - Market size and forecast 2022-2027
      • Exhibit 55: Chart on Commercial - Market size and forecast 2022-2027 ($ billion)
      • Exhibit 56: Data Table on Commercial - Market size and forecast 2022-2027 ($ billion)
      • Exhibit 57: Chart on Commercial - Year-over-year growth 2022-2027 (%)
      • Exhibit 58: Data Table on Commercial - Year-over-year growth 2022-2027 (%)
    • 7.4 Residential - Market size and forecast 2022-2027
      • Exhibit 59: Chart on Residential - Market size and forecast 2022-2027 ($ billion)
      • Exhibit 60: Data Table on Residential - Market size and forecast 2022-2027 ($ billion)
      • Exhibit 61: Chart on Residential - Year-over-year growth 2022-2027 (%)
      • Exhibit 62: Data Table on Residential - Year-over-year growth 2022-2027 (%)
    • 7.5 Infrastructure - Market size and forecast 2022-2027
      • Exhibit 63: Chart on Infrastructure - Market size and forecast 2022-2027 ($ billion)
      • Exhibit 64: Data Table on Infrastructure - Market size and forecast 2022-2027 ($ billion)
      • Exhibit 65: Chart on Infrastructure - Year-over-year growth 2022-2027 (%)
      • Exhibit 66: Data Table on Infrastructure - Year-over-year growth 2022-2027 (%)
    • 7.6 Market opportunity by Application
      • Exhibit 67: Market opportunity by Application ($ billion)

    8 Customer Landscape

    • 8.1 Customer landscape overview
      • Exhibit 68: Analysis of price sensitivity, lifecycle, customer purchase basket, adoption rates, and purchase criteria

    9 Geographic Landscape

    • 9.1 Geographic segmentation
      • Exhibit 69: Chart on Market share by geography 2022-2027 (%)
      • Exhibit 70: Data Table on Market share by geography 2022-2027 (%)
    • 9.2 Geographic comparison
      • Exhibit 71: Chart on Geographic comparison
      • Exhibit 72: Data Table on Geographic comparison
    • 9.3 APAC - Market size and forecast 2022-2027
      • Exhibit 73: Chart on APAC - Market size and forecast 2022-2027 ($ billion)
      • Exhibit 74: Data Table on APAC - Market size and forecast 2022-2027 ($ billion)
      • Exhibit 75: Chart on APAC - Year-over-year growth 2022-2027 (%)
      • Exhibit 76: Data Table on APAC - Year-over-year growth 2022-2027 (%)
    • 9.4 North America - Market size and forecast 2022-2027
      • Exhibit 77: Chart on North America - Market size and forecast 2022-2027 ($ billion)
      • Exhibit 78: Data Table on North America - Market size and forecast 2022-2027 ($ billion)
      • Exhibit 79: Chart on North America - Year-over-year growth 2022-2027 (%)
      • Exhibit 80: Data Table on North America - Year-over-year growth 2022-2027 (%)
    • 9.5 Europe - Market size and forecast 2022-2027
      • Exhibit 81: Chart on Europe - Market size and forecast 2022-2027 ($ billion)
      • Exhibit 82: Data Table on Europe - Market size and forecast 2022-2027 ($ billion)
      • Exhibit 83: Chart on Europe - Year-over-year growth 2022-2027 (%)
      • Exhibit 84: Data Table on Europe - Year-over-year growth 2022-2027 (%)
    • 9.6 South America - Market size and forecast 2022-2027
      • Exhibit 85: Chart on South America - Market size and forecast 2022-2027 ($ billion)
      • Exhibit 86: Data Table on South America - Market size and forecast 2022-2027 ($ billion)
      • Exhibit 87: Chart on South America - Year-over-year growth 2022-2027 (%)
      • Exhibit 88: Data Table on South America - Year-over-year growth 2022-2027 (%)
    • 9.7 Middle East and Africa - Market size and forecast 2022-2027
      • Exhibit 89: Chart on Middle East and Africa - Market size and forecast 2022-2027 ($ billion)
      • Exhibit 90: Data Table on Middle East and Africa - Market size and forecast 2022-2027 ($ billion)
      • Exhibit 91: Chart on Middle East and Africa - Year-over-year growth 2022-2027 (%)
      • Exhibit 92: Data Table on Middle East and Africa - Year-over-year growth 2022-2027 (%)
    • 9.8 China - Market size and forecast 2022-2027
      • Exhibit 93: Chart on China - Market size and forecast 2022-2027 ($ billion)
      • Exhibit 94: Data Table on China - Market size and forecast 2022-2027 ($ billion)
      • Exhibit 95: Chart on China - Year-over-year growth 2022-2027 (%)
      • Exhibit 96: Data Table on China - Year-over-year growth 2022-2027 (%)
    • 9.9 US - Market size and forecast 2022-2027
      • Exhibit 97: Chart on US - Market size and forecast 2022-2027 ($ billion)
      • Exhibit 98: Data Table on US - Market size and forecast 2022-2027 ($ billion)
      • Exhibit 99: Chart on US - Year-over-year growth 2022-2027 (%)
      • Exhibit 100: Data Table on US - Year-over-year growth 2022-2027 (%)
    • 9.10 Japan - Market size and forecast 2022-2027
      • Exhibit 101: Chart on Japan - Market size and forecast 2022-2027 ($ billion)
      • Exhibit 102: Data Table on Japan - Market size and forecast 2022-2027 ($ billion)
      • Exhibit 103: Chart on Japan - Year-over-year growth 2022-2027 (%)
      • Exhibit 104: Data Table on Japan - Year-over-year growth 2022-2027 (%)
    • 9.11 India - Market size and forecast 2022-2027
      • Exhibit 105: Chart on India - Market size and forecast 2022-2027 ($ billion)
      • Exhibit 106: Data Table on India - Market size and forecast 2022-2027 ($ billion)
      • Exhibit 107: Chart on India - Year-over-year growth 2022-2027 (%)
      • Exhibit 108: Data Table on India - Year-over-year growth 2022-2027 (%)
    • 9.12 Germany - Market size and forecast 2022-2027
      • Exhibit 109: Chart on Germany - Market size and forecast 2022-2027 ($ billion)
      • Exhibit 110: Data Table on Germany - Market size and forecast 2022-2027 ($ billion)
      • Exhibit 111: Chart on Germany - Year-over-year growth 2022-2027 (%)
      • Exhibit 112: Data Table on Germany - Year-over-year growth 2022-2027 (%)
    • 9.13 Market opportunity by geography
      • Exhibit 113: Market opportunity by geography ($ billion)

    10 Drivers, Challenges, and Trends

    • 10.1 Market drivers
      • 10.2 Market challenges
        • 10.3 Impact of drivers and challenges
          • Exhibit 114: Impact of drivers and challenges in 2022 and 2027
        • 10.4 Market trends

          11 Vendor Landscape

          • 11.1 Overview
            • 11.2 Vendor landscape
              • Exhibit 115: Overview on Criticality of inputs and Factors of differentiation
            • 11.3 Landscape disruption
              • Exhibit 116: Overview on factors of disruption
            • 11.4 Industry risks
              • Exhibit 117: Impact of key risks on business

            12 Vendor Analysis

            • 12.1 Vendors covered
              • Exhibit 118: Vendors covered
            • 12.2 Market positioning of vendors
              • Exhibit 119: Matrix on vendor position and classification
            • 12.3 AB Volvo
              • Exhibit 120: AB Volvo - Overview
              • Exhibit 121: AB Volvo - Business segments
              • Exhibit 122: AB Volvo - Key news
              • Exhibit 123: AB Volvo - Key offerings
              • Exhibit 124: AB Volvo - Segment focus
            • 12.4 Ais Construction Equipment Service Corp.
              • Exhibit 125: Ais Construction Equipment Service Corp. - Overview
              • Exhibit 126: Ais Construction Equipment Service Corp. - Product / Service
              • Exhibit 127: Ais Construction Equipment Service Corp. - Key offerings
            • 12.5 Caterpillar Inc.
              • Exhibit 128: Caterpillar Inc. - Overview
              • Exhibit 129: Caterpillar Inc. - Business segments
              • Exhibit 130: Caterpillar Inc. - Key offerings
              • Exhibit 131: Caterpillar Inc. - Segment focus
            • 12.6 Deere and Co.
              • Exhibit 132: Deere and Co. - Overview
              • Exhibit 133: Deere and Co. - Business segments
              • Exhibit 134: Deere and Co. - Key news
              • Exhibit 135: Deere and Co. - Key offerings
              • Exhibit 136: Deere and Co. - Segment focus
            • 12.7 Equippo AG
              • Exhibit 137: Equippo AG - Overview
              • Exhibit 138: Equippo AG - Product / Service
              • Exhibit 139: Equippo AG - Key offerings
            • 12.8 Hitachi Construction Machinery Co. Ltd.
              • Exhibit 140: Hitachi Construction Machinery Co. Ltd. - Overview
              • Exhibit 141: Hitachi Construction Machinery Co. Ltd. - Product / Service
              • Exhibit 142: Hitachi Construction Machinery Co. Ltd. - Key offerings
            • 12.9 Infra Bazaar
              • Exhibit 143: Infra Bazaar - Overview
              • Exhibit 144: Infra Bazaar - Product / Service
              • Exhibit 145: Infra Bazaar - Key offerings
            • 12.10 Kobelco Construction Machinery Co. Ltd.
              • Exhibit 146: Kobelco Construction Machinery Co. Ltd. - Overview
              • Exhibit 147: Kobelco Construction Machinery Co. Ltd. - Product / Service
              • Exhibit 148: Kobelco Construction Machinery Co. Ltd. - Key offerings
            • 12.11 Komatsu Ltd.
              • Exhibit 149: Komatsu Ltd. - Overview
              • Exhibit 150: Komatsu Ltd. - Business segments
              • Exhibit 151: Komatsu Ltd. - Key news
              • Exhibit 152: Komatsu Ltd. - Key offerings
              • Exhibit 153: Komatsu Ltd. - Segment focus
            • 12.12 Liebherr International AG
              • Exhibit 154: Liebherr International AG - Overview
              • Exhibit 155: Liebherr International AG - Product / Service
              • Exhibit 156: Liebherr International AG - Key news
              • Exhibit 157: Liebherr International AG - Key offerings
            • 12.13 Ritchie Bros. Auctioneers Inc.
              • Exhibit 158: Ritchie Bros. Auctioneers Inc. - Overview
              • Exhibit 159: Ritchie Bros. Auctioneers Inc. - Business segments
              • Exhibit 160: Ritchie Bros. Auctioneers Inc. - Key offerings
              • Exhibit 161: Ritchie Bros. Auctioneers Inc. - Segment focus
            • 12.14 Shriram Automall India Ltd.
              • Exhibit 162: Shriram Automall India Ltd. - Overview
              • Exhibit 163: Shriram Automall India Ltd. - Product / Service
              • Exhibit 164: Shriram Automall India Ltd. - Key offerings
            • 12.15 Tadano Ltd.
              • Exhibit 165: Tadano Ltd. - Overview
              • Exhibit 166: Tadano Ltd. - Business segments
              • Exhibit 167: Tadano Ltd. - Key offerings
              • Exhibit 168: Tadano Ltd. - Segment focus
            • 12.16 Terex Corp.
              • Exhibit 169: Terex Corp. - Overview
              • Exhibit 170: Terex Corp. - Business segments
              • Exhibit 171: Terex Corp. - Key offerings
              • Exhibit 172: Terex Corp. - Segment focus
            • 12.17 XCMG Group
              • Exhibit 173: XCMG Group - Overview
              • Exhibit 174: XCMG Group - Product / Service
              • Exhibit 175: XCMG Group - Key offerings

            13 Appendix

            • 13.1 Scope of the report
              • 13.2 Inclusions and exclusions checklist
                • Exhibit 176: Inclusions checklist
                • Exhibit 177: Exclusions checklist
              • 13.3 Currency conversion rates for US$
                • Exhibit 178: Currency conversion rates for US$
              • 13.4 Research methodology
                • Exhibit 179: Research methodology
                • Exhibit 180: Validation techniques employed for market sizing
                • Exhibit 181: Information sources
              • 13.5 List of abbreviations
                • Exhibit 182: List of abbreviations

              Research Methodology

              Technavio presents a detailed picture of the market by way of study, synthesis, and summation of data from multiple sources. The analysts have presented the various facets of the market with a particular focus on identifying the key industry influencers. The data thus presented is comprehensive, reliable, and the result of extensive research, both primary and secondary.

              INFORMATION SOURCES

              Primary sources

              • Manufacturers and suppliers
              • Channel partners
              • Industry experts
              • Strategic decision makers

              Secondary sources

              • Industry journals and periodicals
              • Government data
              • Financial reports of key industry players
              • Historical data
              • Press releases

              DATA ANALYSIS

              Data Synthesis

              • Collation of data
              • Estimation of key figures
              • Analysis of derived insights

              Data Validation

              • Triangulation with data models
              • Reference against proprietary databases
              • Corroboration with industry experts

              REPORT WRITING

              Qualitative

              • Market drivers
              • Market challenges
              • Market trends
              • Five forces analysis

              Quantitative

              • Market size and forecast
              • Market segmentation
              • Geographical insights
              • Competitive landscape

              Interested in this report?

              Get your sample now to see our research methodology and insights!

              Download Now

              Frequently Asked Questions

              Used Construction Machinery market growth will increase by $ 27.33 bn during 2023-2027 .

              The Used Construction Machinery market is expected to grow at a CAGR of 5.3% during 2023-2027 .

              Used Construction Machinery market is segmented by Product( Crane, Excavator, Material handling equipment, Others) Application( Commercial, Residential, Infrastructure)

              AB Volvo, Ais Construction Equipment Service Corp., Caterpillar Inc., Deere and Co., Equippo AG, Guangxi LiuGong Machinery Co. Ltd., Hitachi Construction Machinery Co. Ltd., Hyundai Construction Equipment Co. Ltd., Infra Bazaar, Kobelco Construction Machinery Co. Ltd., Komatsu Ltd., Liebherr International AG, Mico Cranes & Equipment LLC, Plantmaster UK, Ritchie Bros. Auctioneers Inc., Shriram Automall India Ltd., Tadano Ltd., Terex Corp., Vintage Infra Equipment Solution Pvt. Ltd., XCMG Group are a few of the key vendors in the Used Construction Machinery market.

              APAC will register the highest growth rate of 56% among the other regions. Therefore, the Used Construction Machinery market in APAC is expected to garner significant business opportunities for the vendors during the forecast period.

              US, China, India, Japan, Germany

              • Growing secondhand machine marketA major driver that is driving the growth of the market in focus is the high growth rate. Several manufacturing and mining industries in the US and Europe is the driving factor this market.
              • especially in countries such as Romania and Germany is the driving factor this market.
              • were closed because of high labor costs and strict pollution laws. This resulted in the increased availability of secondhand machines. Since many manufacturing industries have moved to APAC is the driving factor this market.
              • owing to the low-cost manufacturing facilities in the region is the driving factor this market.
              • secondhand machines from the US and Europe are being used is the driving factor this market.
              • especially in emerging economies such as China is the driving factor this market.
              • India is the driving factor this market.
              • and Pakistan.  It has been observed that many Asian contractors and mining companies are eager to buy secondhand European construction machinery is the driving factor this market.
              • such as excavators is the driving factor this market.
              • at low prices. By using secondhand machines is the driving factor this market.
              • contractors can control their capital investments as these machines are available at affordable prices. China has become a major market for secondhand machines among European construction machinery vendors. Thus is the driving factor this market.
              • such factors are expected to drive the demand for used construction machinery is the driving factor this market.
              • which in turn will propel the growth of the market in focus during the forecast period.  is the driving factor this market.

              The Used Construction Machinery market vendors should focus on grabbing business opportunities from the Crane segment as it accounted for the largest market share in the base year.