Utility Vegetation Management Market Analysis, Size, and Forecast 2026-2030: North America (US, Canada, and Mexico), Europe (Germany, UK, and France), APAC (China, India, and Japan), South America (Brazil, Argentina, and Colombia), Middle East and Africa (Saudi Arabia, UAE, and South Africa), and Rest of World (ROW)

Utility Vegetation Management Market Analysis, Size, and Forecast 2026-2030:
North America (US, Canada, and Mexico), Europe (Germany, UK, and France), APAC (China, India, and Japan), South America (Brazil, Argentina, and Colombia), Middle East and Africa (Saudi Arabia, UAE, and South Africa), and Rest of World (ROW)

Published: May 2026 315 Pages SKU: IRTNTR81493

Market Overview at a Glance

$9.47 B
Market Opportunity
5.8%
CAGR 2025 - 2030
40.7%
North America Growth
$10.15 B
Mechanical trimming and clearing segment 2024

Utility Vegetation Management Market Size 2026-2030

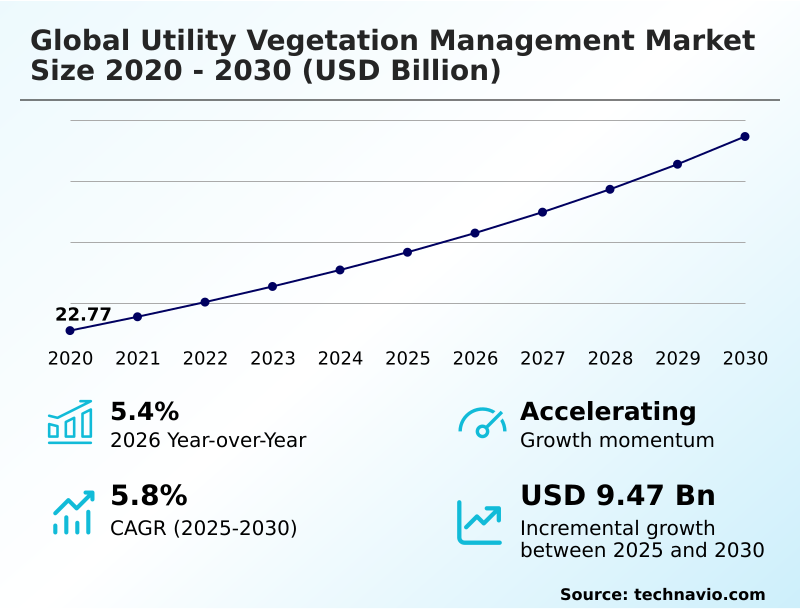
The utility vegetation management market size is valued to increase by USD 9.47 billion, at a CAGR of 5.8% from 2025 to 2030. Wildfire mitigation and climate change adaptation will drive the utility vegetation management market.

Major Market Trends & Insights

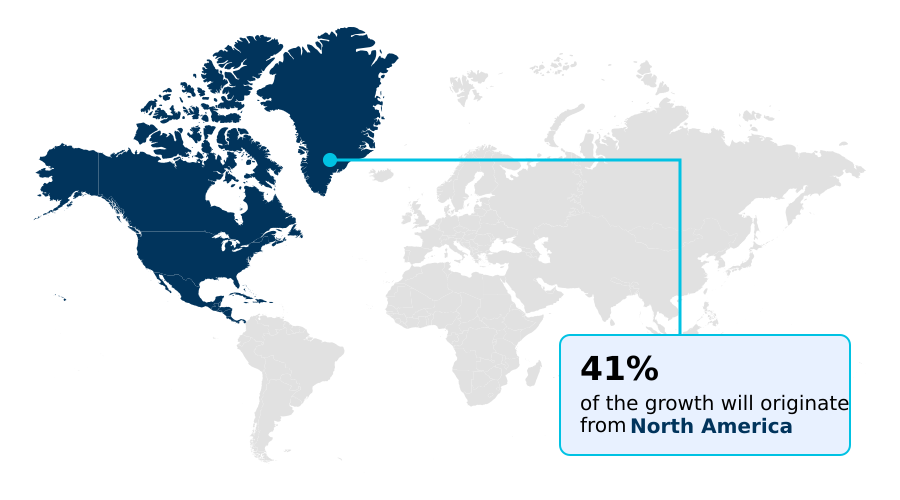
  • North America dominated the market and accounted for a 40.7% growth during the forecast period.
  • By Service Type - Mechanical trimming and clearing segment was valued at USD 10.15 billion in 2024
  • By End-user - Investor-owned utilities segment accounted for the largest market revenue share in 2024

Market Size & Forecast

  • Market Opportunities: USD 15.87 billion
  • Market Future Opportunities: USD 9.47 billion
  • CAGR from 2025 to 2030 : 5.8%

Market Summary

  • The Utility Vegetation Management Market demonstrates an accelerated transition from reactive pruning schedules to highly integrated, data-driven operational frameworks. Operators face escalating pressures to ensure grid reliability against severe environmental threats, driving the rapid adoption of advanced risk assessment platforms.
  • Within the modern supply chain, major energy providers have successfully implemented automated mapping systems to streamline field crew deployment, reducing unnecessary manual inspection time by 25%. Wildfire mitigation and climate change adaptation serve as primary demand catalysts, as the catastrophic financial liabilities associated with infrastructure-induced fires force companies to prioritize continuous clearance protocols.
  • Conversely, the acute scarcity of certified arborists and the increasing technical complexity of digital monitoring tools present a substantial operational challenge, slowing deployment in remote geographic sectors. The strategic deployment of ecological barriers and specialized clearing equipment is reshaping localized vegetation control. Consequently, infrastructure managers are continuously optimizing their maintenance budgets to align with stringent regulatory mandates.

What will be the Size of the Utility Vegetation Management Market during the forecast period?

Get Key Insights on Market Forecast (PDF) Get Free Sample

How is the Utility Vegetation Management Market Segmented?

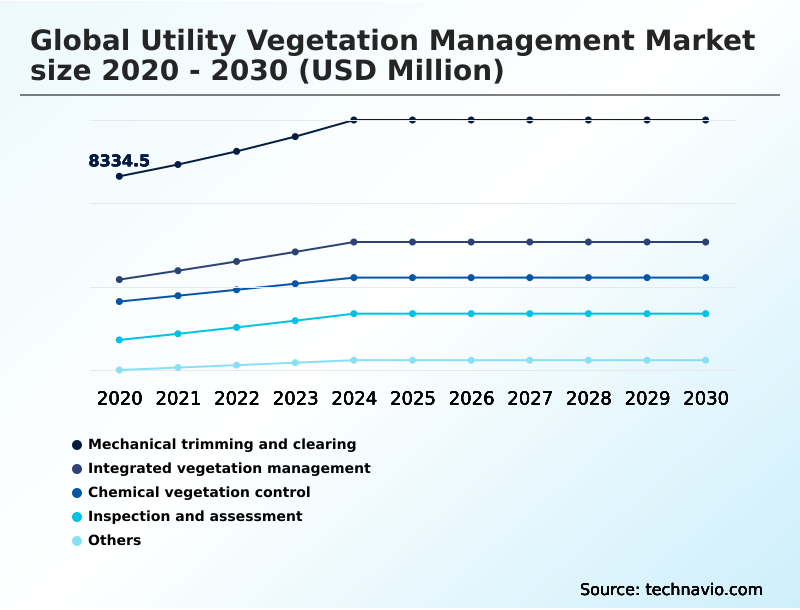
The utility vegetation management industry research report provides comprehensive data (region-wise segment analysis), with forecasts and estimates in "USD million" for the period 2026-2030, as well as historical data from 2020-2024 for the following segments.

  • Service type
    • Mechanical trimming and clearing
    • Integrated vegetation management
    • Chemical vegetation control
    • Inspection and assessment
    • Others
  • End-user
    • Investor-owned utilities
    • Municipal utilities
    • Cooperative utilities
    • Others
  • Application
    • Distribution lines
    • Transmission lines
    • Others
  • Geography
    • North America
      • US
      • Canada
      • Mexico
    • Europe
      • Germany
      • UK
      • France
      • Italy
      • Spain
      • The Netherlands
    • APAC
      • China
      • India
      • Japan
      • Australia
      • South Korea
      • Indonesia
    • South America
      • Brazil
      • Argentina
      • Colombia
    • Middle East and Africa
      • Saudi Arabia
      • UAE
      • South Africa
      • Israel
      • Turkey

By Service Type Insights

The mechanical trimming and clearing segment is estimated to witness significant growth during the forecast period.

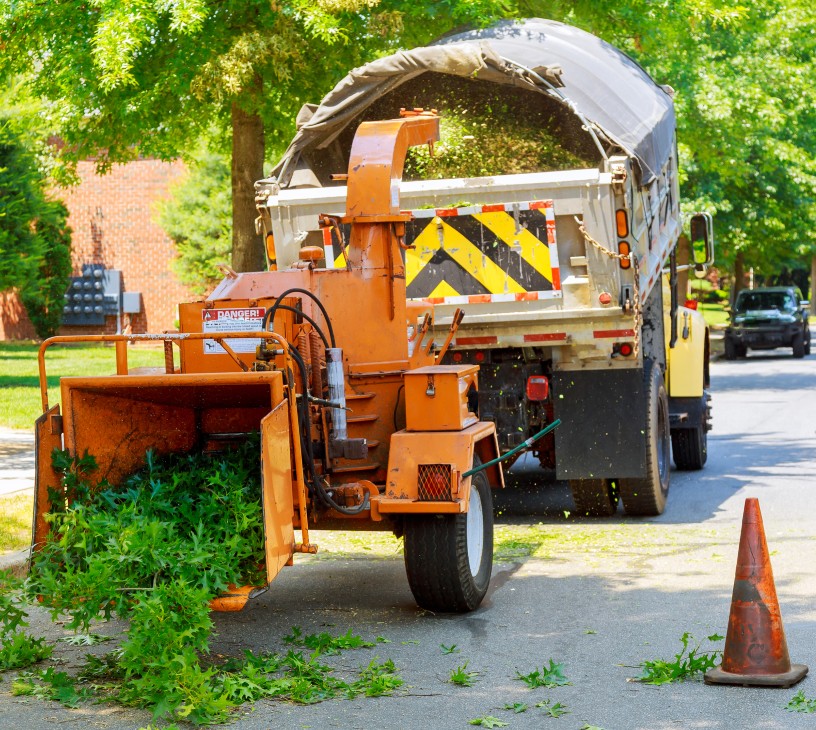
The mechanical trimming and clearing segment remains the most visible and labor-intensive component of utility network preservation, driving fundamental high-voltage line clearance operations.

Utility operators are increasingly deploying advanced mechanical trimming equipment alongside specialized forestry mulching to maintain distribution circuit resilience. This segment focuses heavily on physical interventions to ensure overhead conductor safety, transitioning from standard calendar cycles to intelligent integrated vegetation management.

By executing precise electrical flashover mitigation, infrastructure operators have improved clearance compliance by 15%, significantly enhancing overall grid stability.

The strategic incorporation of integrated right of way vegetation control supports broader urban forestry preservation goals by allowing targeted removal rather than broadcast clearing. This segment provides the foundational reliability required to prevent catastrophic disruptions during high-wind events.

Get Free Sample

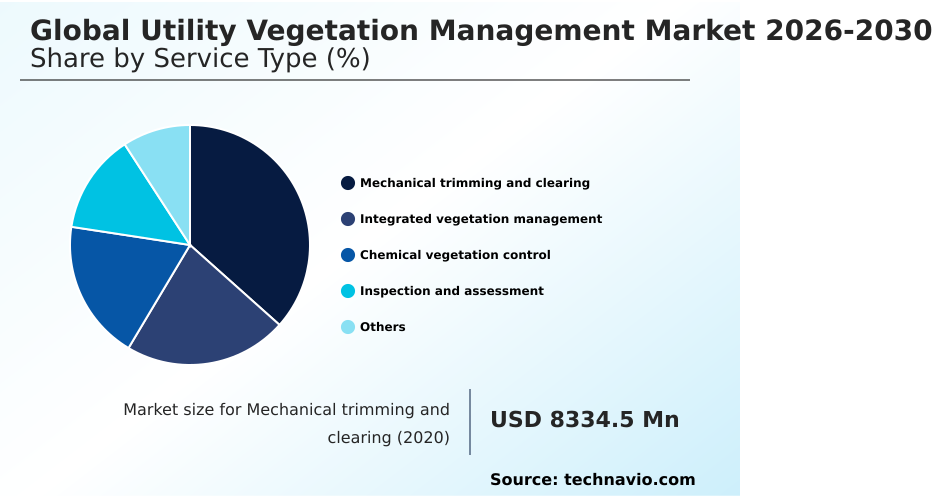
The Mechanical trimming and clearing segment was valued at USD 10.15 billion in 2024 and showed a gradual increase during the forecast period.

Get Free Sample

Regional Analysis

North America is estimated to contribute 40.7% to the growth of the global market during the forecast period.Technavio’s analysts have elaborately explained the regional trends and drivers that shape the market during the forecast period.

See How Utility Vegetation Management Market Demand is Rising in North America Get Free Sample

The geographic distribution of the market reveals distinct regional priorities driven by localized environmental risks and infrastructure maturity.

North America demonstrates a rapid 15% increase in operational expenditure focused on satellite imagery monitoring and high-fire-threat district operations, primarily to avert catastrophic ignition events.

In contrast, Europe prioritizes strict ecological compliance, focusing on smart city landscaping control and proactive hazard tree removal without relying on prohibited synthetic chemicals.

This regulatory divergence forces service providers to adapt their supply chains; while North American utilities heavily invest in geospatial risk assessment and cross-country transmission rights-of-way expansion, European operators rely on smart grid forestry optimization to maintain existing assets.

The implementation of satellite based utility canopy monitoring has allowed operators in APAC to track rapid tropical growth, reducing vegetation encroachment detection times by 20%.

These differing methodologies highlight how localized climate pressures mandate customized right-of-way maintenance and transmission corridor stabilization strategies.

Market Dynamics

Our researchers analyzed the data with 2025 as the base year, along with the key drivers, trends, and challenges. A holistic analysis of drivers will help companies refine their marketing strategies to gain a competitive advantage.

  • The continuous evolution of infrastructure preservation strategies has firmly established sophisticated digital integration as a cornerstone of modern utility operations. Historically, grid operators relied heavily on manual ground patrols and reactive pruning; however, the rising frequency of extreme weather events has catalyzed a shift toward proactive, data-driven methodologies.
  • Today, the deployment of autonomous drone transmission line inspection provides a dramatic operational advantage over traditional helicopter surveys, enabling a 40% improvement in survey speed while significantly lowering safety risks for field crews. By incorporating ai powered vegetation risk modeling, utility managers can now accurately forecast growth rates across diverse biomes, optimizing supply chain logistics and workforce allocation.
  • This predictive capability directly supports predictive grid maintenance data analytics, allowing organizations to allocate budget resources precisely where failure probabilities are highest. Furthermore, the implementation of satellite based utility canopy monitoring offers continuous, wide-area visibility, ensuring strict compliance with evolving environmental regulations without requiring constant physical intervention.
  • When compared to legacy cycle-based cutting, this targeted approach enhances operational planning by isolating specific hazard zones. As a result, utility providers are increasingly adopting integrated right of way vegetation control frameworks. This holistic strategy combines mechanical, chemical, and biological interventions to establish stable, low-growing plant communities.
  • Ultimately, the fusion of advanced remote sensing and intelligent data platforms ensures superior grid reliability, minimizes infrastructure downtime, and drastically reduces the systemic liabilities associated with vegetation encroachment.

What are the key market drivers leading to the rise in the adoption of Utility Vegetation Management Industry?

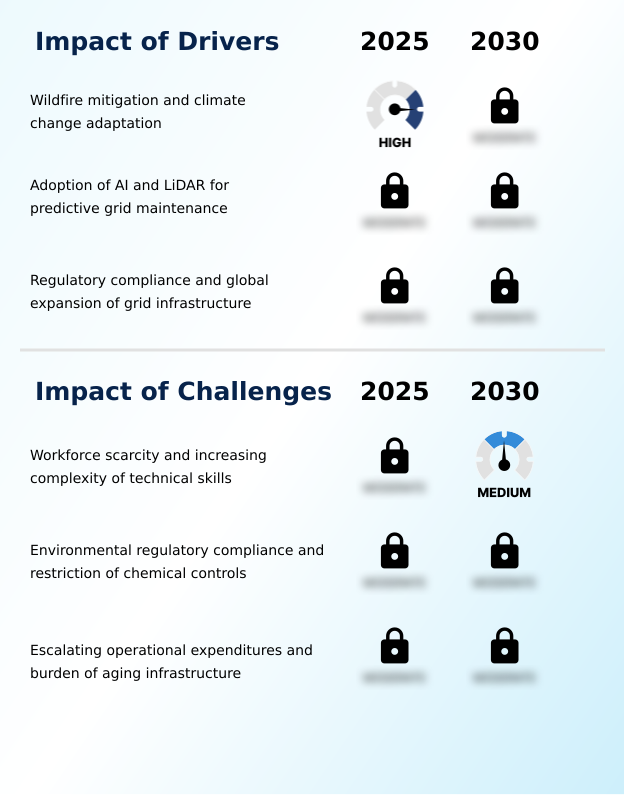
  • Wildfire mitigation and climate change adaptation serve as the primary drivers propelling market growth.

  • Escalating climate volatility and rigorous safety mandates act as the primary catalysts compelling utilities to upgrade their preservation strategies.
  • The urgent need for power line arcing prevention has driven organizations to implement advanced predictive vegetation analytics, resulting in a 20% reduction in weather-related outages.
  • By leveraging machine learning growth models alongside weather-adjusted clearance modeling, network operators can accurately forecast canopy encroachment months in advance. This predictive capacity is essential for executing effective wildfire mitigation strategies and ensuring extreme weather grid resilience.
  • Furthermore, strict regulatory clearance mandates force companies to adopt ai powered vegetation risk modeling to avoid severe compliance penalties. These behavioral and structural changes guarantee that resources are dynamically allocated to protect critical high-voltage infrastructure.

What are the market trends shaping the Utility Vegetation Management Industry?

  • The rise of remote sensing and autonomous aerial inspections represents a significant upcoming trend in the market.

  • The transition toward digital automation and ecological stewardship is radically redefining how utility networks manage encroaching flora. Organizations are rapidly integrating remote sensing technologies to replace dangerous manual surveys, utilizing autonomous drone transmission line inspection to identify hazards in rugged terrains. This shift has improved manual climbing crew efficiency by 25%, as workers are only dispatched to confirmed risk zones.
  • Furthermore, the industry is witnessing the adoption of automated micro-trenching alternatives, which reduce surface disruption in urban corridors. To address acute labor shortages, intensive arborist workforce development programs are being synchronized with advanced line sag risk modeling to prioritize critical interventions. This technology-led approach fundamentally alters operational execution, allowing utility providers to maintain pristine clearances while supporting sustainable infrastructure expansion.

What challenges does the Utility Vegetation Management Industry face during its growth?

  • Workforce scarcity and the increasing complexity of technical skills present significant challenges to industry expansion.

  • The industry faces substantial operational constraints stemming from rigorous environmental regulations and escalating maintenance overheads. Stringent bans on broad-scale chemical herbicide application have forced operators to seek costly mechanical alternatives, negatively impacting budget predictability. While implementing biological control barriers and targeted basal bark treatment improves ecological compliance, these methods require specialized training that exacerbates existing labor shortages.
  • Utilities striving to meet ambient-adjusted rating compliance must execute precise hazardous fuel load reduction, yet are often limited by undergrounding alternative costs which remain prohibitively high for rural networks. Consequently, organizations struggle to balance native pollinator habitat creation with mandatory safety clearances, slowing project execution times by 15%.
  • Relying on predictive grid maintenance data analytics remains crucial, but the initial integration costs hinder rapid deployment for smaller utility cooperatives.

Exclusive Technavio Analysis on Customer Landscape

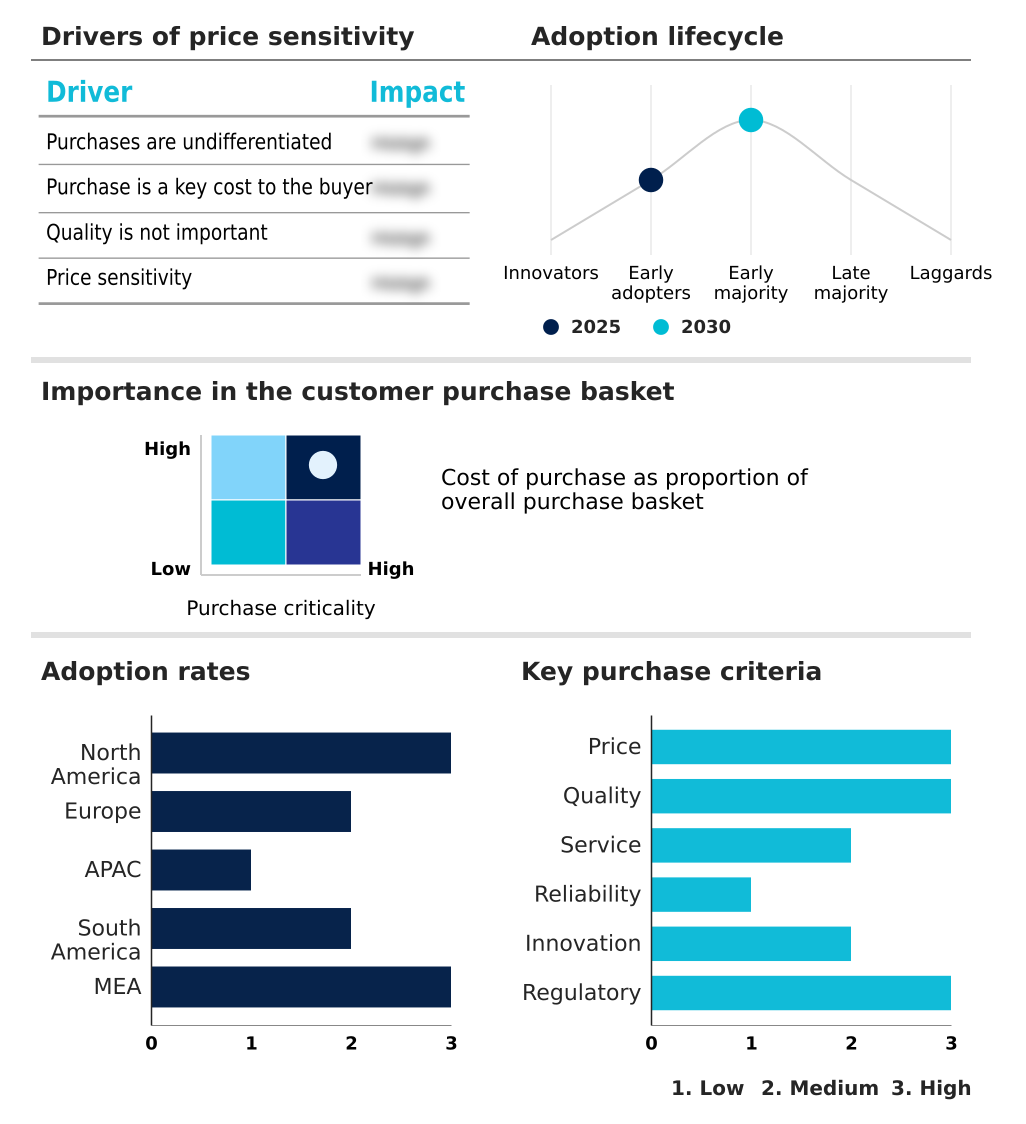
The utility vegetation management market forecasting report includes the adoption lifecycle of the market, covering from the innovator’s stage to the laggard’s stage. It focuses on adoption rates in different regions based on penetration. Furthermore, the utility vegetation management market report also includes key purchase criteria and drivers of price sensitivity to help companies evaluate and develop their market growth analysis strategies.

Customer Landscape of Utility Vegetation Management Industry

Competitive Landscape

Companies are implementing various strategies, such as strategic alliances, utility vegetation management market forecast, partnerships, mergers and acquisitions, geographical expansion, and product/service launches, to enhance their presence in the industry.

ACRT Services Inc. - The provider delivers specialized vegetation intelligence platforms integrating geospatial analytics, predictive risk assessment, and remote monitoring to enhance transmission corridor reliability and streamline maintenance workflows for grid operators.

The industry research and growth report includes detailed analyses of the competitive landscape of the market and information about key companies, including:

  • ACRT Services Inc.
  • AECOM
  • AiDash Inc.
  • Asplundh Tree Expert LLC.
  • EDKO LLC.
  • GE Vernova Inc.
  • Hitachi Energy Ltd.
  • IBM Corp.
  • Lewis Tree Service Inc.
  • LiveEO GmbH
  • Neara
  • NV5 Global Inc.
  • Overstory B.V.
  • Planet Labs PBC
  • Stantec Inc.
  • Tetra Tech Inc.
  • The Davey Tree Expert Co.
  • Trees LLC.
  • Trimble Inc.
  • Wright Tree Service Inc.

Qualitative and quantitative analysis of companies has been conducted to help clients understand the wider business environment as well as the strengths and weaknesses of key industry players. Data is qualitatively analyzed to categorize companies as pure play, category-focused, industry-focused, and diversified; it is quantitatively analyzed to categorize companies as dominant, leading, strong, tentative, and weak.

Recent Development and News in Utility vegetation management market

  • In the Electric Utilities industry, the Federal Energy Regulatory Commission enforcement of Order 881 mandated ambient-adjusted ratings based on real-time weather data, directly impacting global utility vegetation management market 2026-2030 demand by requiring superior line sag risk modeling and mitigation.
  • The large-scale integration of remote renewable energy generation necessitated the construction of over 5,000 miles of new high-capacity transmission lines, increasing the baseline requirement for cross-country transmission rights-of-way clearing and ongoing infrastructure preservation.
  • Stringent environmental policies such as the European Union Nature Restoration Law imposed severe restrictions on synthetic herbicide applications, driving a 20% increase in mechanical clearing operations and native pollinator habitat creation compliance activities.
  • The massive deployment of smart grid sensor networks and digital twin modeling enabled transmission system operators to predict component stress, creating a downstream necessity for precise vegetation encroachment detection to prevent physical contact with critical assets.

Dive into Technavio’s robust research methodology, blending expert interviews, extensive data synthesis, and validated models for unparalleled Utility Vegetation Management Market insights. See full methodology.

Market Scope
Page number 315
Base year 2025
Historic period 2020-2024
Forecast period 2026-2030
Growth momentum & CAGR Accelerate at a CAGR of 5.8%
Market growth 2026-2030 USD 9468.6 million
Market structure Fragmented
YoY growth 2025-2026(%) 5.4%
Key countries US, Canada, Mexico, Germany, UK, France, Italy, Spain, The Netherlands, China, India, Japan, Australia, South Korea, Indonesia, Brazil, Argentina, Colombia, Saudi Arabia, UAE, South Africa, Israel and Turkey
Competitive landscape Leading Companies, Market Positioning of Companies, Competitive Strategies, and Industry Risks

Request Free Sample

Research Analyst Overview

  • The continuous transformation of vegetation management strategies reflects a fundamental shift toward precision infrastructure preservation. Infrastructure operators face compounding pressures to secure overhead assets against severe environmental threats, driving the adoption of sophisticated remote sensing networks.
  • By integrating autonomous aerial inspection and lidar canopy mapping, utility managers have improved spatial clearance accuracy by 30%, directly enhancing operational budgeting and field crew deployment. The strategic transition from routine cutting to robotic brush cutting and targeted drone-based patrol systems significantly optimizes right-of-way maintenance.
  • Furthermore, the deployment of multispectral tree health analysis allows organizations to identify diseased timber before structural failure occurs, directly informing compliance-driven product strategies. As organizations refine their supply chains, the incorporation of digital twin grid simulation enables proactive modeling of extreme weather impacts.
  • This robust digital integration fundamentally alters traditional hazard mitigation, allowing energy providers to establish a highly resilient, data-centric framework that minimizes physical downtime and maximizes long-term operational efficiency.

What are the Key Data Covered in this Utility Vegetation Management Market Research and Growth Report?

  • What is the expected growth of the Utility Vegetation Management Market between 2026 and 2030?

    • USD 9.47 billion, at a CAGR of 5.8%

  • What segmentation does the market report cover?

    • The report is segmented by Service Type (Mechanical trimming and clearing, Integrated vegetation management, Chemical vegetation control, Inspection and assessment, and Others), End-user (Investor-owned utilities, Municipal utilities, Cooperative utilities, and Others), Application (Distribution lines, Transmission lines, and Others) and Geography (North America, Europe, APAC, South America, Middle East and Africa)

  • Which regions are analyzed in the report?

    • North America, Europe, APAC, South America and Middle East and Africa

  • What are the key growth drivers and market challenges?

    • Wildfire mitigation and climate change adaptation, Workforce scarcity and increasing complexity of technical skills

  • Who are the major players in the Utility Vegetation Management Market?

    • ACRT Services Inc., AECOM, AiDash Inc., Asplundh Tree Expert LLC., EDKO LLC., GE Vernova Inc., Hitachi Energy Ltd., IBM Corp., Lewis Tree Service Inc., LiveEO GmbH, Neara, NV5 Global Inc., Overstory B.V., Planet Labs PBC, Stantec Inc., Tetra Tech Inc., The Davey Tree Expert Co., Trees LLC., Trimble Inc. and Wright Tree Service Inc.

Market Research Insights

  • The Utility Vegetation Management Market is rapidly evolving to counter unprecedented environmental and infrastructure liabilities. Driven by stringent regulatory clearance mandates, utility operators are transitioning from reactive maintenance to intelligent, predictive workflows. By implementing risk-based pruning cycles, organizations have improved maintenance targeting efficiency by over 20%, drastically reducing unnecessary labor expenditures.
  • The strategic execution of proactive hazard tree removal acts as a critical component in vegetation-related outage prevention, directly safeguarding critical power delivery systems. Additionally, the development of robust wildfire mitigation strategies has lowered overall compliance penalties for major grid operators. This transformation underscores a profound shift toward advanced digital oversight, ensuring long-term grid resilience against escalating climate volatility.

We can help! Our analysts can customize this utility vegetation management market research report to meet your requirements.

Get in touch

1. Executive Summary

1.1 Market overview

Executive Summary - Chart on Market Overview
Executive Summary - Data Table on Market Overview
Executive Summary - Chart on Global Market Characteristics
Executive Summary - Chart on Market by Geography
Executive Summary - Chart on Market Segmentation by Service Type
Executive Summary - Chart on Market Segmentation by End-user
Executive Summary - Chart on Market Segmentation by Application
Executive Summary - Chart on Incremental Growth
Executive Summary - Data Table on Incremental Growth
Executive Summary - Chart on Company Market Positioning

2. Technavio Analysis

2.1 Analysis of price sensitivity, lifecycle, customer purchase basket, adoption rates, and purchase criteria

2.2 Criticality of inputs and Factors of differentiation

Chart on Overview on criticality of inputs and factors of differentiation

2.3 Factors of disruption

Chart on Overview on factors of disruption

2.4 Impact of drivers and challenges

Chart on Impact of drivers and challenges in 2025 and 2030

3. Market Landscape

3.1 Market ecosystem

Chart on Parent Market
Data Table on - Parent Market

3.2 Market characteristics

Chart on Market characteristics analysis

3.3 Value chain analysis

Chart on Value chain analysis

4. Market Sizing

4.1 Market definition

Data Table on Offerings of companies included in the market definition

4.2 Market segment analysis

Market segments

4.3 Market size 2025

4.4 Market outlook: Forecast for 2025-2030

Chart on Global - Market size and forecast 2025-2030 ($ million)
Data Table on Global - Market size and forecast 2025-2030 ($ million)
Chart on Global Market: Year-over-year growth 2025-2030 (%)
Data Table on Global Market: Year-over-year growth 2025-2030 (%)

5. Historic Market Size

5.1 Global Utility Vegetation Management Market 2020 - 2024

Historic Market Size - Data Table on Global Utility Vegetation Management Market 2020 - 2024 ($ million)

5.2 Service Type segment analysis 2020 - 2024

Historic Market Size - Service Type Segment 2020 - 2024 ($ million)

5.3 End-user segment analysis 2020 - 2024

Historic Market Size - End-user Segment 2020 - 2024 ($ million)

5.4 Application segment analysis 2020 - 2024

Historic Market Size - Application Segment 2020 - 2024 ($ million)

5.5 Geography segment analysis 2020 - 2024

Historic Market Size - Geography Segment 2020 - 2024 ($ million)

5.6 Country segment analysis 2020 - 2024

Historic Market Size - Country Segment 2020 - 2024 ($ million)

6. Qualitative Analysis

6.1 Impact of AI on Global Utility Vegetation Management Market

6.2 Impact of geopolitical conflicts on Global Utility Vegetation Management Market

7. Five Forces Analysis

7.1 Five forces summary

Five forces analysis - Comparison between 2025 and 2030

7.2 Bargaining power of buyers

Bargaining power of buyers - Impact of key factors 2025 and 2030

7.3 Bargaining power of suppliers

Bargaining power of suppliers - Impact of key factors in 2025 and 2030

7.4 Threat of new entrants

Threat of new entrants - Impact of key factors in 2025 and 2030

7.5 Threat of substitutes

Threat of substitutes - Impact of key factors in 2025 and 2030

7.6 Threat of rivalry

Threat of rivalry - Impact of key factors in 2025 and 2030

7.7 Market condition

Chart on Market condition - Five forces 2025 and 2030

8. Market Segmentation by Service Type

8.1 Market segments

Chart on Service Type - Market share 2025-2030 (%)
Data Table on Service Type - Market share 2025-2030 (%)

8.2 Comparison by Service Type

Chart on Comparison by Service Type
Data Table on Comparison by Service Type

8.3 Mechanical trimming and clearing - Market size and forecast 2025-2030

Chart on Mechanical trimming and clearing - Market size and forecast 2025-2030 ($ million)
Data Table on Mechanical trimming and clearing - Market size and forecast 2025-2030 ($ million)
Chart on Mechanical trimming and clearing - Year-over-year growth 2025-2030 (%)
Data Table on Mechanical trimming and clearing - Year-over-year growth 2025-2030 (%)

8.4 Integrated vegetation management - Market size and forecast 2025-2030

Chart on Integrated vegetation management - Market size and forecast 2025-2030 ($ million)
Data Table on Integrated vegetation management - Market size and forecast 2025-2030 ($ million)
Chart on Integrated vegetation management - Year-over-year growth 2025-2030 (%)
Data Table on Integrated vegetation management - Year-over-year growth 2025-2030 (%)

8.5 Chemical vegetation control - Market size and forecast 2025-2030

Chart on Chemical vegetation control - Market size and forecast 2025-2030 ($ million)
Data Table on Chemical vegetation control - Market size and forecast 2025-2030 ($ million)
Chart on Chemical vegetation control - Year-over-year growth 2025-2030 (%)
Data Table on Chemical vegetation control - Year-over-year growth 2025-2030 (%)

8.6 Inspection and assessment - Market size and forecast 2025-2030

Chart on Inspection and assessment - Market size and forecast 2025-2030 ($ million)
Data Table on Inspection and assessment - Market size and forecast 2025-2030 ($ million)
Chart on Inspection and assessment - Year-over-year growth 2025-2030 (%)
Data Table on Inspection and assessment - Year-over-year growth 2025-2030 (%)

8.7 Others - Market size and forecast 2025-2030

Chart on Others - Market size and forecast 2025-2030 ($ million)
Data Table on Others - Market size and forecast 2025-2030 ($ million)
Chart on Others - Year-over-year growth 2025-2030 (%)
Data Table on Others - Year-over-year growth 2025-2030 (%)

8.8 Market opportunity by Service Type

Market opportunity by Service Type ($ million)
Data Table on Market opportunity by Service Type ($ million)

9. Market Segmentation by End-user

9.1 Market segments

Chart on End-user - Market share 2025-2030 (%)
Data Table on End-user - Market share 2025-2030 (%)

9.2 Comparison by End-user

Chart on Comparison by End-user
Data Table on Comparison by End-user

9.3 Investor-owned utilities - Market size and forecast 2025-2030

Chart on Investor-owned utilities - Market size and forecast 2025-2030 ($ million)
Data Table on Investor-owned utilities - Market size and forecast 2025-2030 ($ million)
Chart on Investor-owned utilities - Year-over-year growth 2025-2030 (%)
Data Table on Investor-owned utilities - Year-over-year growth 2025-2030 (%)

9.4 Municipal utilities - Market size and forecast 2025-2030

Chart on Municipal utilities - Market size and forecast 2025-2030 ($ million)
Data Table on Municipal utilities - Market size and forecast 2025-2030 ($ million)
Chart on Municipal utilities - Year-over-year growth 2025-2030 (%)
Data Table on Municipal utilities - Year-over-year growth 2025-2030 (%)

9.5 Cooperative utilities - Market size and forecast 2025-2030

Chart on Cooperative utilities - Market size and forecast 2025-2030 ($ million)
Data Table on Cooperative utilities - Market size and forecast 2025-2030 ($ million)
Chart on Cooperative utilities - Year-over-year growth 2025-2030 (%)
Data Table on Cooperative utilities - Year-over-year growth 2025-2030 (%)

9.6 Others - Market size and forecast 2025-2030

Chart on Others - Market size and forecast 2025-2030 ($ million)
Data Table on Others - Market size and forecast 2025-2030 ($ million)
Chart on Others - Year-over-year growth 2025-2030 (%)
Data Table on Others - Year-over-year growth 2025-2030 (%)

9.7 Market opportunity by End-user

Market opportunity by End-user ($ million)
Data Table on Market opportunity by End-user ($ million)

10. Market Segmentation by Application

10.1 Market segments

Chart on Application - Market share 2025-2030 (%)
Data Table on Application - Market share 2025-2030 (%)

10.2 Comparison by Application

Chart on Comparison by Application
Data Table on Comparison by Application

10.3 Distribution lines - Market size and forecast 2025-2030

Chart on Distribution lines - Market size and forecast 2025-2030 ($ million)
Data Table on Distribution lines - Market size and forecast 2025-2030 ($ million)
Chart on Distribution lines - Year-over-year growth 2025-2030 (%)
Data Table on Distribution lines - Year-over-year growth 2025-2030 (%)

10.4 Transmission lines - Market size and forecast 2025-2030

Chart on Transmission lines - Market size and forecast 2025-2030 ($ million)
Data Table on Transmission lines - Market size and forecast 2025-2030 ($ million)
Chart on Transmission lines - Year-over-year growth 2025-2030 (%)
Data Table on Transmission lines - Year-over-year growth 2025-2030 (%)

10.5 Others - Market size and forecast 2025-2030

Chart on Others - Market size and forecast 2025-2030 ($ million)
Data Table on Others - Market size and forecast 2025-2030 ($ million)
Chart on Others - Year-over-year growth 2025-2030 (%)
Data Table on Others - Year-over-year growth 2025-2030 (%)

10.6 Market opportunity by Application

Market opportunity by Application ($ million)
Data Table on Market opportunity by Application ($ million)

11. Customer Landscape

11.1 Customer landscape overview

Analysis of price sensitivity, lifecycle, customer purchase basket, adoption rates, and purchase criteria

12. Geographic Landscape

12.1 Geographic segmentation

Chart on Market share by geography 2025-2030 (%)
Data Table on Market share by geography 2025-2030 (%)

12.2 Geographic comparison

Chart on Geographic comparison
Data Table on Geographic comparison

12.3 North America - Market size and forecast 2025-2030

Chart on North America - Market size and forecast 2025-2030 ($ million)
Data Table on North America - Market size and forecast 2025-2030 ($ million)
Chart on North America - Year-over-year growth 2025-2030 (%)
Data Table on North America - Year-over-year growth 2025-2030 (%)
Chart on Regional Comparison - North America
Data Table on Regional Comparison - North America

12.3.1 US - Market size and forecast 2025-2030

Chart on US - Market size and forecast 2025-2030 ($ million)
Data Table on US - Market size and forecast 2025-2030 ($ million)
Chart on US - Year-over-year growth 2025-2030 (%)
Data Table on US - Year-over-year growth 2025-2030 (%)

12.3.2 Canada - Market size and forecast 2025-2030

Chart on Canada - Market size and forecast 2025-2030 ($ million)
Data Table on Canada - Market size and forecast 2025-2030 ($ million)
Chart on Canada - Year-over-year growth 2025-2030 (%)
Data Table on Canada - Year-over-year growth 2025-2030 (%)

12.3.3 Mexico - Market size and forecast 2025-2030

Chart on Mexico - Market size and forecast 2025-2030 ($ million)
Data Table on Mexico - Market size and forecast 2025-2030 ($ million)
Chart on Mexico - Year-over-year growth 2025-2030 (%)
Data Table on Mexico - Year-over-year growth 2025-2030 (%)

12.4 Europe - Market size and forecast 2025-2030

Chart on Europe - Market size and forecast 2025-2030 ($ million)
Data Table on Europe - Market size and forecast 2025-2030 ($ million)
Chart on Europe - Year-over-year growth 2025-2030 (%)
Data Table on Europe - Year-over-year growth 2025-2030 (%)
Chart on Regional Comparison - Europe
Data Table on Regional Comparison - Europe

12.4.1 Germany - Market size and forecast 2025-2030

Chart on Germany - Market size and forecast 2025-2030 ($ million)
Data Table on Germany - Market size and forecast 2025-2030 ($ million)
Chart on Germany - Year-over-year growth 2025-2030 (%)
Data Table on Germany - Year-over-year growth 2025-2030 (%)

12.4.2 UK - Market size and forecast 2025-2030

Chart on UK - Market size and forecast 2025-2030 ($ million)
Data Table on UK - Market size and forecast 2025-2030 ($ million)
Chart on UK - Year-over-year growth 2025-2030 (%)
Data Table on UK - Year-over-year growth 2025-2030 (%)

12.4.3 France - Market size and forecast 2025-2030

Chart on France - Market size and forecast 2025-2030 ($ million)
Data Table on France - Market size and forecast 2025-2030 ($ million)
Chart on France - Year-over-year growth 2025-2030 (%)
Data Table on France - Year-over-year growth 2025-2030 (%)

12.4.4 Italy - Market size and forecast 2025-2030

Chart on Italy - Market size and forecast 2025-2030 ($ million)
Data Table on Italy - Market size and forecast 2025-2030 ($ million)
Chart on Italy - Year-over-year growth 2025-2030 (%)
Data Table on Italy - Year-over-year growth 2025-2030 (%)

12.4.5 Spain - Market size and forecast 2025-2030

Chart on Spain - Market size and forecast 2025-2030 ($ million)
Data Table on Spain - Market size and forecast 2025-2030 ($ million)
Chart on Spain - Year-over-year growth 2025-2030 (%)
Data Table on Spain - Year-over-year growth 2025-2030 (%)

12.4.6 The Netherlands - Market size and forecast 2025-2030

Chart on The Netherlands - Market size and forecast 2025-2030 ($ million)
Data Table on The Netherlands - Market size and forecast 2025-2030 ($ million)
Chart on The Netherlands - Year-over-year growth 2025-2030 (%)
Data Table on The Netherlands - Year-over-year growth 2025-2030 (%)

12.5 APAC - Market size and forecast 2025-2030

Chart on APAC - Market size and forecast 2025-2030 ($ million)
Data Table on APAC - Market size and forecast 2025-2030 ($ million)
Chart on APAC - Year-over-year growth 2025-2030 (%)
Data Table on APAC - Year-over-year growth 2025-2030 (%)
Chart on Regional Comparison - APAC
Data Table on Regional Comparison - APAC

12.5.1 China - Market size and forecast 2025-2030

Chart on China - Market size and forecast 2025-2030 ($ million)
Data Table on China - Market size and forecast 2025-2030 ($ million)
Chart on China - Year-over-year growth 2025-2030 (%)
Data Table on China - Year-over-year growth 2025-2030 (%)

12.5.2 India - Market size and forecast 2025-2030

Chart on India - Market size and forecast 2025-2030 ($ million)
Data Table on India - Market size and forecast 2025-2030 ($ million)
Chart on India - Year-over-year growth 2025-2030 (%)
Data Table on India - Year-over-year growth 2025-2030 (%)

12.5.3 Japan - Market size and forecast 2025-2030

Chart on Japan - Market size and forecast 2025-2030 ($ million)
Data Table on Japan - Market size and forecast 2025-2030 ($ million)
Chart on Japan - Year-over-year growth 2025-2030 (%)
Data Table on Japan - Year-over-year growth 2025-2030 (%)

12.5.4 Australia - Market size and forecast 2025-2030

Chart on Australia - Market size and forecast 2025-2030 ($ million)
Data Table on Australia - Market size and forecast 2025-2030 ($ million)
Chart on Australia - Year-over-year growth 2025-2030 (%)
Data Table on Australia - Year-over-year growth 2025-2030 (%)

12.5.5 South Korea - Market size and forecast 2025-2030

Chart on South Korea - Market size and forecast 2025-2030 ($ million)
Data Table on South Korea - Market size and forecast 2025-2030 ($ million)
Chart on South Korea - Year-over-year growth 2025-2030 (%)
Data Table on South Korea - Year-over-year growth 2025-2030 (%)

12.5.6 Indonesia - Market size and forecast 2025-2030

Chart on Indonesia - Market size and forecast 2025-2030 ($ million)
Data Table on Indonesia - Market size and forecast 2025-2030 ($ million)
Chart on Indonesia - Year-over-year growth 2025-2030 (%)
Data Table on Indonesia - Year-over-year growth 2025-2030 (%)

12.6 South America - Market size and forecast 2025-2030

Chart on South America - Market size and forecast 2025-2030 ($ million)
Data Table on South America - Market size and forecast 2025-2030 ($ million)
Chart on South America - Year-over-year growth 2025-2030 (%)
Data Table on South America - Year-over-year growth 2025-2030 (%)
Chart on Regional Comparison - South America
Data Table on Regional Comparison - South America

12.6.1 Brazil - Market size and forecast 2025-2030

Chart on Brazil - Market size and forecast 2025-2030 ($ million)
Data Table on Brazil - Market size and forecast 2025-2030 ($ million)
Chart on Brazil - Year-over-year growth 2025-2030 (%)
Data Table on Brazil - Year-over-year growth 2025-2030 (%)

12.6.2 Argentina - Market size and forecast 2025-2030

Chart on Argentina - Market size and forecast 2025-2030 ($ million)
Data Table on Argentina - Market size and forecast 2025-2030 ($ million)
Chart on Argentina - Year-over-year growth 2025-2030 (%)
Data Table on Argentina - Year-over-year growth 2025-2030 (%)

12.6.3 Colombia - Market size and forecast 2025-2030

Chart on Colombia - Market size and forecast 2025-2030 ($ million)
Data Table on Colombia - Market size and forecast 2025-2030 ($ million)
Chart on Colombia - Year-over-year growth 2025-2030 (%)
Data Table on Colombia - Year-over-year growth 2025-2030 (%)

12.7 Middle East and Africa - Market size and forecast 2025-2030

Chart on Middle East and Africa - Market size and forecast 2025-2030 ($ million)
Data Table on Middle East and Africa - Market size and forecast 2025-2030 ($ million)
Chart on Middle East and Africa - Year-over-year growth 2025-2030 (%)
Data Table on Middle East and Africa - Year-over-year growth 2025-2030 (%)
Chart on Regional Comparison - Middle East and Africa
Data Table on Regional Comparison - Middle East and Africa

12.7.1 Saudi Arabia - Market size and forecast 2025-2030

Chart on Saudi Arabia - Market size and forecast 2025-2030 ($ million)
Data Table on Saudi Arabia - Market size and forecast 2025-2030 ($ million)
Chart on Saudi Arabia - Year-over-year growth 2025-2030 (%)
Data Table on Saudi Arabia - Year-over-year growth 2025-2030 (%)

12.7.2 UAE - Market size and forecast 2025-2030

Chart on UAE - Market size and forecast 2025-2030 ($ million)
Data Table on UAE - Market size and forecast 2025-2030 ($ million)
Chart on UAE - Year-over-year growth 2025-2030 (%)
Data Table on UAE - Year-over-year growth 2025-2030 (%)

12.7.3 South Africa - Market size and forecast 2025-2030

Chart on South Africa - Market size and forecast 2025-2030 ($ million)
Data Table on South Africa - Market size and forecast 2025-2030 ($ million)
Chart on South Africa - Year-over-year growth 2025-2030 (%)
Data Table on South Africa - Year-over-year growth 2025-2030 (%)

12.7.4 Israel - Market size and forecast 2025-2030

Chart on Israel - Market size and forecast 2025-2030 ($ million)
Data Table on Israel - Market size and forecast 2025-2030 ($ million)
Chart on Israel - Year-over-year growth 2025-2030 (%)
Data Table on Israel - Year-over-year growth 2025-2030 (%)

12.7.5 Turkey - Market size and forecast 2025-2030

Chart on Turkey - Market size and forecast 2025-2030 ($ million)
Data Table on Turkey - Market size and forecast 2025-2030 ($ million)
Chart on Turkey - Year-over-year growth 2025-2030 (%)
Data Table on Turkey - Year-over-year growth 2025-2030 (%)

12.8 Market opportunity by geography

Market opportunity by geography ($ million)
Data Tables on Market opportunity by geography ($ million)

13. Drivers, Challenges, and Opportunity

13.1 Market drivers

Wildfire mitigation and climate change adaptation
Adoption of AI and LiDAR for predictive grid maintenance
Regulatory compliance and global expansion of grid infrastructure

13.2 Market challenges

Workforce scarcity and increasing complexity of technical skills
Environmental regulatory compliance and restriction of chemical controls
Escalating operational expenditures and burden of aging infrastructure

13.3 Impact of drivers and challenges

Impact of drivers and challenges in 2025 and 2030

13.4 Market opportunities

Rise of remote sensing and autonomous aerial inspections
Ecological integration and sustainable land management practices
Evolution of predictive maintenance and digital twin adoption

14. Competitive Landscape

14.1 Overview

14.2

Overview on criticality of inputs and factors of differentiation

14.3 Landscape disruption

Overview on factors of disruption

14.4 Industry risks

Impact of key risks on business

15. Competitive Analysis

15.1 Companies profiled

Companies covered

15.2 Company ranking index

15.3 Market positioning of companies

Matrix on companies position and classification

15.4 ACRT Services Inc.

ACRT Services Inc. - Overview
ACRT Services Inc. - Product / Service
ACRT Services Inc. - Key offerings
SWOT

15.5 AECOM

AECOM - Overview
AECOM - Business segments
AECOM - Key offerings
AECOM - Segment focus
SWOT

15.6 AiDash Inc.

AiDash Inc. - Overview
AiDash Inc. - Product / Service
AiDash Inc. - Key offerings
SWOT

15.7 Asplundh Tree Expert LLC.

Asplundh Tree Expert LLC. - Overview
Asplundh Tree Expert LLC. - Product / Service
Asplundh Tree Expert LLC. - Key offerings
SWOT

15.8 EDKO LLC.

EDKO LLC. - Overview
EDKO LLC. - Product / Service
EDKO LLC. - Key offerings
SWOT

15.9 GE Vernova Inc.

GE Vernova Inc. - Overview
GE Vernova Inc. - Business segments
GE Vernova Inc. - Key offerings
GE Vernova Inc. - Segment focus
SWOT

15.10 Hitachi Energy Ltd.

Hitachi Energy Ltd. - Overview
Hitachi Energy Ltd. - Product / Service
Hitachi Energy Ltd. - Key offerings
SWOT

15.11 IBM Corp.

IBM Corp. - Overview
IBM Corp. - Business segments
IBM Corp. - Key news
IBM Corp. - Key offerings
IBM Corp. - Segment focus
SWOT

15.12 Lewis Tree Service Inc.

Lewis Tree Service Inc. - Overview
Lewis Tree Service Inc. - Product / Service
Lewis Tree Service Inc. - Key offerings
SWOT

15.13 LiveEO GmbH

LiveEO GmbH - Overview
LiveEO GmbH - Product / Service
LiveEO GmbH - Key offerings
SWOT

15.14 Neara

Neara - Overview
Neara - Product / Service
Neara - Key offerings
SWOT

15.15 NV5 Global Inc.

NV5 Global Inc. - Overview
NV5 Global Inc. - Product / Service
NV5 Global Inc. - Key offerings
SWOT

15.16 Overstory B.V.

Overstory B.V. - Overview
Overstory B.V. - Product / Service
Overstory B.V. - Key offerings
SWOT

15.17 Planet Labs PBC

Planet Labs PBC - Overview
Planet Labs PBC - Product / Service
Planet Labs PBC - Key offerings
SWOT

15.18 The Davey Tree Expert Co.

The Davey Tree Expert Co. - Overview
The Davey Tree Expert Co. - Product / Service
The Davey Tree Expert Co. - Key offerings
SWOT

16. Appendix

16.1 Scope of the report

Market definition
Objectives
Notes and caveats

16.2 Inclusions and exclusions checklist

Inclusions checklist
Exclusions checklist

16.3 Currency conversion rates for US$

16.4 Research methodology

16.5 Data procurement

Information sources

16.6 Data validation

16.7 Validation techniques employed for market sizing

16.8 Data synthesis

16.9 360 degree market analysis

16.10 List of abbreviations

Research Methodology

Technavio presents a detailed picture of the market by way of study, synthesis, and summation of data from multiple sources. The analysts have presented the various facets of the market with a particular focus on identifying the key industry influencers. The data thus presented is comprehensive, reliable, and the result of extensive research, both primary and secondary.

INFORMATION SOURCES

Primary sources

  • Manufacturers and suppliers
  • Channel partners
  • Industry experts
  • Strategic decision makers

Secondary sources

  • Industry journals and periodicals
  • Government data
  • Financial reports of key industry players
  • Historical data
  • Press releases

DATA ANALYSIS

Data Synthesis

  • Collation of data
  • Estimation of key figures
  • Analysis of derived insights

Data Validation

  • Triangulation with data models
  • Reference against proprietary databases
  • Corroboration with industry experts

REPORT WRITING

Qualitative

  • Market drivers
  • Market challenges
  • Market trends
  • Five forces analysis

Quantitative

  • Market size and forecast
  • Market segmentation
  • Geographical insights
  • Competitive landscape

Interested in this report?

Get your sample now to see our research methodology and insights!

Download Now

Frequently Asked Questions

Utility Vegetation Management market growth will increase by USD 9468.6 million during 2026-2030.

The Utility Vegetation Management market is expected to grow at a CAGR of 5.8% during 2026-2030.

Utility Vegetation Management market is segmented by Service type (Mechanical trimming and clearing, Integrated vegetation management, Chemical vegetation control, Inspection and assessment, Others) End-user (Investor-owned utilities, Municipal utilities, Cooperative utilities, Others) Application (Distribution lines, Transmission lines, Others)

ACRT Services Inc., AECOM, AiDash Inc., Asplundh Tree Expert LLC., EDKO LLC., GE Vernova Inc., Hitachi Energy Ltd., IBM Corp., Lewis Tree Service Inc., LiveEO GmbH, Neara, NV5 Global Inc., Overstory B.V., Planet Labs PBC, Stantec Inc., Tetra Tech Inc., The Davey Tree Expert Co., Trees LLC., Trimble Inc., Wright Tree Service Inc. are a few of the key vendors in the Utility Vegetation Management market.

North America will register the highest growth rate of 40.7% among the other regions. Therefore, the Utility Vegetation Management market in North America is expected to garner significant business opportunities for the vendors during the forecast period.

US, Canada, Mexico, Germany, UK, France, Italy, Spain, The Netherlands, China, India, Japan, Australia, South Korea, Indonesia, Brazil, Argentina, Colombia, Saudi Arabia, UAE, South Africa, Israel, Turkey

  • Wildfire mitigation and climate change adaptation is the driving factor this market.

The Utility Vegetation Management market vendors should focus on grabbing business opportunities from the Service type segment as it accounted for the largest market share in the base year.
RIA - Research AI Assistant
Ask RIA