Variable Air Volume Box Market Analysis, Size, and Forecast 2026-2030: APAC (China, Japan, and India), North America (US, Canada, and Mexico), Europe (Germany, UK, and France), Middle East and Africa (Saudi Arabia, UAE, and South Africa), South America (Brazil, Argentina, and Colombia), and Rest of World (ROW)

Variable Air Volume Box Market Analysis, Size, and Forecast 2026-2030:
APAC (China, Japan, and India), North America (US, Canada, and Mexico), Europe (Germany, UK, and France), Middle East and Africa (Saudi Arabia, UAE, and South Africa), South America (Brazil, Argentina, and Colombia), and Rest of World (ROW)

Published: Jan 2026 293 Pages SKU: IRTNTR81240

Market Overview at a Glance

$2.04 B
Market Opportunity
6.7%
CAGR 2025 - 2030
42.1%
APAC Growth
$2.07 B
Single-duct VAV segment 2024

Variable Air Volume Box Market Size 2026-2030

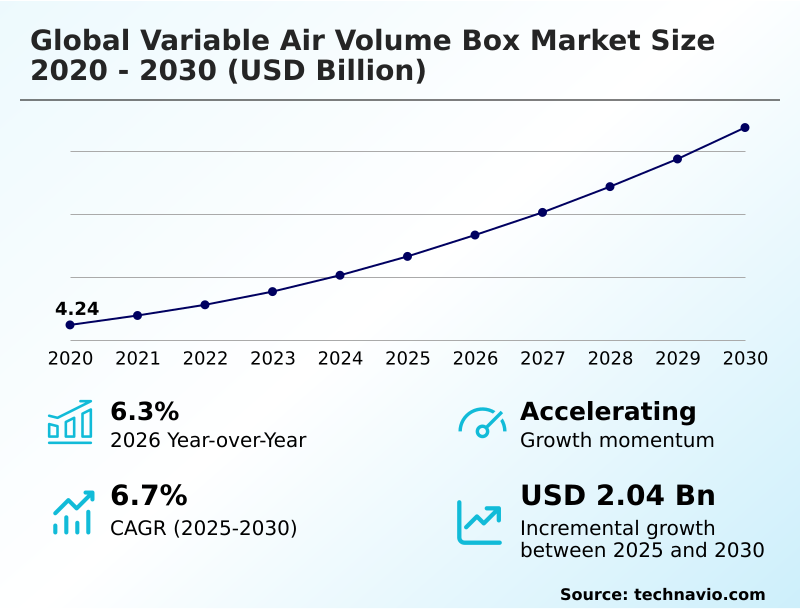
The variable air volume box market size is valued to increase by USD 2.04 billion, at a CAGR of 6.7% from 2025 to 2030. Escalating demand for energy efficiency and sustainability in building operations will drive the variable air volume box market.

Major Market Trends & Insights

  • APAC dominated the market and accounted for a 42.1% growth during the forecast period.
  • By Type - Single-duct VAV segment was valued at USD 2.07 billion in 2024
  • By Application - Commercial buildings segment accounted for the largest market revenue share in 2024

Market Size & Forecast

  • Market Opportunities: USD 3.14 billion
  • Market Future Opportunities: USD 2.04 billion
  • CAGR from 2025 to 2030 : 6.7%

Market Summary

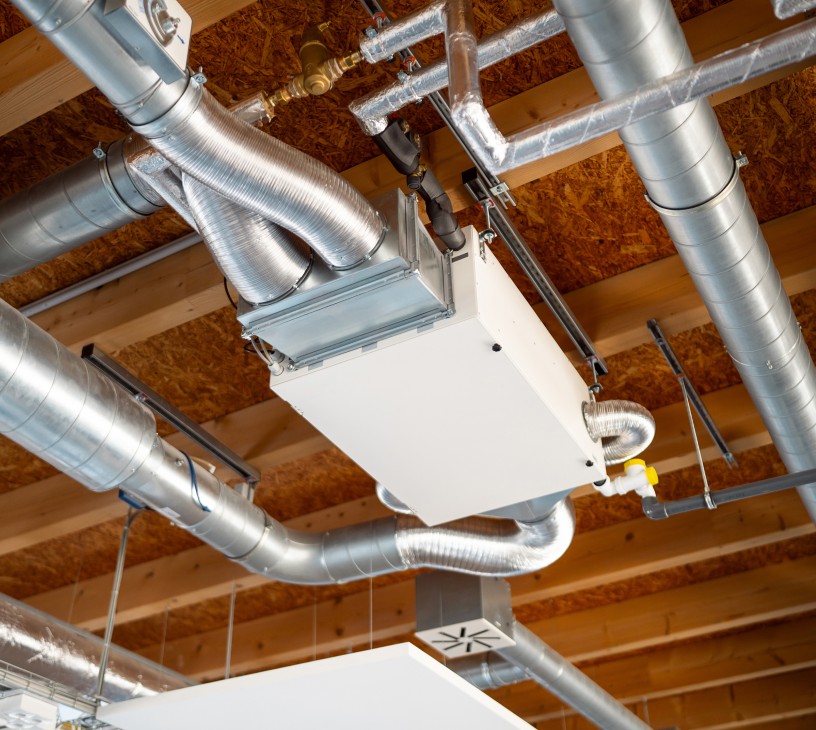
  • The variable air volume box market is experiencing sustained development, driven by the escalating global emphasis on energy efficiency in commercial and industrial buildings. This technology is fundamental to modern HVAC design, allowing for precise HVAC zoning and temperature regulation by modulating airflow to specific areas.
  • The core driver is the significant energy savings achieved by reducing the workload on the central air handling unit and fans through variable frequency drives, directly supporting sustainable building practices and net-zero energy targets. A key trend is the digital transformation of these devices from simple mechanical dampers into intelligent nodes within a smart building ecosystem.
  • The integration of direct digital controls and airflow sensors with building automation systems enables advanced strategies like demand-controlled ventilation and predictive HVAC maintenance.
  • For instance, a facility management firm overseeing a portfolio of commercial properties can leverage this connectivity to analyze real-time performance data, identify units requiring calibration, and optimize energy consumption across all buildings from a central dashboard, improving operational efficiency significantly.
  • However, challenges such as high initial capital costs, the complexity of VAV system commissioning, and the persistent threat from alternative technologies like variable refrigerant flow systems temper market expansion. The need for specialized labor for proper installation and maintenance also remains a considerable barrier for some projects.

What will be the Size of the Variable Air Volume Box Market during the forecast period?

Get Key Insights on Market Forecast (PDF) Request Free Sample

How is the Variable Air Volume Box Market Segmented?

The variable air volume box industry research report provides comprehensive data (region-wise segment analysis), with forecasts and estimates in "USD million" for the period 2026-2030, as well as historical data from 2020-2024 for the following segments.

  • Type
    • Single-duct VAV
    • Fan-powered VAV
    • Dual-duct VAV
    • Induction VAV
  • Application
    • Commercial buildings
    • Industrial buildings
    • Residential buildings
  • End-user
    • New installation
    • Replacement
  • Geography
    • APAC
      • China
      • Japan
      • India
    • North America
      • US
      • Canada
      • Mexico
    • Europe
      • Germany
      • UK
      • France
    • Middle East and Africa
      • Saudi Arabia
      • UAE
      • South Africa
    • South America
      • Brazil
      • Argentina
      • Colombia
    • Rest of World (ROW)

By Type Insights

The single-duct vav segment is estimated to witness significant growth during the forecast period.

Single-duct VAV units are a cornerstone of modern energy-efficient HVAC design, representing the most widely deployed terminal unit for precise HVAC zoning.

These devices regulate conditioned airflow to a specific area using a damper actuator, which modulates based on signals from a local thermostat to achieve exact zone temperature control.

Their operational simplicity and cost-effectiveness make them ideal for interior zones with consistent cooling loads.

Advanced models now feature pressure-independent control, utilizing integrated airflow sensors to maintain a programmed VAV control sequence regardless of duct static pressure fluctuations, improving system stability by up to 35%.

When heating is required, these units are often paired with reheat coils. Proper VAV box sizing and VAV diffuser selection are critical for optimizing performance and occupant comfort.

Request Free Sample

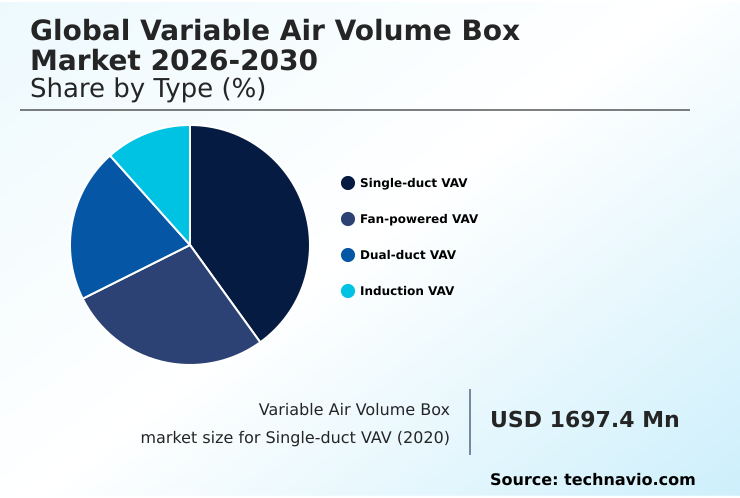
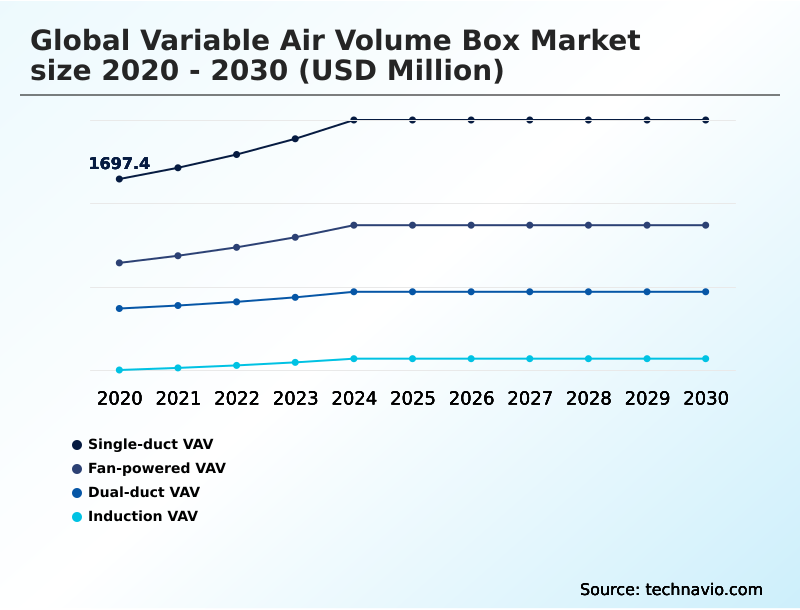
The Single-duct VAV segment was valued at USD 2.07 billion in 2024 and showed a gradual increase during the forecast period.

Request Free Sample

Regional Analysis

APAC is estimated to contribute 42.1% to the growth of the global market during the forecast period.Technavio’s analysts have elaborately explained the regional trends and drivers that shape the market during the forecast period.

See How Variable Air Volume Box Market Demand is Rising in APAC Request Free Sample

The geographic landscape is led by APAC, which accounts for 42.1% of the market's incremental growth, fueled by massive commercial construction in China and India. This region shows high demand for robust air handling unit configurations.

North America remains a mature market focused on retrofits and achieving higher efficiency, contributing 23.7% to growth. In this region, smart VAV controller integration is standard.

Europe, accounting for 22.1% of growth, prioritizes sustainability and specialized systems like induction VAV and dual-duct VAV for applications requiring precise environmental control. It leads in adopting demand response strategies.

Market Dynamics

Our researchers analyzed the data with 2025 as the base year, along with the key drivers, trends, and challenges. A holistic analysis of drivers will help companies refine their marketing strategies to gain a competitive advantage.

  • Facility managers and engineers face complex decisions when specifying and managing modern HVAC systems. Key considerations include the single duct vs fan powered VAV efficiency trade-offs and the total cost of VAV system for commercial building projects. Once installed, VAV box troubleshooting for no airflow is a common maintenance task, often traced to failed VAV box actuators.
  • Improving VAV system acoustic performance is another critical goal, especially for VAV box selection criteria for hospitals and open plan offices. A crucial step is integrating VAV with bacnet building controls for centralized management. Understanding the benefits of pressure independent VAV boxes, which ensure stable airflow, is essential for system stability.
  • For operational planning, having a clear maintenance schedule for VAV terminal units is non-negotiable, just as calculating VAV box minimum CFM settings is vital during commissioning. The process of upgrading pneumatic VAV to digital controls is a major retrofit trend, directly impacting the role of VAV in LEED certification.
  • Implementing an optimized VAV box control logic for energy savings can significantly reduce operational costs. The impact of static pressure on VAV performance cannot be overstated. Choices like a VAV terminal unit with electric reheat or a wireless thermostat for VAV systems depend on climate and infrastructure. Addressing common failures in VAV box actuators proactively can reduce system downtime.
  • Ultimately, the VAV vs VRF systems comparison shows that VAV systems improve tenant comfort more effectively in large, multi-zone applications, with post-retrofit tenant satisfaction scores often improving by a greater margin than with alternative systems. For specialized areas like cleanrooms, a VAV box for laboratory ventilation control is indispensable.

What are the key market drivers leading to the rise in the adoption of Variable Air Volume Box Industry?

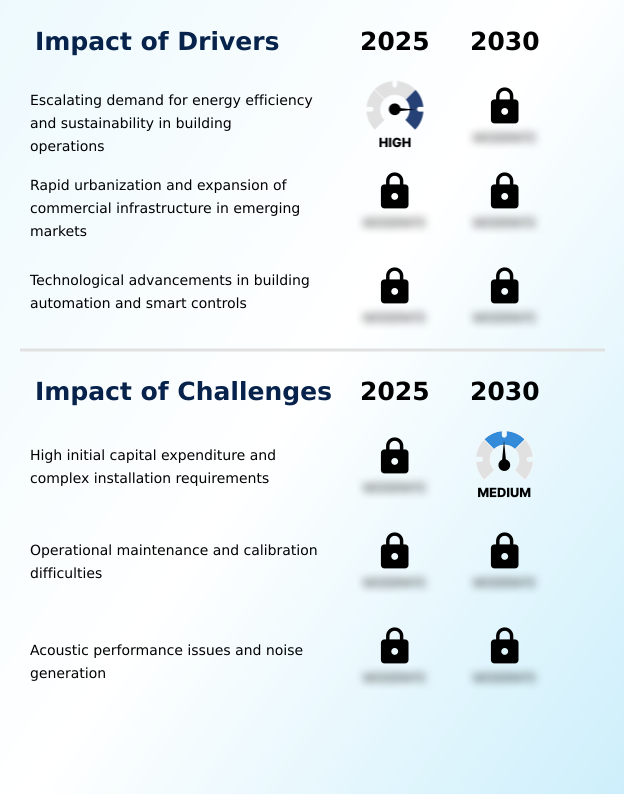
  • The escalating demand for greater energy efficiency and sustainability in building operations is a primary driver for the market.

  • The drive toward achieving net-zero energy targets, underpinned by regulations like the energy performance of buildings directive, is a major market catalyst.
  • Adoption of sustainable building practices is compelling a shift to systems that enable demand-controlled ventilation, which can reduce the energy consumption of an air handling unit by over 30%.
  • The synergy between variable frequency drives on central fans and intelligent building automation systems creates a smart building ecosystem.
  • This integration optimizes energy use, with the specification of electronically commutated motors in fan-powered units further reducing localized energy consumption by up to 50% compared to older motor types. These integrated building controls are fundamental to modern, high-performance building design.

What are the market trends shaping the Variable Air Volume Box Industry?

  • The integration of IoT capabilities and advanced data analytics into variable air volume systems emerges as a transformative market trend. This evolution is reshaping building management for enhanced operational intelligence.

  • A significant trend is the intensified focus on indoor environmental quality, pushing manufacturers to innovate beyond simple temperature control. Modern terminal unit designs prioritize superior terminal unit acoustics and acoustic attenuation to meet stringent noise criteria ratings, with some advanced models reducing perceptible noise by up to 25%.
  • This shift addresses new indoor air quality standards and tenant expectations for healthier workspaces. The integration with building management systems enables predictive HVAC maintenance, reducing system downtime by 15%. VAV box retrofit solutions are increasingly incorporating sensors for occupancy-based airflow, optimizing ventilation and energy use in real time.

What challenges does the Variable Air Volume Box Industry face during its growth?

  • The high initial capital expenditure and complex installation requirements associated with the technology present a key challenge to market growth.

  • The complexity and cost of VAV system commissioning and balancing remain significant challenges. Improper static pressure control can lead to operational inefficiencies and acoustic issues, while inaccurate airflow sensors can degrade performance, with deviations of just 10% in airflow measurement accuracy impacting energy use.
  • The threat from alternative technologies like variable refrigerant flow and chilled beam systems, which can offer simpler installation in certain scenarios, is persistent. Furthermore, the expense of a pneumatic to DDC upgrade, though beneficial long-term, presents a high initial financial barrier.
  • The labor-intensive nature of VAV system balancing can increase project costs by 15-20% compared to less complex systems, deterring adoption in smaller-scale projects.

Exclusive Technavio Analysis on Customer Landscape

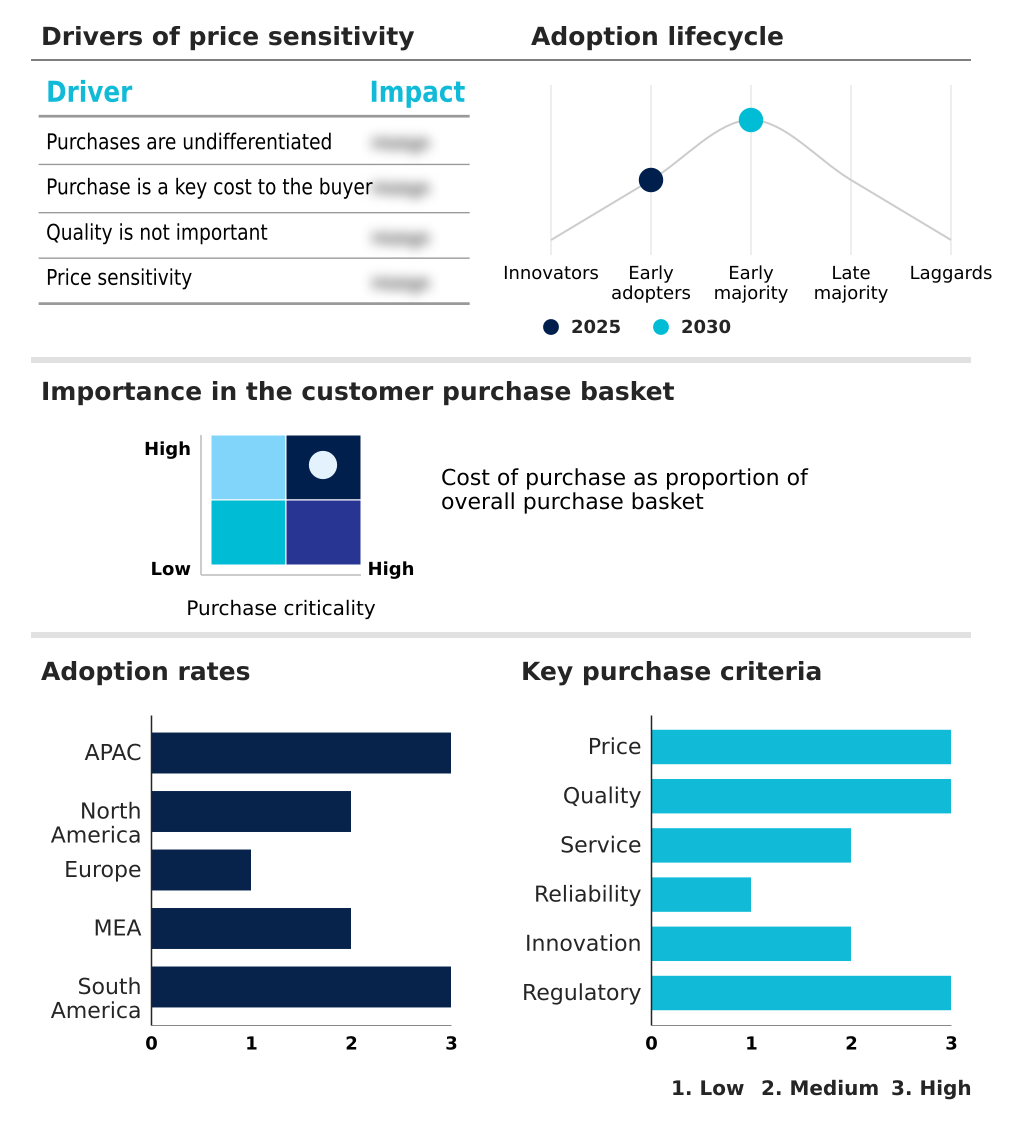
The variable air volume box market forecasting report includes the adoption lifecycle of the market, covering from the innovator’s stage to the laggard’s stage. It focuses on adoption rates in different regions based on penetration. Furthermore, the variable air volume box market report also includes key purchase criteria and drivers of price sensitivity to help companies evaluate and develop their market growth analysis strategies.

Customer Landscape of Variable Air Volume Box Industry

Competitive Landscape

Companies are implementing various strategies, such as strategic alliances, variable air volume box market forecast, partnerships, mergers and acquisitions, geographical expansion, and product/service launches, to enhance their presence in the industry.

Air Master - Core offerings center on advanced air terminal units and integrated controls, engineered to optimize building energy performance and enhance indoor environmental quality.

The industry research and growth report includes detailed analyses of the competitive landscape of the market and information about key companies, including:

  • Air Master
  • Aldes Group Export
  • Anemostat, Inc.
  • Barcol Air
  • Carrier Global Corp.
  • Daikin Industries Ltd.
  • FlaktGroup Holding GmbH
  • Johnson Controls International
  • Lindab AB
  • Metalaire
  • Nailor Industries Inc.
  • Pari Infrastructure Ltd.
  • SRP Automation Pvt. Ltd.
  • Swegon Group AB
  • Titus
  • Trane Technologies plc
  • TROX SE
  • Tuttle and Bailey
  • Warren Technology Inc.

Qualitative and quantitative analysis of companies has been conducted to help clients understand the wider business environment as well as the strengths and weaknesses of key industry players. Data is qualitatively analyzed to categorize companies as pure play, category-focused, industry-focused, and diversified; it is quantitatively analyzed to categorize companies as dominant, leading, strong, tentative, and weak.

Recent Development and News in Variable air volume box market

  • In February 2025, The International Energy Efficiency Bureau released updated guidelines mandating that all new commercial constructions in Tier 1 cities adopt adaptive airflow technologies, accelerating VAV unit deployment.
  • In March 2025, Johnson Controls unveiled a new series of digital variable air volume controllers with advanced algorithms, designed specifically to enhance energy granularity and comfort in large-scale commercial towers.
  • In April 2025, Johnson Controls International announced the acquisition of a specialized sensor technology firm to enhance the AI capabilities of their VAV box controllers, aiming to improve autonomous airflow regulation.
  • In May 2025, Trane Technologies announced a strategic partnership with a major European real estate management firm to execute a comprehensive retrofit program, replacing outdated air distribution units with high-efficiency VAV boxes.

Dive into Technavio’s robust research methodology, blending expert interviews, extensive data synthesis, and validated models for unparalleled Variable Air Volume Box Market insights. See full methodology.

Market Scope
Page number 293
Base year 2025
Historic period 2020-2024
Forecast period 2026-2030
Growth momentum & CAGR Accelerate at a CAGR of 6.7%
Market growth 2026-2030 USD 2044.5 million
Market structure Fragmented
YoY growth 2025-2026(%) 6.3%
Key countries China, Japan, India, South Korea, Australia, Indonesia, US, Canada, Mexico, Germany, UK, France, Italy, Spain, The Netherlands, Saudi Arabia, UAE, South Africa, Israel, Turkey, Brazil, Argentina and Colombia
Competitive landscape Leading Companies, Market Positioning of Companies, Competitive Strategies, and Industry Risks

Request Free Sample

Research Analyst Overview

  • The variable air volume box market is defined by a technological shift toward smarter, more efficient air distribution. The core components, from the basic single-duct VAV to the more complex fan-powered VAV, dual-duct VAV, and induction VAV types, are now integral parts of cohesive building automation systems.
  • Integration with the central air handling unit is managed through direct digital controls, which receive data from airflow sensors to modulate a damper actuator. This allows for precise pressure-independent control and dynamic HVAC zoning. A critical decision for facility managers is optimizing static pressure control for variable frequency drives, as improper setup can negate energy savings.
  • The emphasis on indoor environmental quality has also elevated the importance of meeting stringent noise criteria ratings through advanced acoustic attenuation. In a recent analysis of building retrofits, projects that upgraded to terminal unit controllers with predictive algorithms achieved a 15% faster return on investment through optimized energy use compared to those with standard controls.
  • This highlights the growing importance of software in hardware performance.

What are the Key Data Covered in this Variable Air Volume Box Market Research and Growth Report?

  • What is the expected growth of the Variable Air Volume Box Market between 2026 and 2030?

    • USD 2.04 billion, at a CAGR of 6.7%

  • What segmentation does the market report cover?

    • The report is segmented by Type (Single-duct VAV, Fan-powered VAV, Dual-duct VAV, and Induction VAV), Application (Commercial buildings, Industrial buildings, and Residential buildings), End-user (New installation, and Replacement) and Geography (APAC, North America, Europe, Middle East and Africa, South America)

  • Which regions are analyzed in the report?

    • APAC, North America, Europe, Middle East and Africa and South America

  • What are the key growth drivers and market challenges?

    • Escalating demand for energy efficiency and sustainability in building operations, High initial capital expenditure and complex installation requirements

  • Who are the major players in the Variable Air Volume Box Market?

    • Air Master, Aldes Group Export, Anemostat, Inc., Barcol Air, Carrier Global Corp., Daikin Industries Ltd., FlaktGroup Holding GmbH, Johnson Controls International, Lindab AB, Metalaire, Nailor Industries Inc., Pari Infrastructure Ltd., SRP Automation Pvt. Ltd., Swegon Group AB, Titus, Trane Technologies plc, TROX SE, Tuttle and Bailey and Warren Technology Inc.

Market Research Insights

  • The market's dynamics are increasingly shaped by the push for intelligent and efficient building operations. A VAV box retrofit solution can yield operational energy savings of up to 40% compared to constant volume systems, driving a robust replacement market. The focus on energy-efficient HVAC design is intensified by corporate sustainability goals and stricter building codes.
  • Smart VAV controller integration with occupancy sensors enables precise, demand-based airflow, reducing ventilation energy waste by over 50% in intermittently used spaces. As facility managers prioritize data-driven operations, systems offering seamless building management system compatibility and support for predictive HVAC maintenance are gaining a distinct competitive advantage, with such systems demonstrating a 15% reduction in unplanned service calls.

We can help! Our analysts can customize this variable air volume box market research report to meet your requirements.

Get in touch

1. Executive Summary

1.1 Market overview

Executive Summary - Chart on Market Overview
Executive Summary - Data Table on Market Overview
Executive Summary - Chart on Global Market Characteristics
Executive Summary - Chart on Market by Geography
Executive Summary - Chart on Market Segmentation by Type
Executive Summary - Chart on Market Segmentation by Application
Executive Summary - Chart on Market Segmentation by End-user
Executive Summary - Chart on Incremental Growth
Executive Summary - Data Table on Incremental Growth
Executive Summary - Chart on Company Market Positioning

2. Technavio Analysis

2.1 Analysis of price sensitivity, lifecycle, customer purchase basket, adoption rates, and purchase criteria

2.2 Criticality of inputs and Factors of differentiation

Chart on Overview on criticality of inputs and factors of differentiation

2.3 Factors of disruption

Chart on Overview on factors of disruption

2.4 Impact of drivers and challenges

Chart on Impact of drivers and challenges in 2025 and 2030

3. Market Landscape

3.1 Market ecosystem

Chart on Parent Market
Data Table on - Parent Market

3.2 Market characteristics

Chart on Market characteristics analysis

3.3 Value chain analysis

Chart on Value chain analysis

4. Market Sizing

4.1 Market definition

Data Table on Offerings of companies included in the market definition

4.2 Market segment analysis

Market segments

4.3 Market size 2025

4.4 Market outlook: Forecast for 2025-2030

Chart on Global - Market size and forecast 2025-2030 ($ million)
Data Table on Global - Market size and forecast 2025-2030 ($ million)
Chart on Global Market: Year-over-year growth 2025-2030 (%)
Data Table on Global Market: Year-over-year growth 2025-2030 (%)

5. Historic Market Size

5.1 Global Variable Air Volume Box Market 2020 - 2024

Historic Market Size - Data Table on Global Variable Air Volume Box Market 2020 - 2024 ($ million)

5.2 Type segment analysis 2020 - 2024

Historic Market Size - Type Segment 2020 - 2024 ($ million)

5.3 Application segment analysis 2020 - 2024

Historic Market Size - Application Segment 2020 - 2024 ($ million)

5.4 End-user segment analysis 2020 - 2024

Historic Market Size - End-user Segment 2020 - 2024 ($ million)

5.5 Geography segment analysis 2020 - 2024

Historic Market Size - Geography Segment 2020 - 2024 ($ million)

5.6 Country segment analysis 2020 - 2024

Historic Market Size - Country Segment 2020 - 2024 ($ million)

6. Qualitative Analysis

6.1 Impact of AI on the Global Variable Air Volume Box Market

7. Five Forces Analysis

7.1 Five forces summary

Five forces analysis - Comparison between 2025 and 2030

7.2 Bargaining power of buyers

Bargaining power of buyers - Impact of key factors 2025 and 2030

7.3 Bargaining power of suppliers

Bargaining power of suppliers - Impact of key factors in 2025 and 2030

7.4 Threat of new entrants

Threat of new entrants - Impact of key factors in 2025 and 2030

7.5 Threat of substitutes

Threat of substitutes - Impact of key factors in 2025 and 2030

7.6 Threat of rivalry

Threat of rivalry - Impact of key factors in 2025 and 2030

7.7 Market condition

Chart on Market condition - Five forces 2025 and 2030

8. Market Segmentation by Type

8.1 Market segments

Chart on Type - Market share 2025-2030 (%)
Data Table on Type - Market share 2025-2030 (%)

8.2 Comparison by Type

Chart on Comparison by Type
Data Table on Comparison by Type

8.3 Single-duct VAV - Market size and forecast 2025-2030

Chart on Single-duct VAV - Market size and forecast 2025-2030 ($ million)
Data Table on Single-duct VAV - Market size and forecast 2025-2030 ($ million)
Chart on Single-duct VAV - Year-over-year growth 2025-2030 (%)
Data Table on Single-duct VAV - Year-over-year growth 2025-2030 (%)

8.4 Fan-powered VAV - Market size and forecast 2025-2030

Chart on Fan-powered VAV - Market size and forecast 2025-2030 ($ million)
Data Table on Fan-powered VAV - Market size and forecast 2025-2030 ($ million)
Chart on Fan-powered VAV - Year-over-year growth 2025-2030 (%)
Data Table on Fan-powered VAV - Year-over-year growth 2025-2030 (%)

8.5 Dual-duct VAV - Market size and forecast 2025-2030

Chart on Dual-duct VAV - Market size and forecast 2025-2030 ($ million)
Data Table on Dual-duct VAV - Market size and forecast 2025-2030 ($ million)
Chart on Dual-duct VAV - Year-over-year growth 2025-2030 (%)
Data Table on Dual-duct VAV - Year-over-year growth 2025-2030 (%)

8.6 Induction VAV - Market size and forecast 2025-2030

Chart on Induction VAV - Market size and forecast 2025-2030 ($ million)
Data Table on Induction VAV - Market size and forecast 2025-2030 ($ million)
Chart on Induction VAV - Year-over-year growth 2025-2030 (%)
Data Table on Induction VAV - Year-over-year growth 2025-2030 (%)

8.7 Market opportunity by Type

Market opportunity by Type ($ million)
Data Table on Market opportunity by Type ($ million)

9. Market Segmentation by Application

9.1 Market segments

Chart on Application - Market share 2025-2030 (%)
Data Table on Application - Market share 2025-2030 (%)

9.2 Comparison by Application

Chart on Comparison by Application
Data Table on Comparison by Application

9.3 Commercial buildings - Market size and forecast 2025-2030

Chart on Commercial buildings - Market size and forecast 2025-2030 ($ million)
Data Table on Commercial buildings - Market size and forecast 2025-2030 ($ million)
Chart on Commercial buildings - Year-over-year growth 2025-2030 (%)
Data Table on Commercial buildings - Year-over-year growth 2025-2030 (%)

9.4 Industrial buildings - Market size and forecast 2025-2030

Chart on Industrial buildings - Market size and forecast 2025-2030 ($ million)
Data Table on Industrial buildings - Market size and forecast 2025-2030 ($ million)
Chart on Industrial buildings - Year-over-year growth 2025-2030 (%)
Data Table on Industrial buildings - Year-over-year growth 2025-2030 (%)

9.5 Residential buildings - Market size and forecast 2025-2030

Chart on Residential buildings - Market size and forecast 2025-2030 ($ million)
Data Table on Residential buildings - Market size and forecast 2025-2030 ($ million)
Chart on Residential buildings - Year-over-year growth 2025-2030 (%)
Data Table on Residential buildings - Year-over-year growth 2025-2030 (%)

9.6 Market opportunity by Application

Market opportunity by Application ($ million)
Data Table on Market opportunity by Application ($ million)

10. Market Segmentation by End-user

10.1 Market segments

Chart on End-user - Market share 2025-2030 (%)
Data Table on End-user - Market share 2025-2030 (%)

10.2 Comparison by End-user

Chart on Comparison by End-user
Data Table on Comparison by End-user

10.3 New installation - Market size and forecast 2025-2030

Chart on New installation - Market size and forecast 2025-2030 ($ million)
Data Table on New installation - Market size and forecast 2025-2030 ($ million)
Chart on New installation - Year-over-year growth 2025-2030 (%)
Data Table on New installation - Year-over-year growth 2025-2030 (%)

10.4 Replacement - Market size and forecast 2025-2030

Chart on Replacement - Market size and forecast 2025-2030 ($ million)
Data Table on Replacement - Market size and forecast 2025-2030 ($ million)
Chart on Replacement - Year-over-year growth 2025-2030 (%)
Data Table on Replacement - Year-over-year growth 2025-2030 (%)

10.5 Market opportunity by End-user

Market opportunity by End-user ($ million)
Data Table on Market opportunity by End-user ($ million)

11. Customer Landscape

11.1 Customer landscape overview

Analysis of price sensitivity, lifecycle, customer purchase basket, adoption rates, and purchase criteria

12. Geographic Landscape

12.1 Geographic segmentation

Chart on Market share by geography 2025-2030 (%)
Data Table on Market share by geography 2025-2030 (%)

12.2 Geographic comparison

Chart on Geographic comparison
Data Table on Geographic comparison

12.3 APAC - Market size and forecast 2025-2030

Chart on APAC - Market size and forecast 2025-2030 ($ million)
Data Table on APAC - Market size and forecast 2025-2030 ($ million)
Chart on APAC - Year-over-year growth 2025-2030 (%)
Data Table on APAC - Year-over-year growth 2025-2030 (%)
Chart on Regional Comparison - APAC
Data Table on Regional Comparison - APAC

12.3.1 China - Market size and forecast 2025-2030

Chart on China - Market size and forecast 2025-2030 ($ million)
Data Table on China - Market size and forecast 2025-2030 ($ million)
Chart on China - Year-over-year growth 2025-2030 (%)
Data Table on China - Year-over-year growth 2025-2030 (%)

12.3.2 Japan - Market size and forecast 2025-2030

Chart on Japan - Market size and forecast 2025-2030 ($ million)
Data Table on Japan - Market size and forecast 2025-2030 ($ million)
Chart on Japan - Year-over-year growth 2025-2030 (%)
Data Table on Japan - Year-over-year growth 2025-2030 (%)

12.3.3 India - Market size and forecast 2025-2030

Chart on India - Market size and forecast 2025-2030 ($ million)
Data Table on India - Market size and forecast 2025-2030 ($ million)
Chart on India - Year-over-year growth 2025-2030 (%)
Data Table on India - Year-over-year growth 2025-2030 (%)

12.3.4 South Korea - Market size and forecast 2025-2030

Chart on South Korea - Market size and forecast 2025-2030 ($ million)
Data Table on South Korea - Market size and forecast 2025-2030 ($ million)
Chart on South Korea - Year-over-year growth 2025-2030 (%)
Data Table on South Korea - Year-over-year growth 2025-2030 (%)

12.3.5 Australia - Market size and forecast 2025-2030

Chart on Australia - Market size and forecast 2025-2030 ($ million)
Data Table on Australia - Market size and forecast 2025-2030 ($ million)
Chart on Australia - Year-over-year growth 2025-2030 (%)
Data Table on Australia - Year-over-year growth 2025-2030 (%)

12.3.6 Indonesia - Market size and forecast 2025-2030

Chart on Indonesia - Market size and forecast 2025-2030 ($ million)
Data Table on Indonesia - Market size and forecast 2025-2030 ($ million)
Chart on Indonesia - Year-over-year growth 2025-2030 (%)
Data Table on Indonesia - Year-over-year growth 2025-2030 (%)

12.4 North America - Market size and forecast 2025-2030

Chart on North America - Market size and forecast 2025-2030 ($ million)
Data Table on North America - Market size and forecast 2025-2030 ($ million)
Chart on North America - Year-over-year growth 2025-2030 (%)
Data Table on North America - Year-over-year growth 2025-2030 (%)
Chart on Regional Comparison - North America
Data Table on Regional Comparison - North America

12.4.1 US - Market size and forecast 2025-2030

Chart on US - Market size and forecast 2025-2030 ($ million)
Data Table on US - Market size and forecast 2025-2030 ($ million)
Chart on US - Year-over-year growth 2025-2030 (%)
Data Table on US - Year-over-year growth 2025-2030 (%)

12.4.2 Canada - Market size and forecast 2025-2030

Chart on Canada - Market size and forecast 2025-2030 ($ million)
Data Table on Canada - Market size and forecast 2025-2030 ($ million)
Chart on Canada - Year-over-year growth 2025-2030 (%)
Data Table on Canada - Year-over-year growth 2025-2030 (%)

12.4.3 Mexico - Market size and forecast 2025-2030

Chart on Mexico - Market size and forecast 2025-2030 ($ million)
Data Table on Mexico - Market size and forecast 2025-2030 ($ million)
Chart on Mexico - Year-over-year growth 2025-2030 (%)
Data Table on Mexico - Year-over-year growth 2025-2030 (%)

12.5 Europe - Market size and forecast 2025-2030

Chart on Europe - Market size and forecast 2025-2030 ($ million)
Data Table on Europe - Market size and forecast 2025-2030 ($ million)
Chart on Europe - Year-over-year growth 2025-2030 (%)
Data Table on Europe - Year-over-year growth 2025-2030 (%)
Chart on Regional Comparison - Europe
Data Table on Regional Comparison - Europe

12.5.1 Germany - Market size and forecast 2025-2030

Chart on Germany - Market size and forecast 2025-2030 ($ million)
Data Table on Germany - Market size and forecast 2025-2030 ($ million)
Chart on Germany - Year-over-year growth 2025-2030 (%)
Data Table on Germany - Year-over-year growth 2025-2030 (%)

12.5.2 UK - Market size and forecast 2025-2030

Chart on UK - Market size and forecast 2025-2030 ($ million)
Data Table on UK - Market size and forecast 2025-2030 ($ million)
Chart on UK - Year-over-year growth 2025-2030 (%)
Data Table on UK - Year-over-year growth 2025-2030 (%)

12.5.3 France - Market size and forecast 2025-2030

Chart on France - Market size and forecast 2025-2030 ($ million)
Data Table on France - Market size and forecast 2025-2030 ($ million)
Chart on France - Year-over-year growth 2025-2030 (%)
Data Table on France - Year-over-year growth 2025-2030 (%)

12.5.4 Italy - Market size and forecast 2025-2030

Chart on Italy - Market size and forecast 2025-2030 ($ million)
Data Table on Italy - Market size and forecast 2025-2030 ($ million)
Chart on Italy - Year-over-year growth 2025-2030 (%)
Data Table on Italy - Year-over-year growth 2025-2030 (%)

12.5.5 Spain - Market size and forecast 2025-2030

Chart on Spain - Market size and forecast 2025-2030 ($ million)
Data Table on Spain - Market size and forecast 2025-2030 ($ million)
Chart on Spain - Year-over-year growth 2025-2030 (%)
Data Table on Spain - Year-over-year growth 2025-2030 (%)

12.5.6 The Netherlands - Market size and forecast 2025-2030

Chart on The Netherlands - Market size and forecast 2025-2030 ($ million)
Data Table on The Netherlands - Market size and forecast 2025-2030 ($ million)
Chart on The Netherlands - Year-over-year growth 2025-2030 (%)
Data Table on The Netherlands - Year-over-year growth 2025-2030 (%)

12.6 Middle East and Africa - Market size and forecast 2025-2030

Chart on Middle East and Africa - Market size and forecast 2025-2030 ($ million)
Data Table on Middle East and Africa - Market size and forecast 2025-2030 ($ million)
Chart on Middle East and Africa - Year-over-year growth 2025-2030 (%)
Data Table on Middle East and Africa - Year-over-year growth 2025-2030 (%)
Chart on Regional Comparison - Middle East and Africa
Data Table on Regional Comparison - Middle East and Africa

12.6.1 Saudi Arabia - Market size and forecast 2025-2030

Chart on Saudi Arabia - Market size and forecast 2025-2030 ($ million)
Data Table on Saudi Arabia - Market size and forecast 2025-2030 ($ million)
Chart on Saudi Arabia - Year-over-year growth 2025-2030 (%)
Data Table on Saudi Arabia - Year-over-year growth 2025-2030 (%)

12.6.2 UAE - Market size and forecast 2025-2030

Chart on UAE - Market size and forecast 2025-2030 ($ million)
Data Table on UAE - Market size and forecast 2025-2030 ($ million)
Chart on UAE - Year-over-year growth 2025-2030 (%)
Data Table on UAE - Year-over-year growth 2025-2030 (%)

12.6.3 South Africa - Market size and forecast 2025-2030

Chart on South Africa - Market size and forecast 2025-2030 ($ million)
Data Table on South Africa - Market size and forecast 2025-2030 ($ million)
Chart on South Africa - Year-over-year growth 2025-2030 (%)
Data Table on South Africa - Year-over-year growth 2025-2030 (%)

12.6.4 Israel - Market size and forecast 2025-2030

Chart on Israel - Market size and forecast 2025-2030 ($ million)
Data Table on Israel - Market size and forecast 2025-2030 ($ million)
Chart on Israel - Year-over-year growth 2025-2030 (%)
Data Table on Israel - Year-over-year growth 2025-2030 (%)

12.6.5 Turkey - Market size and forecast 2025-2030

Chart on Turkey - Market size and forecast 2025-2030 ($ million)
Data Table on Turkey - Market size and forecast 2025-2030 ($ million)
Chart on Turkey - Year-over-year growth 2025-2030 (%)
Data Table on Turkey - Year-over-year growth 2025-2030 (%)

12.7 South America - Market size and forecast 2025-2030

Chart on South America - Market size and forecast 2025-2030 ($ million)
Data Table on South America - Market size and forecast 2025-2030 ($ million)
Chart on South America - Year-over-year growth 2025-2030 (%)
Data Table on South America - Year-over-year growth 2025-2030 (%)
Chart on Regional Comparison - South America
Data Table on Regional Comparison - South America

12.7.1 Brazil - Market size and forecast 2025-2030

Chart on Brazil - Market size and forecast 2025-2030 ($ million)
Data Table on Brazil - Market size and forecast 2025-2030 ($ million)
Chart on Brazil - Year-over-year growth 2025-2030 (%)
Data Table on Brazil - Year-over-year growth 2025-2030 (%)

12.7.2 Argentina - Market size and forecast 2025-2030

Chart on Argentina - Market size and forecast 2025-2030 ($ million)
Data Table on Argentina - Market size and forecast 2025-2030 ($ million)
Chart on Argentina - Year-over-year growth 2025-2030 (%)
Data Table on Argentina - Year-over-year growth 2025-2030 (%)

12.7.3 Colombia - Market size and forecast 2025-2030

Chart on Colombia - Market size and forecast 2025-2030 ($ million)
Data Table on Colombia - Market size and forecast 2025-2030 ($ million)
Chart on Colombia - Year-over-year growth 2025-2030 (%)
Data Table on Colombia - Year-over-year growth 2025-2030 (%)

12.8 Market opportunity by geography

Market opportunity by geography ($ million)
Data Tables on Market opportunity by geography ($ million)

13. Drivers, Challenges, and Opportunity

13.1 Market drivers

Escalating demand for energy efficiency and sustainability in building operations
Rapid urbanization and expansion of commercial infrastructure in emerging markets
Technological advancements in building automation and smart controls

13.2 Market challenges

High initial capital expenditure and complex installation requirements
Operational maintenance and calibration difficulties
Acoustic performance issues and noise generation

13.3 Impact of drivers and challenges

Impact of drivers and challenges in 2025 and 2030

13.4 Market opportunities

Integration of IoT and advanced analytics in VAV systems
Heightened focus on indoor environmental quality and acoustics
Surge in retrofit and modernization of aging HVAC infrastructure

14. Competitive Landscape

14.1 Overview

14.2

Overview on criticality of inputs and factors of differentiation

14.3 Landscape disruption

Overview on factors of disruption

14.4 Industry risks

Impact of key risks on business

15. Competitive Analysis

15.1 Companies profiled

Companies covered

15.2 Company ranking index

15.3 Market positioning of companies

Matrix on companies position and classification

15.4 Aldes Group Export

Aldes Group Export - Overview
Aldes Group Export - Product / Service
Aldes Group Export - Key offerings
SWOT

15.5 Anemostat, Inc.

Anemostat, Inc. - Overview
Anemostat, Inc. - Product / Service
Anemostat, Inc. - Key offerings
SWOT

15.6 Carrier Global Corp.

Carrier Global Corp. - Overview
Carrier Global Corp. - Business segments
Carrier Global Corp. - Key news
Carrier Global Corp. - Key offerings
Carrier Global Corp. - Segment focus
SWOT

15.7 Daikin Industries Ltd.

Daikin Industries Ltd. - Overview
Daikin Industries Ltd. - Business segments
Daikin Industries Ltd. - Key news
Daikin Industries Ltd. - Key offerings
Daikin Industries Ltd. - Segment focus
SWOT

15.8 FlaktGroup Holding GmbH

FlaktGroup Holding GmbH - Overview
FlaktGroup Holding GmbH - Product / Service
FlaktGroup Holding GmbH - Key offerings
SWOT

15.9 Johnson Controls International

Johnson Controls International - Overview
Johnson Controls International - Business segments
Johnson Controls International - Key news
Johnson Controls International - Key offerings
Johnson Controls International - Segment focus
SWOT

15.10 Lindab AB

Lindab AB - Overview
Lindab AB - Business segments
Lindab AB - Key offerings
Lindab AB - Segment focus
SWOT

15.11 Metalaire

Metalaire - Overview
Metalaire - Product / Service
Metalaire - Key offerings
SWOT

15.12 Pari Infrastructure Ltd.

Pari Infrastructure Ltd. - Overview
Pari Infrastructure Ltd. - Product / Service
Pari Infrastructure Ltd. - Key offerings
SWOT

15.13 Swegon Group AB

Swegon Group AB - Overview
Swegon Group AB - Product / Service
Swegon Group AB - Key offerings
SWOT

15.14 Titus

Titus - Overview
Titus - Product / Service
Titus - Key offerings
SWOT

15.15 Trane Technologies plc

Trane Technologies plc - Overview
Trane Technologies plc - Business segments
Trane Technologies plc - Key news
Trane Technologies plc - Key offerings
Trane Technologies plc - Segment focus
SWOT

15.16 TROX SE

TROX SE - Overview
TROX SE - Product / Service
TROX SE - Key offerings
SWOT

15.17 Tuttle and Bailey

Tuttle and Bailey - Overview
Tuttle and Bailey - Product / Service
Tuttle and Bailey - Key offerings
SWOT

15.18 Warren Technology Inc.

Warren Technology Inc. - Overview
Warren Technology Inc. - Product / Service
Warren Technology Inc. - Key offerings
SWOT

16. Appendix

16.1 Scope of the report

Market definition
Objectives
Notes and caveats

16.2 Inclusions and exclusions checklist

Inclusions checklist
Exclusions checklist

16.3 Currency conversion rates for US$

16.4 Research methodology

16.5 Data procurement

Information sources

16.6 Data validation

16.7 Validation techniques employed for market sizing

16.8 Data synthesis

16.9 360 degree market analysis

16.10 List of abbreviations

Research Methodology

Technavio presents a detailed picture of the market by way of study, synthesis, and summation of data from multiple sources. The analysts have presented the various facets of the market with a particular focus on identifying the key industry influencers. The data thus presented is comprehensive, reliable, and the result of extensive research, both primary and secondary.

INFORMATION SOURCES

Primary sources

  • Manufacturers and suppliers
  • Channel partners
  • Industry experts
  • Strategic decision makers

Secondary sources

  • Industry journals and periodicals
  • Government data
  • Financial reports of key industry players
  • Historical data
  • Press releases

DATA ANALYSIS

Data Synthesis

  • Collation of data
  • Estimation of key figures
  • Analysis of derived insights

Data Validation

  • Triangulation with data models
  • Reference against proprietary databases
  • Corroboration with industry experts

REPORT WRITING

Qualitative

  • Market drivers
  • Market challenges
  • Market trends
  • Five forces analysis

Quantitative

  • Market size and forecast
  • Market segmentation
  • Geographical insights
  • Competitive landscape

Interested in this report?

Get your sample now to see our research methodology and insights!

Download Now

Frequently Asked Questions

Variable Air Volume Box market growth will increase by USD 2044.5 million during 2026-2030 .

The Variable Air Volume Box market is expected to grow at a CAGR of 6.7% during 2026-2030 .

Variable Air Volume Box market is segmented by Type (Single-duct VAV, Fan-powered VAV, Dual-duct VAV, Induction VAV) Application (Commercial buildings, Industrial buildings, Residential buildings) End-user (New installation, Replacement)

Air Master, Aldes Group Export, Anemostat, Inc., Barcol Air, Carrier Global Corp., Daikin Industries Ltd., FlaktGroup Holding GmbH, Johnson Controls International, Lindab AB, Metalaire, Nailor Industries Inc., Pari Infrastructure Ltd., SRP Automation Pvt. Ltd., Swegon Group AB, Titus, Trane Technologies plc, TROX SE, Tuttle and Bailey, Warren Technology Inc. are a few of the key vendors in the Variable Air Volume Box market.

APAC will register the highest growth rate of 42.1% among the other regions. Therefore, the Variable Air Volume Box market in APAC is expected to garner significant business opportunities for the vendors during the forecast period.

China, Japan, India, South Korea, Australia, Indonesia, US, Canada, Mexico, Germany, UK, France, Italy, Spain, The Netherlands, Saudi Arabia, UAE, South Africa, Israel, Turkey, Brazil, Argentina, Colombia

  • Escalating demand for energy efficiency and sustainability in building operations is the driving factor this market.

The Variable Air Volume Box market vendors should focus on grabbing business opportunities from the Type segment as it accounted for the largest market share in the base year.