Vending Machine Market Analysis, Size, and Forecast 2026-2030: North America (US, Canada, and Mexico), Europe (Germany, Italy, and UK), APAC (Japan, China, and South Korea), South America (Brazil and Argentina), Middle East and Africa (Saudi Arabia, UAE, and South Africa), and Rest of World (ROW)

Vending Machine Market Analysis, Size, and Forecast 2026-2030:
North America (US, Canada, and Mexico), Europe (Germany, Italy, and UK), APAC (Japan, China, and South Korea), South America (Brazil and Argentina), Middle East and Africa (Saudi Arabia, UAE, and South Africa), and Rest of World (ROW)

Published: May 2026 328 Pages SKU: IRTNTR43707

Market Overview at a Glance

$32.50 B
Market Opportunity
24.3%
CAGR 2025 - 2030
39.2%
North America Growth
$9.54 B
Offline segment 2024

Vending Machine Market Size 2026-2030

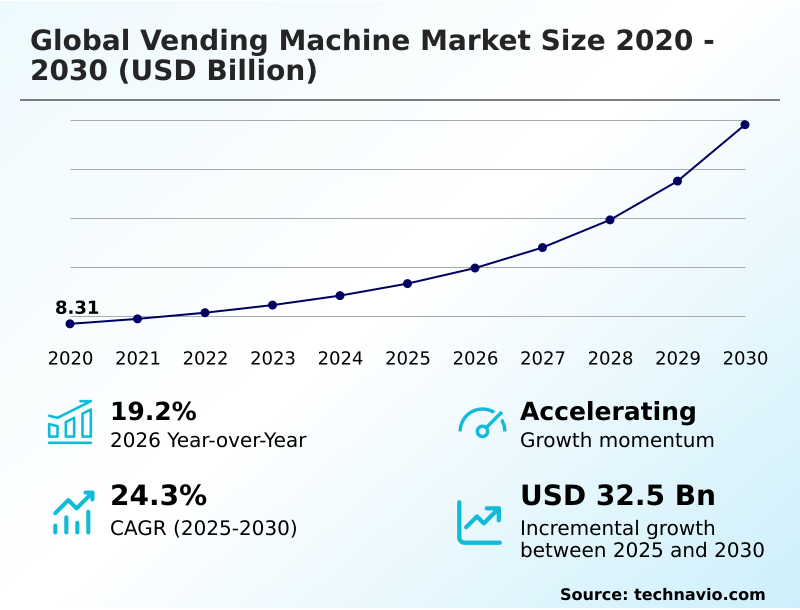
The vending machine market size is valued to increase by USD 32.50 billion, at a CAGR of 24.3% from 2025 to 2030. Technological integration and proliferation of smart vending solutions will drive the vending machine market.

Major Market Trends & Insights

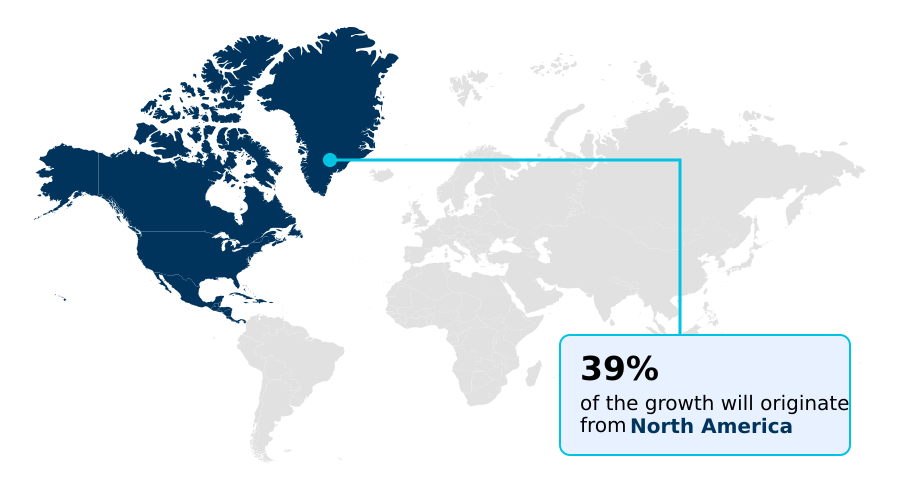
  • North America dominated the market and accounted for a 39.2% growth during the forecast period.
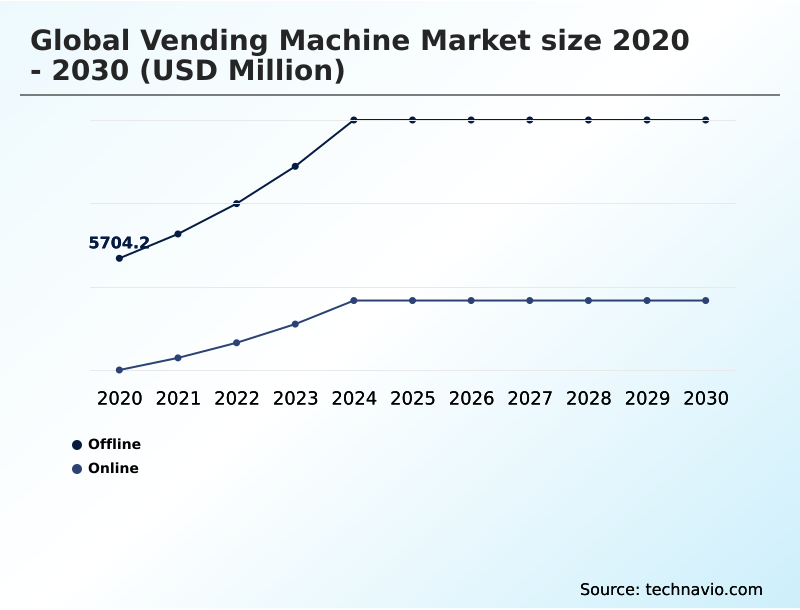
  • By Distribution Channel - Offline segment was valued at USD 9.54 billion in 2024
  • By Product - Intelligent vending machines segment accounted for the largest market revenue share in 2024

Market Size & Forecast

  • Market Opportunities: USD 40.73 billion
  • Market Future Opportunities: USD 32.50 billion
  • CAGR from 2025 to 2030 : 24.3%

Market Summary

  • The Vending Machine Market is undergoing a significant technological shift, moving from basic dispensers to intelligent, connected retail ecosystems. This evolution is propelled by the integration of AI and IoT, which facilitate real-time inventory management, predictive maintenance, and dynamic product assortment based on consumer data.
  • The adoption of cashless and contactless payment systems has become standard, enhancing user convenience and providing operators with valuable transaction data. In a typical business scenario, an operator of fresh food vending machines can leverage cloud-based inventory data to optimize restocking routes, reducing fuel consumption and labor costs by over 20% while ensuring product freshness and minimizing waste.
  • Trends such as the demand for healthy and fresh food options, hyper-personalization through AI analytics, and the rise of sustainable, energy-efficient hardware are reshaping the industry. However, the high initial capital investment for smart machines and the complexities of navigating diverse international regulations on food safety and digital payments remain notable challenges for operators.

What will be the Size of the Vending Machine Market during the forecast period?

Get Key Insights on Market Forecast (PDF) Get Free Sample

How is the Vending Machine Market Segmented?

The vending machine industry research report provides comprehensive data (region-wise segment analysis), with forecasts and estimates in "USD million" for the period 2026-2030, as well as historical data from 2020-2024 for the following segments.

  • Distribution channel
    • Offline
    • Online
  • Product
    • Intelligent vending machines
    • Low end vending machines
  • Type
    • Food and beverages vending machine
    • Fresh food vending machine
    • Non-food items vending machine
    • Ice-cream vending machine
  • Application
    • Hotels and restaurants
    • Corporate offices and institutions
    • Public places
    • Retail stores
  • Method
    • Cash-based vending machine
    • Cashless-based vending machine
  • Geography
    • North America
      • US
      • Canada
      • Mexico
    • Europe
      • Germany
      • Italy
      • UK
    • APAC
      • Japan
      • China
      • South Korea
    • South America
      • Brazil
      • Argentina
    • Middle East and Africa
      • Saudi Arabia
      • UAE
      • South Africa
    • Rest of World (ROW)

By Distribution Channel Insights

The offline segment is estimated to witness significant growth during the forecast period.

The Vending Machine Market's offline channel remains the core of its distribution model, defined by the physical placement and operation of automated retail kiosks in high-traffic commercial and public spaces.

This segment has evolved beyond simple hardware deployment; it now relies on sophisticated location-based analytics to optimize placement in areas with high footfall, maximizing transaction frequency.

The integration of next-generation automated systems, including solar-powered vending units and hot beverage vending, showcases the channel's adaptability. Operators increasingly leverage telemetry for dynamic restocking, with some achieving a 15% improvement in route efficiency.

This physical presence provides immediate consumer gratification, anchoring the industry with tangible and reliable points of sale, from specialized retail kiosks to expansive automated service delivery networks.

Get Free Sample

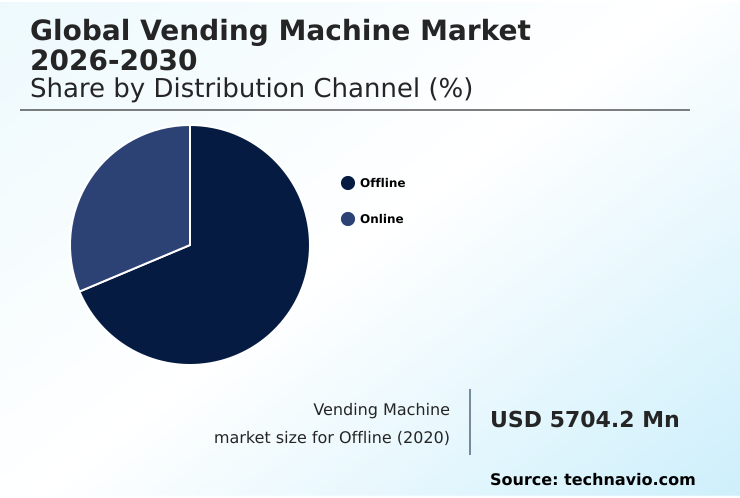
The Offline segment was valued at USD 9.54 billion in 2024 and showed a gradual increase during the forecast period.

Get Free Sample

Regional Analysis

North America is estimated to contribute 39.2% to the growth of the global market during the forecast period.Technavio’s analysts have elaborately explained the regional trends and drivers that shape the market during the forecast period.

See How Vending Machine Market Demand is Rising in North America Get Free Sample

The geographic landscape is increasingly defined by technological adoption rates and urbanization. Regions with advanced smart city fabric, particularly in APAC and North America, are leading the deployment of machines with facial recognition payments and integration into digital payment ecosystems.

These areas foster an unmanned retail ecosystem, where autonomous mobile retail and high-tech dispensing systems provide on-the-go convenience. In Europe, the focus on sustainability has popularized automated food-wall concepts.

The market in North America contributes over 39% of the incremental growth, driven by demand for fresh food vending and modern automated retail.

In contrast, emerging markets in South America and the Middle East and Africa are prioritizing smart modernization to build out their automated self-service systems, creating a hybrid retail model that balances traditional and advanced solutions.

Market Dynamics

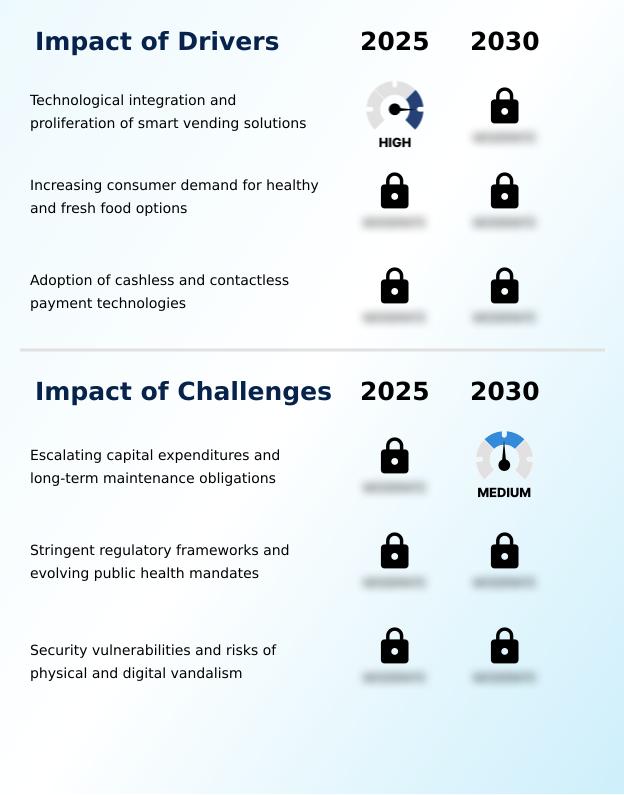
Our researchers analyzed the data with 2025 as the base year, along with the key drivers, trends, and challenges. A holistic analysis of drivers will help companies refine their marketing strategies to gain a competitive advantage.

  • Strategic planning in the Vending Machine Market requires a deep understanding of several critical long-tail factors. The impact of AI on vending machine profitability is a central theme, as operators weigh the benefits of dynamic pricing and predictive analytics against implementation costs.
  • This directly influences decisions regarding the ROI of smart vending machine upgrades, where hardware and software investments must be justified by measurable gains in efficiency and sales. For those entering the fresh food segment, understanding the challenges in fresh food vending machine logistics—including temperature control, spoilage rates, and supply chain integrity—is paramount.
  • Concurrently, the industry must address the security protocols for cashless vending systems to protect against data breaches and fraud, a factor that is now more critical to operational continuity than traditional physical security in many markets. The consumer adoption rates of biometric payment vending are closely monitored, as this technology promises ultimate convenience but faces privacy hurdles.
  • Finally, analyzing the sustainability impact of reverse vending machine networks is essential for corporate ESG alignment, with some networks demonstrating recycling efficiency rates over 30% higher than conventional municipal programs, showcasing a clear operational and environmental advantage.

What are the key market drivers leading to the rise in the adoption of Vending Machine Industry?

  • The primary market driver is the technological integration and proliferation of smart vending solutions, which enhance operational efficiency and consumer engagement.

  • The market's growth is fundamentally propelled by the adoption of intelligent automated retail technologies that enhance both operational efficiency and customer engagement.
  • Core to this are systems leveraging cloud-based inventory management and real-time telemetry, which allow operators to achieve service uptimes of 99% through predictive maintenance alerts.
  • The user interface has become a key differentiator, with interactive touchscreens and AI-driven analytics creating personalized consumer interactions. The universal adoption of contactless payment technologies facilitates secure, frictionless transactions, a critical factor for modern consumers.
  • This technological suite supports the expansion of automated retail environments, transforming them into sophisticated data-driven consumer engagement platforms where automated retail technology underpins every transaction, from payment to the use of digital pick-up lockers.

What are the market trends shaping the Vending Machine Industry?

  • Hyper-personalization, driven by AI-powered consumer analytics and interactive interfaces, is a defining trend shaping the market. This approach enables dynamic and tailored retail experiences.

  • Key trends are reshaping the market, moving it toward highly interactive and specialized unattended retail. The rise of automated gourmet dining and the deployment of advanced thermal management systems are enabling the sale of high-quality, fresh-prepared meals.
  • In retail, the store-within-a-store concept is being realized through automated boutique units, which leverage computer vision for inventory tracking and to create unique consumer experiences. This push for retail automation is supported by sensor fusion technologies that gather rich environmental and user data. One company specializing in robotic vacuum-pick vending reduced product damage by 90% for fragile items.
  • Furthermore, sustainability initiatives are driving the adoption of reverse vending machines. These trends signal a shift toward advanced automated solutions that offer more than just convenience, creating hygienic, low-touch service points.

What challenges does the Vending Machine Industry face during its growth?

  • A key challenge impacting industry growth is the escalating capital expenditure required for advanced systems, coupled with their long-term maintenance obligations.

  • Significant challenges constrain market expansion, primarily centered on the high costs and complexities of modern systems. Operators face steep capital outlays for climate-controlled machines and advanced payment processing hardware. The integration of IoT sensors and AI-enabled cameras necessitates ongoing software licensing and data connectivity fees, with maintenance costs rising by 15% year-over-year for some high-tech fleets.
  • This financial pressure creates a high barrier to entry, particularly for firms looking to deploy industrial vending solutions or automated culinary offerings. Furthermore, securing high-value product dispensers against sophisticated digital threats requires continuous investment. These factors, combined with the push for sustainable vending and automated service delivery, complicate strategic planning and restrain the growth of unattended retail formats.

Exclusive Technavio Analysis on Customer Landscape

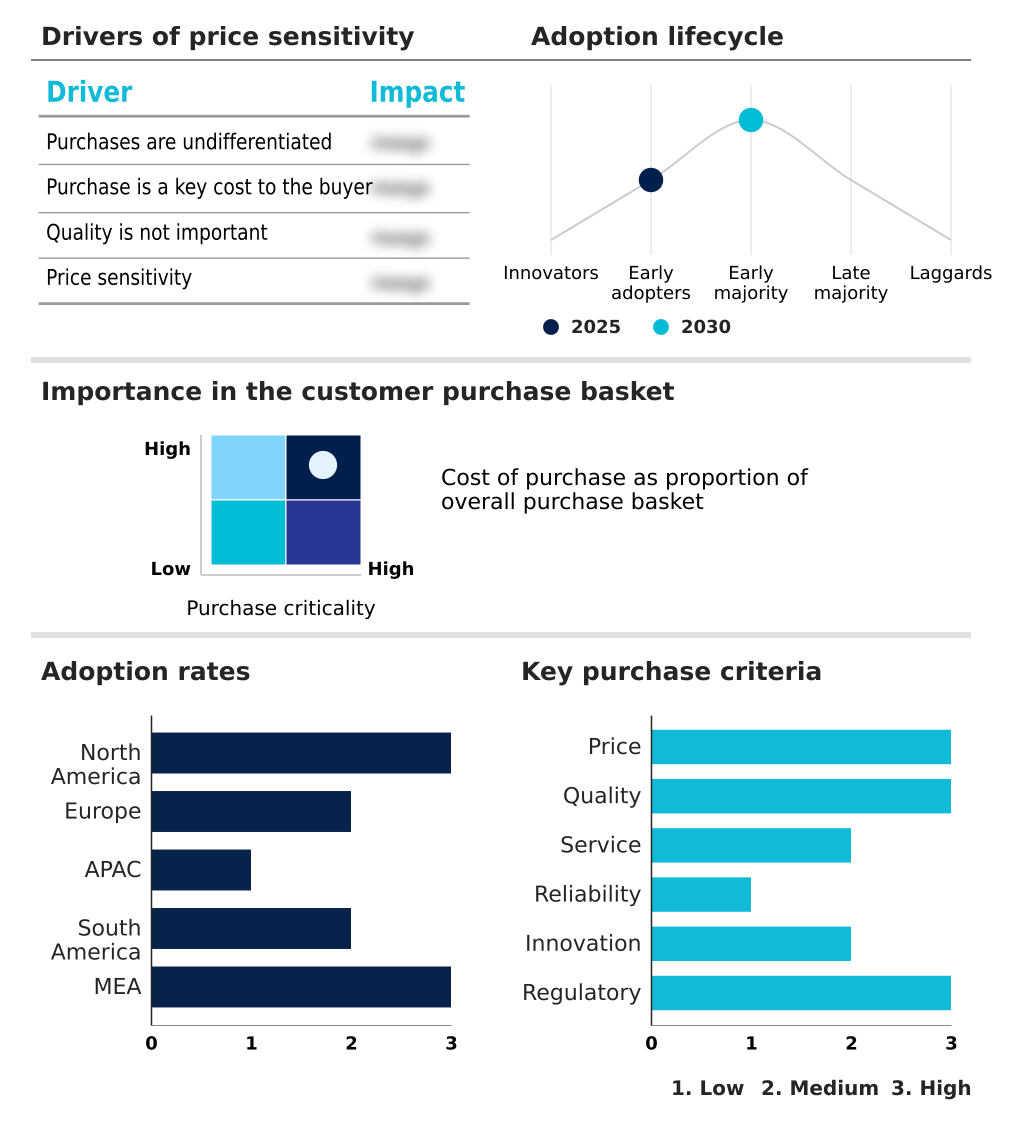
The vending machine market forecasting report includes the adoption lifecycle of the market, covering from the innovator’s stage to the laggard’s stage. It focuses on adoption rates in different regions based on penetration. Furthermore, the vending machine market report also includes key purchase criteria and drivers of price sensitivity to help companies evaluate and develop their market growth analysis strategies.

Customer Landscape of Vending Machine Industry

Competitive Landscape

Companies are implementing various strategies, such as strategic alliances, vending machine market forecast, partnerships, mergers and acquisitions, geographical expansion, and product/service launches, to enhance their presence in the industry.

Automated Merchandising Systems - Key offerings include diversified automated retail systems, from standard snack and beverage dispensers to advanced, climate-controlled units for fresh food and high-value goods, featuring integrated telemetry.

The industry research and growth report includes detailed analyses of the competitive landscape of the market and information about key companies, including:

  • Automated Merchandising Systems
  • Azkoyen SA
  • Bianchi Industry S.p.A.
  • Evoca S.p.A.
  • FAS International S.p.A.
  • Fastcorp Vending LLC
  • Federal Machine
  • Fuji Electric Co. Ltd.
  • Future Techniks Pvt. Ltd.
  • Jofemar S.A.
  • Magex S.r.l.
  • Rhea Vendors Group S.p.A.
  • Royal Vendors Inc.
  • SandenVendo Inc.
  • Seaga Manufacturing Inc.
  • Sielaff GmbH and Co. KG
  • TCN Vending Machine
  • V4 Vending Ltd.
  • Westomatic Vending Services Ltd.
  • XY Vending Machine Co. Ltd.

Qualitative and quantitative analysis of companies has been conducted to help clients understand the wider business environment as well as the strengths and weaknesses of key industry players. Data is qualitatively analyzed to categorize companies as pure play, category-focused, industry-focused, and diversified; it is quantitatively analyzed to categorize companies as dominant, leading, strong, tentative, and weak.

Recent Development and News in Vending machine market

  • In March, 2025, the Reserve Bank of India launched a pilot program for QR code-based coin vending machines, designed to improve the distribution of coins by allowing customers to use the Unified Payments Interface (UPI) for withdrawals.
  • In February, 2025, a major North American technology corporation implemented a campus-wide network of AI-integrated vending machines that utilize biometric authentication for seamless, cashless transactions, reflecting a growing trend in frictionless workplace commerce.
  • In April, 2025, a significant infrastructure project in East Asia introduced a fleet of hydrogen-powered vending machines at major metro stations as part of a broader commitment to adopting sustainable urban technologies.
  • In May, 2025, a global fashion retailer launched a series of automated boutique units in high-end shopping malls that use augmented reality mirrors, allowing customers to virtually try on accessories before making a purchase.

Dive into Technavio’s robust research methodology, blending expert interviews, extensive data synthesis, and validated models for unparalleled Vending Machine Market insights. See full methodology.

Market Scope
Page number 328
Base year 2025
Historic period 2020-2024
Forecast period 2026-2030
Growth momentum & CAGR Accelerate at a CAGR of 24.3%
Market growth 2026-2030 USD 32497.1 million
Market structure Fragmented
YoY growth 2025-2026(%) 19.2%
Key countries US, Canada, Mexico, Germany, Italy, UK, France, Spain, The Netherlands, Japan, China, South Korea, India, Australia, Indonesia, Brazil, Argentina, Chile, Saudi Arabia, UAE, South Africa, Turkey and Israel
Competitive landscape Leading Companies, Market Positioning of Companies, Competitive Strategies, and Industry Risks

Request Free Sample

Research Analyst Overview

  • The Vending Machine Market's evolution is driven by the convergence of advanced technologies that redefine automated retail. At the forefront are intelligent automated retail systems and automated retail kiosks, which leverage cloud-based inventory management, real-time telemetry, and predictive maintenance to enhance operational efficiency. The user experience is elevated through interactive touchscreens and sophisticated AI-driven analytics.
  • A key boardroom consideration is the investment in security, including biometric-linked payment systems, AI-enabled cameras, and advanced payment processing to safeguard transactions. The shift toward specialized hardware is evident, with climate-controlled machines for fresh food vending, robotic vacuum-pick vending for fragile items, and units for hot beverage vending becoming standard. Sustainability is addressed through solar-powered vending units and modular construction.
  • The market is diversifying with industrial vending solutions, automated boutique units, and automated gourmet dining concepts. In high-density urban areas, integration into digital payment ecosystems is critical, with some operators seeing a 25% uplift in transactions after adopting new contactless payment technologies.

What are the Key Data Covered in this Vending Machine Market Research and Growth Report?

  • What is the expected growth of the Vending Machine Market between 2026 and 2030?

    • USD 32.50 billion, at a CAGR of 24.3%

  • What segmentation does the market report cover?

    • The report is segmented by Distribution Channel (Offline, and Online), Product (Intelligent vending machines, and Low end vending machines), Type (Food and beverages vending machine, Fresh food vending machine, Non-food items vending machine, and Ice-cream vending machine), Application (Hotels and restaurants, Corporate offices and institutions, Public places, and Retail stores), Method (Cash-based vending machine, and Cashless-based vending machine) and Geography (North America, Europe, APAC, South America, Middle East and Africa)

  • Which regions are analyzed in the report?

    • North America, Europe, APAC, South America and Middle East and Africa

  • What are the key growth drivers and market challenges?

    • Technological integration and proliferation of smart vending solutions, Escalating capital expenditures and long-term maintenance obligations

  • Who are the major players in the Vending Machine Market?

    • Automated Merchandising Systems, Azkoyen SA, Bianchi Industry S.p.A., Evoca S.p.A., FAS International S.p.A., Fastcorp Vending LLC, Federal Machine, Fuji Electric Co. Ltd., Future Techniks Pvt. Ltd., Jofemar S.A., Magex S.r.l., Rhea Vendors Group S.p.A., Royal Vendors Inc., SandenVendo Inc., Seaga Manufacturing Inc., Sielaff GmbH and Co. KG, TCN Vending Machine, V4 Vending Ltd., Westomatic Vending Services Ltd. and XY Vending Machine Co. Ltd.

Market Research Insights

  • The market's momentum is defined by a pivot towards technologically advanced, unattended retail formats and automated retail innovations. These modern automated self-service systems create personalized consumer interactions, moving beyond simple transactions to data-driven consumer engagement. In high-traffic automated retail environments, operators report service uptime improvements nearing 99%, though maintenance costs for specialized high-value product dispensers have risen by 15% year-over-year.
  • The automated retail revolution is evident in the adoption of smart city fabric and the rise of hybrid retail models that integrate digital pick-up lockers. As the industry embraces this shift, even traditional retail is being reshaped by automated culinary offerings and high-tech retail interfaces, which support the demand for hygienic, low-touch service and on-the-go convenience.

We can help! Our analysts can customize this vending machine market research report to meet your requirements.

Get in touch

1. Executive Summary

1.1 Market overview

Executive Summary - Chart on Market Overview
Executive Summary - Data Table on Market Overview
Executive Summary - Chart on Global Market Characteristics
Executive Summary - Chart on Market by Geography
Executive Summary - Chart on Market Segmentation by Distribution Channel
Executive Summary - Chart on Market Segmentation by Product
Executive Summary - Chart on Market Segmentation by Type
Executive Summary - Chart on Market Segmentation by Application
Executive Summary - Chart on Market Segmentation by Method
Executive Summary - Chart on Incremental Growth
Executive Summary - Data Table on Incremental Growth
Executive Summary - Chart on Company Market Positioning

2. Technavio Analysis

2.1 Analysis of price sensitivity, lifecycle, customer purchase basket, adoption rates, and purchase criteria

2.2 Criticality of inputs and Factors of differentiation

Chart on Overview on criticality of inputs and factors of differentiation

2.3 Factors of disruption

Chart on Overview on factors of disruption

2.4 Impact of drivers and challenges

Chart on Impact of drivers and challenges in 2025 and 2030

3. Market Landscape

3.1 Market ecosystem

Chart on Parent Market
Data Table on - Parent Market

3.2 Market characteristics

Chart on Market characteristics analysis

3.3 Value chain analysis

Chart on Value chain analysis

4. Market Sizing

4.1 Market definition

Data Table on Offerings of companies included in the market definition

4.2 Market segment analysis

Market segments

4.3 Market size 2025

4.4 Market outlook: Forecast for 2025-2030

Chart on Global - Market size and forecast 2025-2030 ($ million)
Data Table on Global - Market size and forecast 2025-2030 ($ million)
Chart on Global Market: Year-over-year growth 2025-2030 (%)
Data Table on Global Market: Year-over-year growth 2025-2030 (%)

5. Historic Market Size

5.1 Global Vending Machine Market 2020 - 2024

Historic Market Size - Data Table on Global Vending Machine Market 2020 - 2024 ($ million)

5.2 Distribution Channel segment analysis 2020 - 2024

Historic Market Size - Distribution Channel Segment 2020 - 2024 ($ million)

5.3 Product segment analysis 2020 - 2024

Historic Market Size - Product Segment 2020 - 2024 ($ million)

5.4 Type segment analysis 2020 - 2024

Historic Market Size - Type Segment 2020 - 2024 ($ million)

5.5 Application segment analysis 2020 - 2024

Historic Market Size - Application Segment 2020 - 2024 ($ million)

5.6 Method segment analysis 2020 - 2024

Historic Market Size - Method Segment 2020 - 2024 ($ million)

5.7 Geography segment analysis 2020 - 2024

Historic Market Size - Geography Segment 2020 - 2024 ($ million)

5.8 Country segment analysis 2020 - 2024

Historic Market Size - Country Segment 2020 - 2024 ($ million)

6. Qualitative Analysis

6.1 Impact of AI in global vending machine market

6.2 Impact of geopolitical conflict on global vending machine market

7. Five Forces Analysis

7.1 Five forces summary

Five forces analysis - Comparison between 2025 and 2030

7.2 Bargaining power of buyers

Bargaining power of buyers - Impact of key factors 2025 and 2030

7.3 Bargaining power of suppliers

Bargaining power of suppliers - Impact of key factors in 2025 and 2030

7.4 Threat of new entrants

Threat of new entrants - Impact of key factors in 2025 and 2030

7.5 Threat of substitutes

Threat of substitutes - Impact of key factors in 2025 and 2030

7.6 Threat of rivalry

Threat of rivalry - Impact of key factors in 2025 and 2030

7.7 Market condition

Chart on Market condition - Five forces 2025 and 2030

8. Market Segmentation by Distribution Channel

8.1 Market segments

Chart on Distribution Channel - Market share 2025-2030 (%)
Data Table on Distribution Channel - Market share 2025-2030 (%)

8.2 Comparison by Distribution Channel

Chart on Comparison by Distribution Channel
Data Table on Comparison by Distribution Channel

8.3 Offline - Market size and forecast 2025-2030

Chart on Offline - Market size and forecast 2025-2030 ($ million)
Data Table on Offline - Market size and forecast 2025-2030 ($ million)
Chart on Offline - Year-over-year growth 2025-2030 (%)
Data Table on Offline - Year-over-year growth 2025-2030 (%)

8.4 Online - Market size and forecast 2025-2030

Chart on Online - Market size and forecast 2025-2030 ($ million)
Data Table on Online - Market size and forecast 2025-2030 ($ million)
Chart on Online - Year-over-year growth 2025-2030 (%)
Data Table on Online - Year-over-year growth 2025-2030 (%)

8.5 Market opportunity by Distribution Channel

Market opportunity by Distribution Channel ($ million)
Data Table on Market opportunity by Distribution Channel ($ million)

9. Market Segmentation by Product

9.1 Market segments

Chart on Product - Market share 2025-2030 (%)
Data Table on Product - Market share 2025-2030 (%)

9.2 Comparison by Product

Chart on Comparison by Product
Data Table on Comparison by Product

9.3 Intelligent vending machines - Market size and forecast 2025-2030

Chart on Intelligent vending machines - Market size and forecast 2025-2030 ($ million)
Data Table on Intelligent vending machines - Market size and forecast 2025-2030 ($ million)
Chart on Intelligent vending machines - Year-over-year growth 2025-2030 (%)
Data Table on Intelligent vending machines - Year-over-year growth 2025-2030 (%)

9.4 Low end vending machines - Market size and forecast 2025-2030

Chart on Low end vending machines - Market size and forecast 2025-2030 ($ million)
Data Table on Low end vending machines - Market size and forecast 2025-2030 ($ million)
Chart on Low end vending machines - Year-over-year growth 2025-2030 (%)
Data Table on Low end vending machines - Year-over-year growth 2025-2030 (%)

9.5 Market opportunity by Product

Market opportunity by Product ($ million)
Data Table on Market opportunity by Product ($ million)

10. Market Segmentation by Type

10.1 Market segments

Chart on Type - Market share 2025-2030 (%)
Data Table on Type - Market share 2025-2030 (%)

10.2 Comparison by Type

Chart on Comparison by Type
Data Table on Comparison by Type

10.3 Food and beverages vending machine - Market size and forecast 2025-2030

Chart on Food and beverages vending machine - Market size and forecast 2025-2030 ($ million)
Data Table on Food and beverages vending machine - Market size and forecast 2025-2030 ($ million)
Chart on Food and beverages vending machine - Year-over-year growth 2025-2030 (%)
Data Table on Food and beverages vending machine - Year-over-year growth 2025-2030 (%)

10.4 Fresh food vending machine - Market size and forecast 2025-2030

Chart on Fresh food vending machine - Market size and forecast 2025-2030 ($ million)
Data Table on Fresh food vending machine - Market size and forecast 2025-2030 ($ million)
Chart on Fresh food vending machine - Year-over-year growth 2025-2030 (%)
Data Table on Fresh food vending machine - Year-over-year growth 2025-2030 (%)

10.5 Non-food items vending machine - Market size and forecast 2025-2030

Chart on Non-food items vending machine - Market size and forecast 2025-2030 ($ million)
Data Table on Non-food items vending machine - Market size and forecast 2025-2030 ($ million)
Chart on Non-food items vending machine - Year-over-year growth 2025-2030 (%)
Data Table on Non-food items vending machine - Year-over-year growth 2025-2030 (%)

10.6 Ice-cream vending machine - Market size and forecast 2025-2030

Chart on Ice-cream vending machine - Market size and forecast 2025-2030 ($ million)
Data Table on Ice-cream vending machine - Market size and forecast 2025-2030 ($ million)
Chart on Ice-cream vending machine - Year-over-year growth 2025-2030 (%)
Data Table on Ice-cream vending machine - Year-over-year growth 2025-2030 (%)

10.7 Market opportunity by Type

Market opportunity by Type ($ million)
Data Table on Market opportunity by Type ($ million)

11. Market Segmentation by Application

11.1 Market segments

Chart on Application - Market share 2025-2030 (%)
Data Table on Application - Market share 2025-2030 (%)

11.2 Comparison by Application

Chart on Comparison by Application
Data Table on Comparison by Application

11.3 Hotels and restaurants - Market size and forecast 2025-2030

Chart on Hotels and restaurants - Market size and forecast 2025-2030 ($ million)
Data Table on Hotels and restaurants - Market size and forecast 2025-2030 ($ million)
Chart on Hotels and restaurants - Year-over-year growth 2025-2030 (%)
Data Table on Hotels and restaurants - Year-over-year growth 2025-2030 (%)

11.4 Corporate offices and institutions - Market size and forecast 2025-2030

Chart on Corporate offices and institutions - Market size and forecast 2025-2030 ($ million)
Data Table on Corporate offices and institutions - Market size and forecast 2025-2030 ($ million)
Chart on Corporate offices and institutions - Year-over-year growth 2025-2030 (%)
Data Table on Corporate offices and institutions - Year-over-year growth 2025-2030 (%)

11.5 Public places - Market size and forecast 2025-2030

Chart on Public places - Market size and forecast 2025-2030 ($ million)
Data Table on Public places - Market size and forecast 2025-2030 ($ million)
Chart on Public places - Year-over-year growth 2025-2030 (%)
Data Table on Public places - Year-over-year growth 2025-2030 (%)

11.6 Retail stores - Market size and forecast 2025-2030

Chart on Retail stores - Market size and forecast 2025-2030 ($ million)
Data Table on Retail stores - Market size and forecast 2025-2030 ($ million)
Chart on Retail stores - Year-over-year growth 2025-2030 (%)
Data Table on Retail stores - Year-over-year growth 2025-2030 (%)

11.7 Market opportunity by Application

Market opportunity by Application ($ million)
Data Table on Market opportunity by Application ($ million)

12. Market Segmentation by Method

12.1 Market segments

Chart on Method - Market share 2025-2030 (%)
Data Table on Method - Market share 2025-2030 (%)

12.2 Comparison by Method

Chart on Comparison by Method
Data Table on Comparison by Method

12.3 Cash-based vending machine - Market size and forecast 2025-2030

Chart on Cash-based vending machine - Market size and forecast 2025-2030 ($ million)
Data Table on Cash-based vending machine - Market size and forecast 2025-2030 ($ million)
Chart on Cash-based vending machine - Year-over-year growth 2025-2030 (%)
Data Table on Cash-based vending machine - Year-over-year growth 2025-2030 (%)

12.4 Cashless-based vending machine - Market size and forecast 2025-2030

Chart on Cashless-based vending machine - Market size and forecast 2025-2030 ($ million)
Data Table on Cashless-based vending machine - Market size and forecast 2025-2030 ($ million)
Chart on Cashless-based vending machine - Year-over-year growth 2025-2030 (%)
Data Table on Cashless-based vending machine - Year-over-year growth 2025-2030 (%)

12.5 Market opportunity by Method

Market opportunity by Method ($ million)
Data Table on Market opportunity by Method ($ million)

13. Customer Landscape

13.1 Customer landscape overview

Analysis of price sensitivity, lifecycle, customer purchase basket, adoption rates, and purchase criteria

14. Geographic Landscape

14.1 Geographic segmentation

Chart on Market share by geography 2025-2030 (%)
Data Table on Market share by geography 2025-2030 (%)

14.2 Geographic comparison

Chart on Geographic comparison
Data Table on Geographic comparison

14.3 North America - Market size and forecast 2025-2030

Chart on North America - Market size and forecast 2025-2030 ($ million)
Data Table on North America - Market size and forecast 2025-2030 ($ million)
Chart on North America - Year-over-year growth 2025-2030 (%)
Data Table on North America - Year-over-year growth 2025-2030 (%)
Chart on Regional Comparison - North America
Data Table on Regional Comparison - North America

14.3.1 US - Market size and forecast 2025-2030

Chart on US - Market size and forecast 2025-2030 ($ million)
Data Table on US - Market size and forecast 2025-2030 ($ million)
Chart on US - Year-over-year growth 2025-2030 (%)
Data Table on US - Year-over-year growth 2025-2030 (%)

14.3.2 Canada - Market size and forecast 2025-2030

Chart on Canada - Market size and forecast 2025-2030 ($ million)
Data Table on Canada - Market size and forecast 2025-2030 ($ million)
Chart on Canada - Year-over-year growth 2025-2030 (%)
Data Table on Canada - Year-over-year growth 2025-2030 (%)

14.3.3 Mexico - Market size and forecast 2025-2030

Chart on Mexico - Market size and forecast 2025-2030 ($ million)
Data Table on Mexico - Market size and forecast 2025-2030 ($ million)
Chart on Mexico - Year-over-year growth 2025-2030 (%)
Data Table on Mexico - Year-over-year growth 2025-2030 (%)

14.4 Europe - Market size and forecast 2025-2030

Chart on Europe - Market size and forecast 2025-2030 ($ million)
Data Table on Europe - Market size and forecast 2025-2030 ($ million)
Chart on Europe - Year-over-year growth 2025-2030 (%)
Data Table on Europe - Year-over-year growth 2025-2030 (%)
Chart on Regional Comparison - Europe
Data Table on Regional Comparison - Europe

14.4.1 Germany - Market size and forecast 2025-2030

Chart on Germany - Market size and forecast 2025-2030 ($ million)
Data Table on Germany - Market size and forecast 2025-2030 ($ million)
Chart on Germany - Year-over-year growth 2025-2030 (%)
Data Table on Germany - Year-over-year growth 2025-2030 (%)

14.4.2 Italy - Market size and forecast 2025-2030

Chart on Italy - Market size and forecast 2025-2030 ($ million)
Data Table on Italy - Market size and forecast 2025-2030 ($ million)
Chart on Italy - Year-over-year growth 2025-2030 (%)
Data Table on Italy - Year-over-year growth 2025-2030 (%)

14.4.3 UK - Market size and forecast 2025-2030

Chart on UK - Market size and forecast 2025-2030 ($ million)
Data Table on UK - Market size and forecast 2025-2030 ($ million)
Chart on UK - Year-over-year growth 2025-2030 (%)
Data Table on UK - Year-over-year growth 2025-2030 (%)

14.4.4 France - Market size and forecast 2025-2030

Chart on France - Market size and forecast 2025-2030 ($ million)
Data Table on France - Market size and forecast 2025-2030 ($ million)
Chart on France - Year-over-year growth 2025-2030 (%)
Data Table on France - Year-over-year growth 2025-2030 (%)

14.4.5 Spain - Market size and forecast 2025-2030

Chart on Spain - Market size and forecast 2025-2030 ($ million)
Data Table on Spain - Market size and forecast 2025-2030 ($ million)
Chart on Spain - Year-over-year growth 2025-2030 (%)
Data Table on Spain - Year-over-year growth 2025-2030 (%)

14.4.6 The Netherlands - Market size and forecast 2025-2030

Chart on The Netherlands - Market size and forecast 2025-2030 ($ million)
Data Table on The Netherlands - Market size and forecast 2025-2030 ($ million)
Chart on The Netherlands - Year-over-year growth 2025-2030 (%)
Data Table on The Netherlands - Year-over-year growth 2025-2030 (%)

14.5 APAC - Market size and forecast 2025-2030

Chart on APAC - Market size and forecast 2025-2030 ($ million)
Data Table on APAC - Market size and forecast 2025-2030 ($ million)
Chart on APAC - Year-over-year growth 2025-2030 (%)
Data Table on APAC - Year-over-year growth 2025-2030 (%)
Chart on Regional Comparison - APAC
Data Table on Regional Comparison - APAC

14.5.1 Japan - Market size and forecast 2025-2030

Chart on Japan - Market size and forecast 2025-2030 ($ million)
Data Table on Japan - Market size and forecast 2025-2030 ($ million)
Chart on Japan - Year-over-year growth 2025-2030 (%)
Data Table on Japan - Year-over-year growth 2025-2030 (%)

14.5.2 China - Market size and forecast 2025-2030

Chart on China - Market size and forecast 2025-2030 ($ million)
Data Table on China - Market size and forecast 2025-2030 ($ million)
Chart on China - Year-over-year growth 2025-2030 (%)
Data Table on China - Year-over-year growth 2025-2030 (%)

14.5.3 South Korea - Market size and forecast 2025-2030

Chart on South Korea - Market size and forecast 2025-2030 ($ million)
Data Table on South Korea - Market size and forecast 2025-2030 ($ million)
Chart on South Korea - Year-over-year growth 2025-2030 (%)
Data Table on South Korea - Year-over-year growth 2025-2030 (%)

14.5.4 India - Market size and forecast 2025-2030

Chart on India - Market size and forecast 2025-2030 ($ million)
Data Table on India - Market size and forecast 2025-2030 ($ million)
Chart on India - Year-over-year growth 2025-2030 (%)
Data Table on India - Year-over-year growth 2025-2030 (%)

14.5.5 Australia - Market size and forecast 2025-2030

Chart on Australia - Market size and forecast 2025-2030 ($ million)
Data Table on Australia - Market size and forecast 2025-2030 ($ million)
Chart on Australia - Year-over-year growth 2025-2030 (%)
Data Table on Australia - Year-over-year growth 2025-2030 (%)

14.5.6 Indonesia - Market size and forecast 2025-2030

Chart on Indonesia - Market size and forecast 2025-2030 ($ million)
Data Table on Indonesia - Market size and forecast 2025-2030 ($ million)
Chart on Indonesia - Year-over-year growth 2025-2030 (%)
Data Table on Indonesia - Year-over-year growth 2025-2030 (%)

14.6 South America - Market size and forecast 2025-2030

Chart on South America - Market size and forecast 2025-2030 ($ million)
Data Table on South America - Market size and forecast 2025-2030 ($ million)
Chart on South America - Year-over-year growth 2025-2030 (%)
Data Table on South America - Year-over-year growth 2025-2030 (%)
Chart on Regional Comparison - South America
Data Table on Regional Comparison - South America

14.6.1 Brazil - Market size and forecast 2025-2030

Chart on Brazil - Market size and forecast 2025-2030 ($ million)
Data Table on Brazil - Market size and forecast 2025-2030 ($ million)
Chart on Brazil - Year-over-year growth 2025-2030 (%)
Data Table on Brazil - Year-over-year growth 2025-2030 (%)

14.6.2 Argentina - Market size and forecast 2025-2030

Chart on Argentina - Market size and forecast 2025-2030 ($ million)
Data Table on Argentina - Market size and forecast 2025-2030 ($ million)
Chart on Argentina - Year-over-year growth 2025-2030 (%)
Data Table on Argentina - Year-over-year growth 2025-2030 (%)

14.6.3 Chile - Market size and forecast 2025-2030

Chart on Chile - Market size and forecast 2025-2030 ($ million)
Data Table on Chile - Market size and forecast 2025-2030 ($ million)
Chart on Chile - Year-over-year growth 2025-2030 (%)
Data Table on Chile - Year-over-year growth 2025-2030 (%)

14.7 Middle East and Africa - Market size and forecast 2025-2030

Chart on Middle East and Africa - Market size and forecast 2025-2030 ($ million)
Data Table on Middle East and Africa - Market size and forecast 2025-2030 ($ million)
Chart on Middle East and Africa - Year-over-year growth 2025-2030 (%)
Data Table on Middle East and Africa - Year-over-year growth 2025-2030 (%)
Chart on Regional Comparison - Middle East and Africa
Data Table on Regional Comparison - Middle East and Africa

14.7.1 Saudi Arabia - Market size and forecast 2025-2030

Chart on Saudi Arabia - Market size and forecast 2025-2030 ($ million)
Data Table on Saudi Arabia - Market size and forecast 2025-2030 ($ million)
Chart on Saudi Arabia - Year-over-year growth 2025-2030 (%)
Data Table on Saudi Arabia - Year-over-year growth 2025-2030 (%)

14.7.2 UAE - Market size and forecast 2025-2030

Chart on UAE - Market size and forecast 2025-2030 ($ million)
Data Table on UAE - Market size and forecast 2025-2030 ($ million)
Chart on UAE - Year-over-year growth 2025-2030 (%)
Data Table on UAE - Year-over-year growth 2025-2030 (%)

14.7.3 South Africa - Market size and forecast 2025-2030

Chart on South Africa - Market size and forecast 2025-2030 ($ million)
Data Table on South Africa - Market size and forecast 2025-2030 ($ million)
Chart on South Africa - Year-over-year growth 2025-2030 (%)
Data Table on South Africa - Year-over-year growth 2025-2030 (%)

14.7.4 Turkey - Market size and forecast 2025-2030

Chart on Turkey - Market size and forecast 2025-2030 ($ million)
Data Table on Turkey - Market size and forecast 2025-2030 ($ million)
Chart on Turkey - Year-over-year growth 2025-2030 (%)
Data Table on Turkey - Year-over-year growth 2025-2030 (%)

14.7.5 Israel - Market size and forecast 2025-2030

Chart on Israel - Market size and forecast 2025-2030 ($ million)
Data Table on Israel - Market size and forecast 2025-2030 ($ million)
Chart on Israel - Year-over-year growth 2025-2030 (%)
Data Table on Israel - Year-over-year growth 2025-2030 (%)

14.8 Market opportunity by geography

Market opportunity by geography ($ million)
Data Tables on Market opportunity by geography ($ million)

15. Drivers, Challenges, and Opportunity

15.1 Market drivers

Technological integration and proliferation of smart vending solutions
Increasing consumer demand for healthy and fresh food options
Adoption of cashless and contactless payment technologies

15.2 Market challenges

Escalating capital expenditures and long-term maintenance obligations
Stringent regulatory frameworks and evolving public health mandates
Security vulnerabilities and risks of physical and digital vandalism

15.3 Impact of drivers and challenges

Impact of drivers and challenges in 2025 and 2030

15.4 Market opportunities

Hyper-personalization through AI-driven consumer analytics and interactive interfaces
Rise of specialized micro-markets and automated gourmet dining
Integration of sustainable infrastructure and circular economy principles

16. Competitive Landscape

16.1 Overview

16.2

Overview on criticality of inputs and factors of differentiation

16.3 Landscape disruption

Overview on factors of disruption

16.4 Industry risks

Impact of key risks on business

17. Competitive Analysis

17.1 Companies profiled

Companies covered

17.2 Company ranking index

17.3 Market positioning of companies

Matrix on companies position and classification

17.4 Automated Merchandising Systems

Automated Merchandising Systems - Overview
Automated Merchandising Systems - Product / Service
Automated Merchandising Systems - Key offerings
SWOT

17.5 Azkoyen SA

Azkoyen SA - Overview
Azkoyen SA - Business segments
Azkoyen SA - Key offerings
Azkoyen SA - Segment focus
SWOT

17.6 Bianchi Industry S.p.A.

Bianchi Industry S.p.A. - Overview
Bianchi Industry S.p.A. - Product / Service
Bianchi Industry S.p.A. - Key offerings
SWOT

17.7 Evoca S.p.A.

Evoca S.p.A. - Overview
Evoca S.p.A. - Product / Service
Evoca S.p.A. - Key offerings
SWOT

17.8 Federal Machine

Federal Machine - Overview
Federal Machine - Product / Service
Federal Machine - Key offerings
SWOT

17.9 Fuji Electric Co. Ltd.

Fuji Electric Co. Ltd. - Overview
Fuji Electric Co. Ltd. - Business segments
Fuji Electric Co. Ltd. - Key offerings
Fuji Electric Co. Ltd. - Segment focus
SWOT

17.10 Future Techniks Pvt. Ltd.

Future Techniks Pvt. Ltd. - Overview
Future Techniks Pvt. Ltd. - Product / Service
Future Techniks Pvt. Ltd. - Key offerings
SWOT

17.11 Jofemar S.A.

Jofemar S.A. - Overview
Jofemar S.A. - Product / Service
Jofemar S.A. - Key offerings
SWOT

17.12 Rhea Vendors Group S.p.A.

Rhea Vendors Group S.p.A. - Overview
Rhea Vendors Group S.p.A. - Product / Service
Rhea Vendors Group S.p.A. - Key offerings
SWOT

17.13 Royal Vendors Inc.

Royal Vendors Inc. - Overview
Royal Vendors Inc. - Product / Service
Royal Vendors Inc. - Key offerings
SWOT

17.14 SandenVendo Inc.

SandenVendo Inc. - Overview
SandenVendo Inc. - Product / Service
SandenVendo Inc. - Key offerings
SWOT

17.15 Seaga Manufacturing Inc.

Seaga Manufacturing Inc. - Overview
Seaga Manufacturing Inc. - Product / Service
Seaga Manufacturing Inc. - Key offerings
SWOT

17.16 Sielaff GmbH and Co. KG

Sielaff GmbH and Co. KG - Overview
Sielaff GmbH and Co. KG - Product / Service
Sielaff GmbH and Co. KG - Key offerings
SWOT

17.17 V4 Vending Ltd.

V4 Vending Ltd. - Overview
V4 Vending Ltd. - Product / Service
V4 Vending Ltd. - Key offerings
SWOT

17.18 Westomatic Vending Services Ltd.

Westomatic Vending Services Ltd. - Overview
Westomatic Vending Services Ltd. - Product / Service
Westomatic Vending Services Ltd. - Key offerings
SWOT

18. Appendix

18.1 Scope of the report

Market definition
Objectives
Notes and caveats

18.2 Inclusions and exclusions checklist

Inclusions checklist
Exclusions checklist

18.3 Currency conversion rates for US$

18.4 Research methodology

18.5 Data procurement

Information sources

18.6 Data validation

18.7 Validation techniques employed for market sizing

18.8 Data synthesis

18.9 360 degree market analysis

18.10 List of abbreviations

Research Methodology

Technavio presents a detailed picture of the market by way of study, synthesis, and summation of data from multiple sources. The analysts have presented the various facets of the market with a particular focus on identifying the key industry influencers. The data thus presented is comprehensive, reliable, and the result of extensive research, both primary and secondary.

INFORMATION SOURCES

Primary sources

  • Manufacturers and suppliers
  • Channel partners
  • Industry experts
  • Strategic decision makers

Secondary sources

  • Industry journals and periodicals
  • Government data
  • Financial reports of key industry players
  • Historical data
  • Press releases

DATA ANALYSIS

Data Synthesis

  • Collation of data
  • Estimation of key figures
  • Analysis of derived insights

Data Validation

  • Triangulation with data models
  • Reference against proprietary databases
  • Corroboration with industry experts

REPORT WRITING

Qualitative

  • Market drivers
  • Market challenges
  • Market trends
  • Five forces analysis

Quantitative

  • Market size and forecast
  • Market segmentation
  • Geographical insights
  • Competitive landscape

Interested in this report?

Get your sample now to see our research methodology and insights!

Download Now

Frequently Asked Questions

Vending Machine market growth will increase by USD 32497.1 million during 2026-2030.

The Vending Machine market is expected to grow at a CAGR of 24.3% during 2026-2030.

Vending Machine market is segmented by Distribution channel (Offline, Online) Product (Intelligent vending machines, Low end vending machines) Type (Food and beverages vending machine, Fresh food vending machine, Non-food items vending machine, Ice-cream vending machine) Application (Hotels and restaurants, Corporate offices and institutions, Public places, Retail stores) Method (Cash-based vending machine, Cashless-based vending machine)

Automated Merchandising Systems, Azkoyen SA, Bianchi Industry S.p.A., Evoca S.p.A., FAS International S.p.A., Fastcorp Vending LLC, Federal Machine, Fuji Electric Co. Ltd., Future Techniks Pvt. Ltd., Jofemar S.A., Magex S.r.l., Rhea Vendors Group S.p.A., Royal Vendors Inc., SandenVendo Inc., Seaga Manufacturing Inc., Sielaff GmbH and Co. KG, TCN Vending Machine, V4 Vending Ltd., Westomatic Vending Services Ltd., XY Vending Machine Co. Ltd. are a few of the key vendors in the Vending Machine market.

North America will register the highest growth rate of 39.2% among the other regions. Therefore, the Vending Machine market in North America is expected to garner significant business opportunities for the vendors during the forecast period.

US, Canada, Mexico, Germany, Italy, UK, France, Spain, The Netherlands, Japan, China, South Korea, India, Australia, Indonesia, Brazil, Argentina, Chile, Saudi Arabia, UAE, South Africa, Turkey, Israel

  • Technological integration and proliferation of smart vending solutions is the driving factor this market.

The Vending Machine market vendors should focus on grabbing business opportunities from the Distribution channel segment as it accounted for the largest market share in the base year.
RIA - Research AI Assistant
Ask RIA