Vision Guided Robotics Market Analysis APAC, North America, Europe, Middle East and Africa, South America - China, US, Japan, Germany, South Korea - Size and Forecast 2024-2028

Vision Guided Robotics Market Analysis APAC, North America, Europe, Middle East and Africa, South America - China, US, Japan, Germany, South Korea - Size and Forecast 2024-2028

Published: May 2024 176 Pages SKU: IRTNTR45052

Market Overview at a Glance

$5.76 B
Market Opportunity
12.14%
CAGR
10.49
YoY growth 2023-2024(%)

Vision Guided Robotics Market Size 2024-2028 

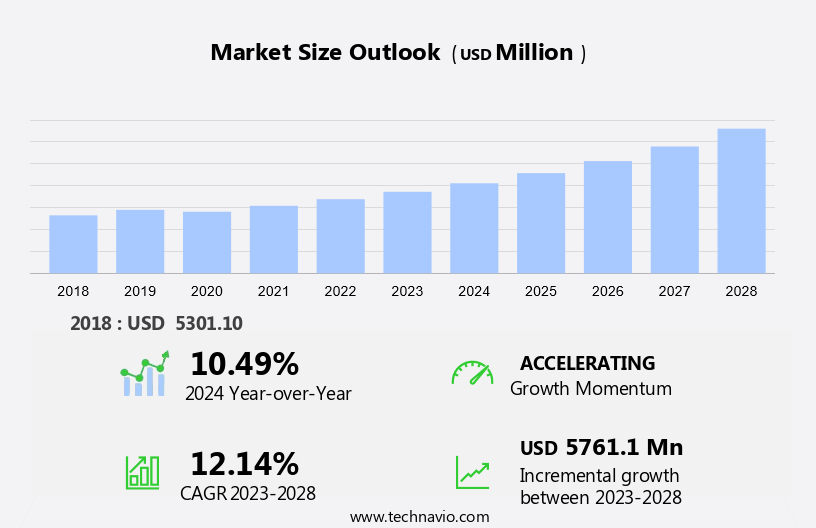
The vision guided robotics market size is forecast to increase by USD 5.76 billion at a CAGR of 12.14% between 2023 and 2028.

  • The market is experiencing significant growth due to several key trends. One trend is the decline in the price of electronic components, making these technologies more accessible to businesses. Another trend is the increasing adoption of 3D-multi imaging and image scanning technologies, which enhance the accuracy and flexibility of robotics systems.
  • Additionally, longer battery life is a crucial factor, as it allows for extended operation and increased productivity. The market is driven by advancements in technology, particularly in camera systems and actuators, which enable greater precision and control. The components of vision guided robotics, including hardware and software, are continually evolving to meet the demands of various industries. These trends are shaping the future of automation and manufacturing, offering numerous benefits such as improved resource utilization and increased efficiency.

What will be the Size of the Market During the Forecast Period?

Vision Guided Robotics Market Size

 Request Free Sample

  • Vision guided robotics is a subfield of robotics engineering that utilizes cameras and sensors to enable robots to locate and identify target locations. This technology relies on feedback indication from the robot controller to adjust the robot's movements based on the visual data received from the cameras. The integration of vision guided robotics in various industries has been a significant development in automation technology. The technology finds extensive applications in automobile manufacturing, electrical & electronics, healthcare & pharmaceutical, and aerospace & defense industries. In the automobile industry, vision guided robotics is used for tasks such as welding, painting, and assembly.
  • Additionally, the technology's ability to accurately locate and identify target areas reduces human error and increases production efficiency. In electrical & electronics manufacturing, vision guided robotics is used for pick-and-place operations, inspection, and testing. The healthcare & pharmaceutical industry benefits from the use of vision guided robotics in tasks such as medication dispensing, surgical assistance, and laboratory automation. In aerospace & defense, the technology is used for assembly, inspection, and testing of complex parts and systems. Designing and setting up a vision guided robotics system involves the use of resources such as cameras, actuators, software, and sensors. The cameras capture visual data, which is processed by software to identify target locations.
  • Furthermore, the robot controller uses this information to adjust the robot's movements, ensuring precise positioning and accurate execution of tasks. Labor safety concerns, hazardous environments, and rough terrains are some of the challenges that the market faces. However, the rising costs of energy and the need for increased efficiency have made vision guided robotics an attractive solution for industries looking to automate their processes. In conclusion, the market is witnessing significant growth due to its applications in various industry verticals. The technology's ability to improve efficiency, reduce human error, and enhance safety makes it an essential component of modern manufacturing and production processes. With continued advancements in technology and the increasing demand for automation, the future of vision guided robotics looks promising.

How is this market segmented and which is the largest segment?

The market research report provides comprehensive data (region-wise segment analysis), with forecasts and estimates in "USD billion" for the period 2024-2028, as well as historical data from 2018-2022 for the following segments.

  • Application
    • Logistics
    • Welding
    • Inspection and cleaning
    • Painting
  • Type
    • 2D-Vision
    • 3D-Vision
  • Geography
    • APAC
      • China
      • Japan
      • South Korea
    • North America
      • US
    • Europe
      • Germany
    • Middle East and Africa
    • South America

By Application Insights

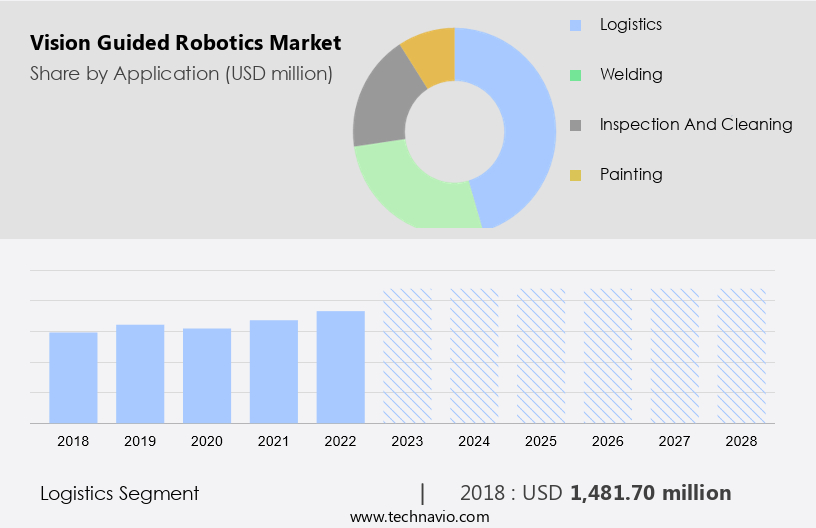
  • The logistics segment is estimated to witness significant growth during the forecast period.

In various industries, including food and beverage and logistics, the use of vision guided robotics has become increasingly popular. Previously, industrial robots were limited to assembly lines and conveyor belts, requiring manual intervention for optimal performance. These traditional robots often resulted in slow production rates. To enhance robot capabilities, vision systems were integrated, enabling robots to identify and process visual data. The implementation of 2D-vision systems, particularly for robots operating near assembly lines, has been particularly effective.

Additionally, this technology empowers robots to recognize the contours and dimensions of objects, enabling them to accurately palletize items for packaging. Vision guided robotics has significantly improved efficiency and productivity in industries such as automobile manufacturing, electrical and electronics, healthcare and pharmaceuticals, aerospace and defense, and food and beverage. Controllers, which are integral to the functioning of these robots, have also advanced, enabling seamless integration of vision systems and enhancing overall performance. Vision guided robotics is a vital innovation that continues to transform manufacturing processes and optimize logistics operations.

Vision Guided Robotics Market Size

Get a glance at the market report of share of various segments Request Free Sample

The logistics segment was valued at USD 1.48 billion in 2018 and showed a gradual increase during the forecast period.

Regional Analysis

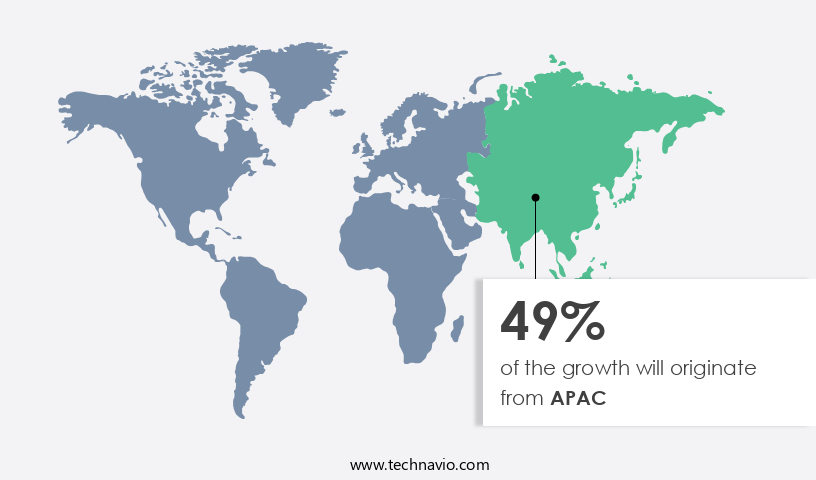
  • APAC is estimated to contribute 49% to the growth of the global market during the forecast period.

Technavio's analysts have elaborately explained the regional trends and drivers that shape the market during the forecast period.

Vision Guided Robotics Market Share by Geography

For more insights on the market share of various regions, Request Free Sample

The market in APAC: Growth Drivers and Applications Vision guided robotics, a technology that enables robots to navigate and perform tasks based on visual information, has gained significant traction in APAC between 2011 and 2023. This growth can be attributed to several factors, including the increasing adoption of robots in industries, the development of advanced technologies and software platforms, and the need to minimize production costs and maintain manufacturing units. Two major industries, electrical and electronics and automotive, are leading the adoption of vision guided robotics in APAC. The electrical and electronics industry requires high precision in manufacturing processes, making vision guided robotics an ideal solution.

Similarly, in the automotive industry, robots with vision capabilities can perform tasks such as welding, painting, and assembly with greater accuracy. Moreover, the decrease in the workforce and the prevalence of repetitive jobs have led industries to invest in automation solutions, including vision guided robotics. The integration of cameras, sensors, and feedback indicators with robot controllers has made these systems more versatile and effective in various applications. Japan, a major player in the industrial robotics market, experienced a resurgence in growth due to the adoption of these advanced technologies. Other countries in APAC, such as China, South Korea, and ASEAN nations, have also shown strong growth in the implementation of vision guided robotics. In conclusion, the market in APAC is expected to continue its growth trajectory, driven by the increasing demand for automation, precision, and cost savings in various industries.

Market Dynamics

Our researchers analyzed the data with 2023 as the base year, along with the key drivers, trends, and challenges. A holistic analysis of drivers will help companies refine their marketing strategies to gain a competitive advantage.

What are the key market drivers leading to the rise in adoption of Vision Guided Robotics Market?

The decline in electronic component prices is the key driver of the market.

  • In the realm of manufacturing, vision-guided robotic systems have emerged as a game-changer, enhancing production efficiency and ensuring superior quality. Traditional production processes were often marred by human errors and wastage of resources. The integration of vision-guided robotics technology into industrial applications has mitigated these issues.
  • Previously, multiple cameras and sensors were employed for 3D vision technology, with operators manually programming PC software for each application. However, advancements in smart sensors and cameras have streamlined this process. The use of customized programming has been largely replaced by more adaptable systems, leading to increased productivity and cost savings. The decreasing prices of essential electronic components, such as sensors and cameras, have further accelerated the adoption of these systems.

What are the market trends shaping the Vision Guided Robotics Market?

3D-multi imaging and image scanning are the upcoming trends in the market.

  • Vision-guided robotics is a technological advancement in industrial automation, where autonomous mobile robots rely on cameras and sensors for navigation and image recognition. These robots have gained popularity due to their flexibility and ability to adapt to complex environments. The integration of smart vision systems has made these robots more self-reliant, enabling them to identify intricate images and navigate accurately. The evolution of vision-guided robotics from 2D to 3D systems has significantly improved their precision and speed.
  • In April 2023, ABB introduced Visual Simultaneous Localization and Mapping (VSLAM) technology to its Autonomous Mobile Robots (AMRs), further enhancing their capabilities. Vision-guided robotics is an essential component in industries that demand high levels of accuracy and efficiency. This technology is expected to continue transforming industrial processes, offering significant benefits to businesses in terms of resources and productivity. 

What challenges does Vision Guided Robotics Market face during the growth?

Battery life is a key challenge affecting the market growth.

  • Vision guided robots are becoming increasingly popular in various industries due to their ability to reduce operational costs, automate critical tasks, and enhance work efficiency and product quality with greater precision. These robots, which are often battery-operated, offer increased independence and flexibility compared to traditional robotic systems. Warehousing and logistics sectors, in particular, have embraced vision-guided robots for their autonomous and remotely-operated capabilities, enabling them to move around the floor and execute various tasks.
  • However, the use of batteries in these robots poses a challenge, as they do not last long enough to support continuous operation, leading to potential downtime. To address this issue, there is a growing demand for batteries with extended durability to support the flexibility and agility of vision guided robots.

Exclusive Customer Landscape

The market forecasting report includes the adoption lifecycle of the market, covering from the innovator's stage to the laggard's stage. It focuses on adoption rates in different regions based on penetration. Furthermore, the market report also includes key purchase criteria and drivers of price sensitivity to help companies evaluate and develop their market growth analysis strategies.

Vision Guided Robotics Market Share by Geography

 Customer Landscape

Key Companies & Market Insights

Companies are implementing various strategies, such as strategic alliances, market forecast, partnerships, mergers and acquisitions, geographical expansion, and product/service launches, to enhance their presence in the market. The market research and growth report includes detailed analyses of the competitive landscape of the market and information about key companies, including:

  • ABB Ltd.
  • Acieta LLC
  • Atlas Copco AB
  • Basler AG
  • Cognex Corp.
  • Cross Co.
  • DENSO Corp.
  • FANUC Corp.
  • GECKO ROBOTICS INC.
  • General Electric Co.
  • Invert Robotics Group Ltd.
  • IPG Photonics Corp.
  • Keyence Corp.
  • OMRON Corp.
  • Pleora Technologies Inc.
  • Previan Technologies Inc.
  • Qualitas Technologies Pvt. Ltd.
  • Robotic Automation Systems
  • Teradyne Inc.
  • Yaskawa Electric Corp.

Qualitative and quantitative analysis of companies has been conducted to help clients understand the wider business environment as well as the strengths and weaknesses of key market players. Data is qualitatively analyzed to categorize companies as pure play, category-focused, industry-focused, and diversified; it is quantitatively analyzed to categorize companies as dominant, leading, strong, tentative, and weak.

Research Analyst Overview

Vision-guided robotics is a subfield of robotics that utilizes cameras and sensors to provide feedback indication for robot controllers to navigate and manipulate objects based on their visual perception of the target location. This technology enhances production efficiency and improves product quality by reducing human errors and wastage of resources. Vision-guided robotic systems are increasingly being adopted across diverse industries, including automobile, electrical & electronics, healthcare & pharmaceutical, aerospace & defense, and food & beverage. The need for automation in industries is driving the growth of vision-guided robotics technology. Rising labor costs, labor safety concerns, and the need to operate in hazardous environments and rough terrains are some of the factors fueling this trend.

Additionally, the flexibility offered by vision-guided robots, which can be customized for specific production processes, is another key advantage. However, the implementation of vision-guided robotics systems comes with costs and complexity. Fixed tooling, design, set up, and the integration of components such as cameras, actuators, hardware, and software can be expensive and time-consuming. Additionally, the increasing energy costs and operational expenditure are investment pockets for companies looking to adopt this technology. Vision-guided robotics systems are revolutionizing production processes by enabling flexible automation and reducing reliance on human labor. Despite the initial investment, the long-term benefits of increased efficiency, improved quality, and reduced wastage make it a worthwhile investment for industries looking to remain competitive in today's market.

Market Scope

Report Coverage

Details

Page number

176

Base year

2023

Historic period

2018-2022

Forecast period

2024-2028

Growth momentum & CAGR

Accelerate at a CAGR of 12.14%

Market growth 2024-2028

USD 5.76 billion

Market structure

Fragmented

YoY growth 2023-2024(%)

10.49

Key countries

China, US, Japan, Germany, and South Korea

Competitive landscape

Leading Companies, Market Positioning of Companies, Competitive Strategies, and Industry Risks

Request Free Sample

What are the Key Data Covered in this Market Research and Growth Report?

  • CAGR of the market during the forecast period
  • Detailed information on factors that will drive the market growth and forecasting between 2024 and 2028
  • Precise estimation of the size of the market  and its contribution of the market in focus to the parent market
  • Accurate predictions about upcoming market growth and trends and changes in consumer behaviour
  • Growth of the market across APAC, North America, Europe, Middle East and Africa, and South America
  • Thorough analysis of the market's competitive landscape and detailed information about companies
  • Comprehensive analysis of factors that will challenge the growth of market companies

We can help! Our analysts can customize this market research report to meet your requirements. Get in touch

1 Executive Summary

  • 1.1 Market overview
    • Executive Summary - Chart on Market Overview
    • Executive Summary - Data Table on Market Overview
    • Executive Summary - Chart on Global Market Characteristics
    • Executive Summary - Chart on Market by Geography
    • Executive Summary - Chart on Market Segmentation by Application
    • Executive Summary - Chart on Market Segmentation by Type
    • Executive Summary - Chart on Incremental Growth
    • Executive Summary - Data Table on Incremental Growth
    • Executive Summary - Chart on Company Market Positioning

2 Market Landscape

  • 2.1 Market ecosystem
    • Parent Market
    • Data Table on - Parent Market
  • 2.2 Market characteristics
    • Market characteristics analysis
  • 2.3 Value chain analysis
    • Value Chain Analysis

3 Market Sizing

  • 3.1 Market definition
    • Offerings of companies included in the market definition
  • 3.2 Market segment analysis
    • Market segments
  • 3.3 Market size 2023
    • 3.4 Market outlook: Forecast for 2023-2028
      • Chart on Global - Market size and forecast 2023-2028 ($ million)
      • Data Table on Global - Market size and forecast 2023-2028 ($ million)
      • Chart on Global Market: Year-over-year growth 2023-2028 (%)
      • Data Table on Global Market: Year-over-year growth 2023-2028 (%)

    4 Historic Market Size

    • 4.1 Global Vision Guided Robotics Market 2018 - 2022
      • Historic Market Size - Data Table on Global Vision Guided Robotics Market 2018 - 2022 ($ million)
    • 4.2 Application segment analysis 2018 - 2022
      • Historic Market Size - Application Segment 2018 - 2022 ($ million)
    • 4.3 Type segment analysis 2018 - 2022
      • Historic Market Size - Type Segment 2018 - 2022 ($ million)
    • 4.4 Geography segment analysis 2018 - 2022
      • Historic Market Size - Geography Segment 2018 - 2022 ($ million)
    • 4.5 Country segment analysis 2018 - 2022
      • Historic Market Size - Country Segment 2018 - 2022 ($ million)

    5 Five Forces Analysis

    • 5.1 Five forces summary
      • Five forces analysis - Comparison between 2023 and 2028
    • 5.2 Bargaining power of buyers
      • Bargaining power of buyers - Impact of key factors 2023 and 2028
    • 5.3 Bargaining power of suppliers
      • Bargaining power of suppliers - Impact of key factors in 2023 and 2028
    • 5.4 Threat of new entrants
      • Threat of new entrants - Impact of key factors in 2023 and 2028
    • 5.5 Threat of substitutes
      • Threat of substitutes - Impact of key factors in 2023 and 2028
    • 5.6 Threat of rivalry
      • Threat of rivalry - Impact of key factors in 2023 and 2028
    • 5.7 Market condition
      • Chart on Market condition - Five forces 2023 and 2028

    6 Market Segmentation by Application

    • 6.1 Market segments
      • Chart on Application - Market share 2023-2028 (%)
      • Data Table on Application - Market share 2023-2028 (%)
    • 6.2 Comparison by Application
      • Chart on Comparison by Application
      • Data Table on Comparison by Application
    • 6.3 Logistics - Market size and forecast 2023-2028
      • Chart on Logistics - Market size and forecast 2023-2028 ($ million)
      • Data Table on Logistics - Market size and forecast 2023-2028 ($ million)
      • Chart on Logistics - Year-over-year growth 2023-2028 (%)
      • Data Table on Logistics - Year-over-year growth 2023-2028 (%)
    • 6.4 Welding - Market size and forecast 2023-2028
      • Chart on Welding - Market size and forecast 2023-2028 ($ million)
      • Data Table on Welding - Market size and forecast 2023-2028 ($ million)
      • Chart on Welding - Year-over-year growth 2023-2028 (%)
      • Data Table on Welding - Year-over-year growth 2023-2028 (%)
    • 6.5 Inspection and cleaning - Market size and forecast 2023-2028
      • Chart on Inspection and cleaning - Market size and forecast 2023-2028 ($ million)
      • Data Table on Inspection and cleaning - Market size and forecast 2023-2028 ($ million)
      • Chart on Inspection and cleaning - Year-over-year growth 2023-2028 (%)
      • Data Table on Inspection and cleaning - Year-over-year growth 2023-2028 (%)
    • 6.6 Painting - Market size and forecast 2023-2028
      • Chart on Painting - Market size and forecast 2023-2028 ($ million)
      • Data Table on Painting - Market size and forecast 2023-2028 ($ million)
      • Chart on Painting - Year-over-year growth 2023-2028 (%)
      • Data Table on Painting - Year-over-year growth 2023-2028 (%)
    • 6.7 Market opportunity by Application
      • Market opportunity by Application ($ million)
      • Data Table on Market opportunity by Application ($ million)

    7 Market Segmentation by Type

    • 7.1 Market segments
      • Chart on Type - Market share 2023-2028 (%)
      • Data Table on Type - Market share 2023-2028 (%)
    • 7.2 Comparison by Type
      • Chart on Comparison by Type
      • Data Table on Comparison by Type
    • 2D-Vision - Market size and forecast 2023-2028
      • Chart on 2D-Vision - Market size and forecast 2023-2028 ($ million)
      • Data Table on 2D-Vision - Market size and forecast 2023-2028 ($ million)
      • Chart on 2D-Vision - Year-over-year growth 2023-2028 (%)
      • Data Table on 2D-Vision - Year-over-year growth 2023-2028 (%)
    • 3D-Vision - Market size and forecast 2023-2028
      • Chart on 3D-Vision - Market size and forecast 2023-2028 ($ million)
      • Data Table on 3D-Vision - Market size and forecast 2023-2028 ($ million)
      • Chart on 3D-Vision - Year-over-year growth 2023-2028 (%)
      • Data Table on 3D-Vision - Year-over-year growth 2023-2028 (%)
    • 7.5 Market opportunity by Type
      • Market opportunity by Type ($ million)
      • Data Table on Market opportunity by Type ($ million)

    8 Customer Landscape

    • 8.1 Customer landscape overview
      • Analysis of price sensitivity, lifecycle, customer purchase basket, adoption rates, and purchase criteria

    9 Geographic Landscape

    • 9.1 Geographic segmentation
      • Chart on Market share by geography 2023-2028 (%)
      • Data Table on Market share by geography 2023-2028 (%)
    • 9.2 Geographic comparison
      • Chart on Geographic comparison
      • Data Table on Geographic comparison
    • 9.3 APAC - Market size and forecast 2023-2028
      • Chart on APAC - Market size and forecast 2023-2028 ($ million)
      • Data Table on APAC - Market size and forecast 2023-2028 ($ million)
      • Chart on APAC - Year-over-year growth 2023-2028 (%)
      • Data Table on APAC - Year-over-year growth 2023-2028 (%)
    • 9.4 North America - Market size and forecast 2023-2028
      • Chart on North America - Market size and forecast 2023-2028 ($ million)
      • Data Table on North America - Market size and forecast 2023-2028 ($ million)
      • Chart on North America - Year-over-year growth 2023-2028 (%)
      • Data Table on North America - Year-over-year growth 2023-2028 (%)
    • 9.5 Europe - Market size and forecast 2023-2028
      • Chart on Europe - Market size and forecast 2023-2028 ($ million)
      • Data Table on Europe - Market size and forecast 2023-2028 ($ million)
      • Chart on Europe - Year-over-year growth 2023-2028 (%)
      • Data Table on Europe - Year-over-year growth 2023-2028 (%)
    • 9.6 Middle East and Africa - Market size and forecast 2023-2028
      • Chart on Middle East and Africa - Market size and forecast 2023-2028 ($ million)
      • Data Table on Middle East and Africa - Market size and forecast 2023-2028 ($ million)
      • Chart on Middle East and Africa - Year-over-year growth 2023-2028 (%)
      • Data Table on Middle East and Africa - Year-over-year growth 2023-2028 (%)
    • 9.7 South America - Market size and forecast 2023-2028
      • Chart on South America - Market size and forecast 2023-2028 ($ million)
      • Data Table on South America - Market size and forecast 2023-2028 ($ million)
      • Chart on South America - Year-over-year growth 2023-2028 (%)
      • Data Table on South America - Year-over-year growth 2023-2028 (%)
    • 9.8 China - Market size and forecast 2023-2028
      • Chart on China - Market size and forecast 2023-2028 ($ million)
      • Data Table on China - Market size and forecast 2023-2028 ($ million)
      • Chart on China - Year-over-year growth 2023-2028 (%)
      • Data Table on China - Year-over-year growth 2023-2028 (%)
    • 9.9 US - Market size and forecast 2023-2028
      • Chart on US - Market size and forecast 2023-2028 ($ million)
      • Data Table on US - Market size and forecast 2023-2028 ($ million)
      • Chart on US - Year-over-year growth 2023-2028 (%)
      • Data Table on US - Year-over-year growth 2023-2028 (%)
    • 9.10 Japan - Market size and forecast 2023-2028
      • Chart on Japan - Market size and forecast 2023-2028 ($ million)
      • Data Table on Japan - Market size and forecast 2023-2028 ($ million)
      • Chart on Japan - Year-over-year growth 2023-2028 (%)
      • Data Table on Japan - Year-over-year growth 2023-2028 (%)
    • 9.11 Germany - Market size and forecast 2023-2028
      • Chart on Germany - Market size and forecast 2023-2028 ($ million)
      • Data Table on Germany - Market size and forecast 2023-2028 ($ million)
      • Chart on Germany - Year-over-year growth 2023-2028 (%)
      • Data Table on Germany - Year-over-year growth 2023-2028 (%)
    • 9.12 South Korea - Market size and forecast 2023-2028
      • Chart on South Korea - Market size and forecast 2023-2028 ($ million)
      • Data Table on South Korea - Market size and forecast 2023-2028 ($ million)
      • Chart on South Korea - Year-over-year growth 2023-2028 (%)
      • Data Table on South Korea - Year-over-year growth 2023-2028 (%)
    • 9.13 Market opportunity by geography
      • Market opportunity by geography ($ million)
      • Data Tables on Market opportunity by geography ($ million)

    10 Drivers, Challenges, and Opportunity/Restraints

    • 10.1 Market drivers
      • 10.2 Market challenges
        • 10.3 Impact of drivers and challenges
          • Impact of drivers and challenges in 2023 and 2028
        • 10.4 Market opportunities/restraints

          11 Competitive Landscape

          • 11.1 Overview
            • 11.2 Competitive Landscape
              • Overview on criticality of inputs and factors of differentiation
            • 11.3 Landscape disruption
              • Overview on factors of disruption
            • 11.4 Industry risks
              • Impact of key risks on business

            12 Competitive Analysis

            • 12.1 Companies profiled
              • Companies covered
            • 12.2 Market positioning of companies
              • Matrix on companies position and classification
            • 12.3 ABB Ltd.
              • ABB Ltd. - Overview
              • ABB Ltd. - Business segments
              • ABB Ltd. - Key news
              • ABB Ltd. - Key offerings
              • ABB Ltd. - Segment focus
            • 12.4 Basler AG
              • Basler AG - Overview
              • Basler AG - Product / Service
              • Basler AG - Key offerings
            • 12.5 Cognex Corp.
              • Cognex Corp. - Overview
              • Cognex Corp. - Product / Service
              • Cognex Corp. - Key news
              • Cognex Corp. - Key offerings
            • 12.6 Cross Co.
              • Cross Co. - Overview
              • Cross Co. - Product / Service
              • Cross Co. - Key offerings
            • 12.7 DENSO Corp.
              • DENSO Corp. - Overview
              • DENSO Corp. - Business segments
              • DENSO Corp. - Key news
              • DENSO Corp. - Key offerings
              • DENSO Corp. - Segment focus
            • 12.8 FANUC Corp.
              • FANUC Corp. - Overview
              • FANUC Corp. - Product / Service
              • FANUC Corp. - Key news
              • FANUC Corp. - Key offerings
            • 12.9 GECKO ROBOTICS INC.
              • GECKO ROBOTICS INC. - Overview
              • GECKO ROBOTICS INC. - Product / Service
              • GECKO ROBOTICS INC. - Key offerings
            • 12.10 General Electric Co.
              • General Electric Co. - Overview
              • General Electric Co. - Business segments
              • General Electric Co. - Key news
              • General Electric Co. - Key offerings
              • General Electric Co. - Segment focus
            • 12.11 Invert Robotics Group Ltd.
              • Invert Robotics Group Ltd. - Overview
              • Invert Robotics Group Ltd. - Product / Service
              • Invert Robotics Group Ltd. - Key offerings
            • 12.12 IPG Photonics Corp.
              • IPG Photonics Corp. - Overview
              • IPG Photonics Corp. - Product / Service
              • IPG Photonics Corp. - Key news
              • IPG Photonics Corp. - Key offerings
            • 12.13 Keyence Corp.
              • Keyence Corp. - Overview
              • Keyence Corp. - Product / Service
              • Keyence Corp. - Key offerings
            • 12.14 OMRON Corp.
              • OMRON Corp. - Overview
              • OMRON Corp. - Business segments
              • OMRON Corp. - Key news
              • OMRON Corp. - Key offerings
              • OMRON Corp. - Segment focus
            • 12.15 Previan Technologies Inc.
              • Previan Technologies Inc. - Overview
              • Previan Technologies Inc. - Product / Service
              • Previan Technologies Inc. - Key offerings
            • 12.16 Qualitas Technologies Pvt. Ltd.
              • Qualitas Technologies Pvt. Ltd. - Overview
              • Qualitas Technologies Pvt. Ltd. - Product / Service
              • Qualitas Technologies Pvt. Ltd. - Key offerings
            • 12.17 Robotic Automation Systems
              • Robotic Automation Systems - Overview
              • Robotic Automation Systems - Product / Service
              • Robotic Automation Systems - Key offerings

            13 Appendix

            • 13.1 Scope of the report
              • 13.2 Inclusions and exclusions checklist
                • Inclusions checklist
                • Exclusions checklist
              • 13.3 Currency conversion rates for US$
                • Currency conversion rates for US$
              • 13.4 Research methodology
                • Research methodology
              • 13.5 Data procurement
                • Information sources
              • 13.6 Data validation
                • Data validation
              • 13.7 Validation techniques employed for market sizing
                • Validation techniques employed for market sizing
              • 13.8 Data synthesis
                • Data synthesis
              • 13.9 360 degree market analysis
                • 360 degree market analysis
              • 13.10 List of abbreviations
                • List of abbreviations

              Research Methodology

              Technavio presents a detailed picture of the market by way of study, synthesis, and summation of data from multiple sources. The analysts have presented the various facets of the market with a particular focus on identifying the key industry influencers. The data thus presented is comprehensive, reliable, and the result of extensive research, both primary and secondary.

              INFORMATION SOURCES

              Primary sources

              • Manufacturers and suppliers
              • Channel partners
              • Industry experts
              • Strategic decision makers

              Secondary sources

              • Industry journals and periodicals
              • Government data
              • Financial reports of key industry players
              • Historical data
              • Press releases

              DATA ANALYSIS

              Data Synthesis

              • Collation of data
              • Estimation of key figures
              • Analysis of derived insights

              Data Validation

              • Triangulation with data models
              • Reference against proprietary databases
              • Corroboration with industry experts

              REPORT WRITING

              Qualitative

              • Market drivers
              • Market challenges
              • Market trends
              • Five forces analysis

              Quantitative

              • Market size and forecast
              • Market segmentation
              • Geographical insights
              • Competitive landscape

              Interested in this report?

              Get your sample now to see our research methodology and insights!

              Download Now

              Frequently Asked Questions

              Vision Guided Robotics market growth will increase by $ 5761.1 mn during 2024-2028 .

              The Vision Guided Robotics market is expected to grow at a CAGR of 12.14% during 2024-2028 .

              Vision Guided Robotics market is segmented by Application( Logistics, Welding, Inspection and cleaning, Painting) Type( 2D-Vision, 3D-Vision, Inspection and cleaning, Painting)

              ABB Ltd., Acieta LLC, Atlas Copco AB, Basler AG, Cognex Corp., Cross Co., DENSO Corp., FANUC Corp., GECKO ROBOTICS INC., General Electric Co., Invert Robotics Group Ltd., IPG Photonics Corp., Keyence Corp., OMRON Corp., Pleora Technologies Inc., Previan Technologies Inc., Qualitas Technologies Pvt. Ltd., Robotic Automation Systems, Teradyne Inc., Yaskawa Electric Corp. are a few of the key vendors in the Vision Guided Robotics market.

              APAC will register the highest growth rate of 49% among the other regions. Therefore, the Vision Guided Robotics market in APAC is expected to garner significant business opportunities for the vendors during the forecast period.

              China, US, Japan, Germany, South Korea

              • Decline in electronic component pricesThe most important market driver driving new product development in the market in focus is the availability of electronic robotic components. However is the driving factor this market.
              • the prices of electronic components such as sensors and cameras have decreased as a result of new research in industrial applications. Technology advancements in the creation of smart sensors and cameras have been witnessed. The inclusion of these components into industrial robots has enabled them to view objects more precisely and correctly. Earlier is the driving factor this market.
              • more cameras and sensors were used for 3D vision technology. Also is the driving factor this market.
              • PC software was operated by a vision operator for these robots. There was a major use of customized programming is the driving factor this market.
              • which was changed frequently for the required application. However is the driving factor this market.
              • the introduction of improved cameras and sensors led to the incorporation of a single component functioning as a vision system. This has dramatically decreased the operational cost of vision guided industrial robots. The decline in the cost of raw materials may positively impact the growth of the global market in focus during the forecast period. is the driving factor this market.

              The Vision Guided Robotics market vendors should focus on grabbing business opportunities from the Logistics segment as it accounted for the largest market share in the base year.