
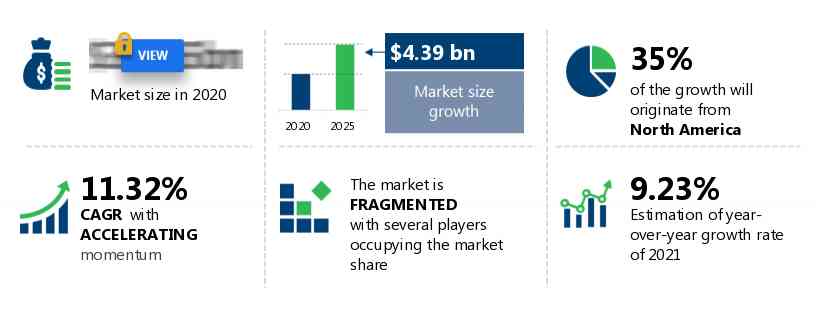
The visual analytics market has the potential to grow by USD 4.39 billion during 2021-2025, and the market’s growth momentum will accelerate at a CAGR of 11.32%.
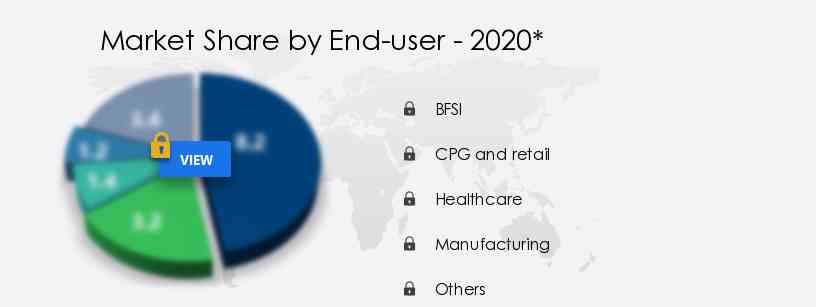
This visual analytics market research report provides valuable insights on the post COVID-19 impact on the market, which will help companies evaluate their business approaches. Furthermore, this report extensively covers market segmentation by end-user (BFSI, CPG and retail, healthcare, manufacturing, and others) and geography (North America, APAC, Europe, MEA, and South America). The visual analytics market report also offers information on several market vendors, including Altair Engineering Inc., Alteryx Inc., Arcadia Data Inc., Datameer Inc., International Business Machines Corp., Microsoft Corp., QlikTech international AB, SAP SE, SAS Institute Inc., and Tableau Software LLC among others.
What will the Visual Analytics Market Size be in 2021?
Browse TOC and LoE with selected illustrations and example pages of Visual Analytics Market
Visual Analytics Market: Key Drivers and Trends
The growing availability and complexity of data are notably driving the visual analytics market growth, although factors such as data privacy and security concerns may impede market growth. Our research analysts have studied the historical data and deduced the key market drivers and the COVID-19 pandemic impact on the visual analytics industry. The holistic analysis of the drivers will help in deducing end goals and refining marketing strategies to gain a competitive edge.
|
|
This visual analytics market analysis report also provides detailed information on other upcoming trends and challenges that will have a far-reaching effect on the market growth. The actionable insights on the trends and challenges will help companies evaluate and develop growth strategies for 2021-2025.
Who are the Major Visual Analytics Market Vendors?
The report analyzes the market’s competitive landscape and offers information on several market vendors, including:
- Altair Engineering Inc.
- Alteryx Inc.
- Arcadia Data Inc.
- Datameer Inc.
- International Business Machines Corp.
- Microsoft Corp.
- QlikTech international AB
- SAP SE
- SAS Institute Inc.
- Tableau Software LLC
This statistical study of the visual analytics market encompasses successful business strategies deployed by the key vendors. The visual analytics market is fragmented and the vendors are deploying growth strategies such as providing customized solutions to compete in the market.
To make the most of the opportunities and recover from post COVID-19 impact, market vendors should focus more on the growth prospects in the fast-growing segments, while maintaining their positions in the slow-growing segments.
The visual analytics market forecast report offers in-depth insights into key vendor profiles. The profiles include information on the production, sustainability, and prospects of the leading companies.
Which are the Key Regions for Visual Analytics Market?
For more insights on the market share of various regions Request for a FREE sample now!
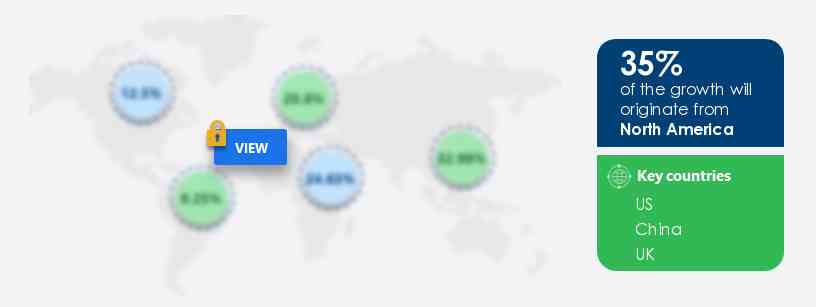
35% of the market’s growth will originate from North America during the forecast period. The US is a key market for visual analytics in North America. Market growth in this region will be faster than the growth of the market in Europe, MEA, and South America.
This market research report entails detailed information on the competitive intelligence, marketing gaps, and regional opportunities in store for vendors, which will assist in creating efficient business plans.
What are the Revenue-generating End-user Segments in the Visual Analytics Market?
To gain further insights on the market contribution of various segments Request for a FREE sample
The visual analytics market share growth by the BFSI segment will be significant during the forecast period. This report provides an accurate prediction of the contribution of all the segments to the growth of the visual analytics market size and actionable market insights on post COVID-19 impact on each segment.
You may be interested in:
US Visual Analytics market in Education Sector - The market share is expected to grow steadily and post a CAGR of approximately 9% by 2020.
What are the Key Factors Covered in this Visual Analytics Market Report?
- CAGR of the market during the forecast period 2021-2025
- Detailed information on factors that will drive visual analytics market growth during the next five years
- Precise estimation of the visual analytics market size and its contribution to the parent market
- Accurate predictions on upcoming trends and changes in consumer behavior
- The growth of the visual analytics industry across North America, APAC, Europe, MEA, and South America
- A thorough analysis of the market’s competitive landscape and detailed information on vendors
- Comprehensive details of factors that will challenge the growth of visual analytics market vendors
We can help! Our analysts can customize this report to meet your requirements. Get in touch
|
Visual Analytics Market Scope |
|
|
Report Coverage |
Details |
|
Page number |
120 |
|
Base year |
2020 |
|
Forecast period |
2021-2025 |
|
Growth momentum & CAGR |
Accelerate at a CAGR of 11.32% |
|
Market growth 2021-2025 |
$ 4.39 billion |
|
Market structure |
Fragmented |
|
YoY growth (%) |
9.23 |
|
Regional analysis |
North America, APAC, Europe, MEA, and South America |
|
Performing market contribution |
North America at 35% |
|
Key consumer countries |
US, China, UK, Germany, and India |
|
Competitive landscape |
Leading companies, competitive strategies, consumer engagement scope |
|
Companies profiled |
Altair Engineering Inc., Alteryx Inc., Arcadia Data Inc., Datameer Inc., International Business Machines Corp., Microsoft Corp., QlikTech international AB, SAP SE, SAS Institute Inc., and Tableau Software LLC |
|
Market Dynamics |
Parent market analysis, Market growth inducers and obstacles, Fast-growing and slow-growing segment analysis, COVID 19 impact and future consumer dynamics, market condition analysis for forecast period, |
|
Customization purview |
If our report has not included the data that you are looking for, you can reach out to our analysts and get segments customized. |
 RIA -
RIA - 
