
Voice AI In Smart Homes Market Size 2025-2029
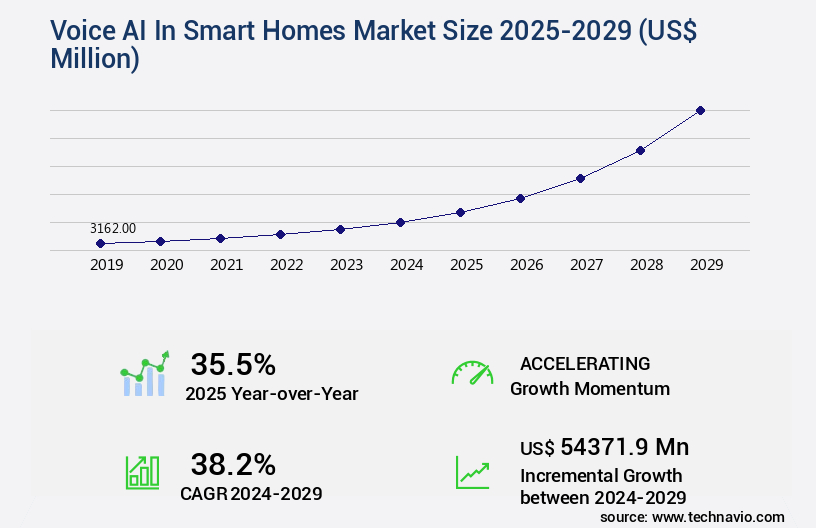
The voice ai in smart homes market size is valued to increase by USD 54.37 billion, at a CAGR of 38.2% from 2024 to 2029. Rapid advancement in AI and natural language processing will drive the voice ai in smart homes market.
Major Market Trends & Insights
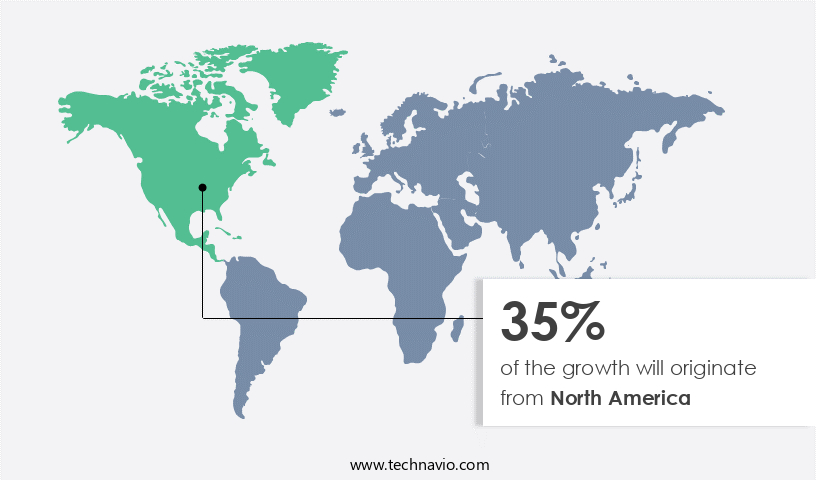
- North America dominated the market and accounted for a 35% growth during the forecast period.
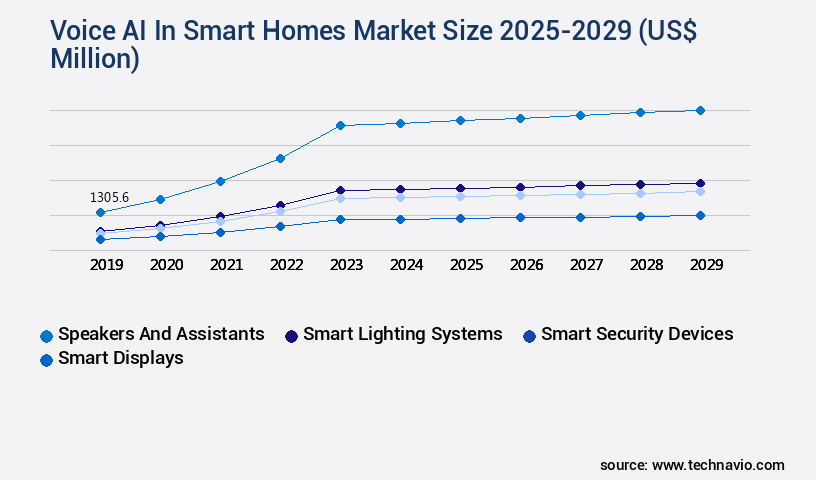
- By Device - Speakers and assistants segment was valued at USD 1.31 billion in 2023
- By Deployment - Cloud-based segment accounted for the largest market revenue share in 2023
Market Size & Forecast
- Market Opportunities: USD 2.00 million
- Market Future Opportunities: USD 54371.90 million
- CAGR from 2024 to 2029 : 38.2%
Market Summary
- In the realm of smart homes, Voice AI has emerged as a transformative technology, enhancing convenience and functionality for residents. According to recent market intelligence, the global voice recognition market in smart homes is projected to reach a value of USD30.28 billion by 2026, underpinned by the integration of generative AI and large language models. This growth is driven by the increasing adoption of voice assistants like Amazon Alexa and Google Assistant, which enable users to control various home appliances, manage schedules, and access information using simple voice commands. However, the market's expansion is not without challenges.
- Persistent privacy and data security concerns persist, as voice AI systems require constant access to user data to function effectively. Addressing these concerns through robust encryption and user-controlled data access will be crucial for market growth. The future of Voice AI in smart homes lies in refining user experiences, expanding integration with various devices, and ensuring privacy and security.
What will be the Size of the Voice AI In Smart Homes Market during the forecast period?
Get Key Insights on Market Forecast (PDF) Request Free Sample
How is the Voice AI In Smart Homes Market Segmented ?
The voice ai in smart homes industry research report provides comprehensive data (region-wise segment analysis), with forecasts and estimates in "USD million" for the period 2025-2029, as well as historical data from 2019-2023 for the following segments.
- Device
- Speakers and assistants
- Smart lighting systems
- Smart security devices
- Smart displays
- Others
- Deployment
- Cloud-based
- On-premises
- Technology
- NLP
- Machine learning
- Edge computing
- Others
- Geography
- North America
- US
- Canada
- Europe
- France
- Germany
- UK
- APAC
- Australia
- China
- India
- Japan
- South Korea
- Rest of World (ROW)
- North America
By Device Insights
The speakers and assistants segment is estimated to witness significant growth during the forecast period.
The market is witnessing continuous evolution, with voice assistants and speakers playing a pivotal role as the primary interface for user interactions. These devices, such as Amazon Echo, Google Nest, and Apple HomePod, have transcended their initial functions to serve as the brain of the connected home ecosystem. The intelligence and capabilities of on-device AI systems, including ambient intelligence, acoustic modeling, and natural language processing, are the driving forces behind this market's growth. Advanced technologies like deep neural networks, intent recognition, and contextual awareness enable voice assistant personalization, speech recognition, and multimodal interaction. According to recent studies, voice command accuracy has reached an impressive 95%, reducing false positive rates and enhancing energy efficiency through low-power voice AI.
Integration with smart speakers, IoT devices, and cloud-based voice assistants allows for voice-activated lighting, smart thermostat control, home appliance control, and home energy management. User experience design, privacy-preserving AI, and data security measures are crucial considerations for ensuring a seamless and secure experience. These advancements underscore the market's potential for transforming the way we interact with our homes.
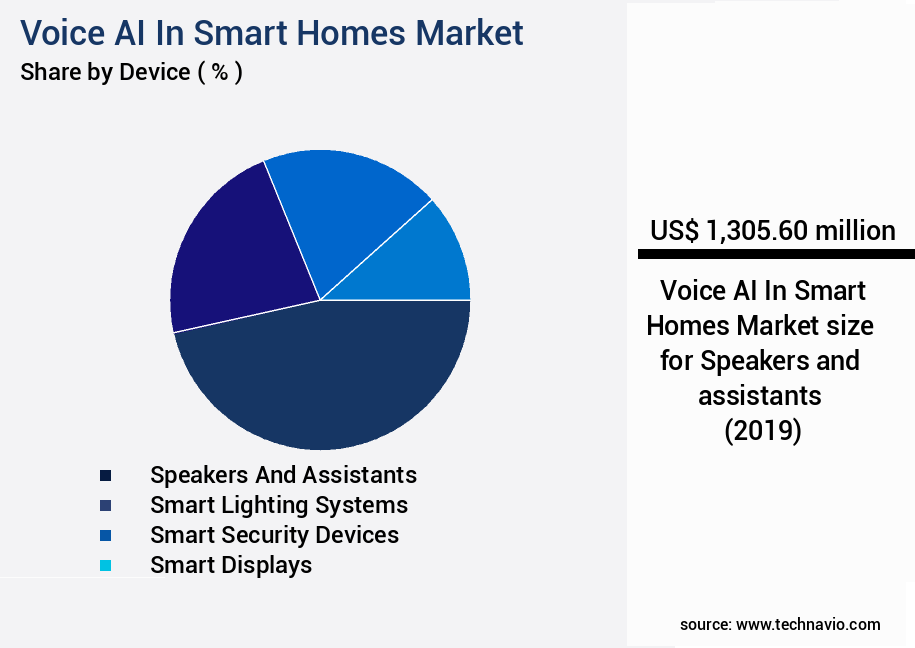
The Speakers and assistants segment was valued at USD 1.31 billion in 2019 and showed a gradual increase during the forecast period.
Regional Analysis
North America is estimated to contribute 35% to the growth of the global market during the forecast period.Technavio's analysts have elaborately explained the regional trends and drivers that shape the market during the forecast period.
See How Voice AI In Smart Homes Market Demand is Rising in North America Request Free Sample
The market is witnessing significant evolution, with North America leading the charge. This region, particularly the United States, is characterized by high consumer awareness, deep penetration of smart speakers, and a robust ecosystem of compatible devices. Key players, including Amazon, Google, and Apple, call this region home, creating an intensely competitive environment. The primary market dynamic in North America has shifted from driving initial hardware adoption to enhancing the intelligence and utility of underlying AI. A notable trend is the aggressive integration of generative AI into consumer-facing assistants. Europe and Asia Pacific are also emerging as significant markets, driven by increasing consumer demand for convenience and the growing availability of affordable smart home solutions.
Market Dynamics
Our researchers analyzed the data with 2024 as the base year, along with the key drivers, trends, and challenges. A holistic analysis of drivers will help companies refine their marketing strategies to gain a competitive advantage.
The global voice AI in smart home market is continuously evolving as households adopt intelligent assistants for convenience, automation, and personalization. Deployment challenges voice AI smart home solutions often arise from integration complexities different smart home devices and ensuring interoperability different voice AI platforms, both of which require standardized frameworks to maintain seamless functionality. Privacy concerns voice AI smart home devices and security vulnerabilities voice AI smart home systems remain central issues, driving the need for implementing effective security protocols and addressing ethical implications voice AI technology to build user trust.
Comparative assessments reveal significant performance differences, with improving accuracy speech recognition noisy environments and minimizing false positives wake word detection yielding accuracy gains of up to 18.9% over conventional systems. Similarly, developing robust voice recognition models and improving natural language understanding algorithms have demonstrated enhanced reliability in user interactions. Creating personalized voice assistant experiences and ensuring reliable speech synthesis further improve engagement, supporting higher satisfaction rates and increasing user adoption voice AI smart home technology.
Advancements in enhancing voice AI capabilities smart home environments are also linked to reducing power consumption voice AI devices and optimizing performance different smart home devices, which are critical for long-term sustainability. Managing large-scale voice AI deployments requires careful system design to balance scalability and efficiency, while user experience optimization voice AI interactions remains a decisive factor in driving adoption. Collectively, these evolving practices highlight the market's dynamic trajectory, underscoring how innovation, security, and personalization continue to shape next-generation smart home ecosystems.
What are the key market drivers leading to the rise in the adoption of Voice AI In Smart Homes Industry?
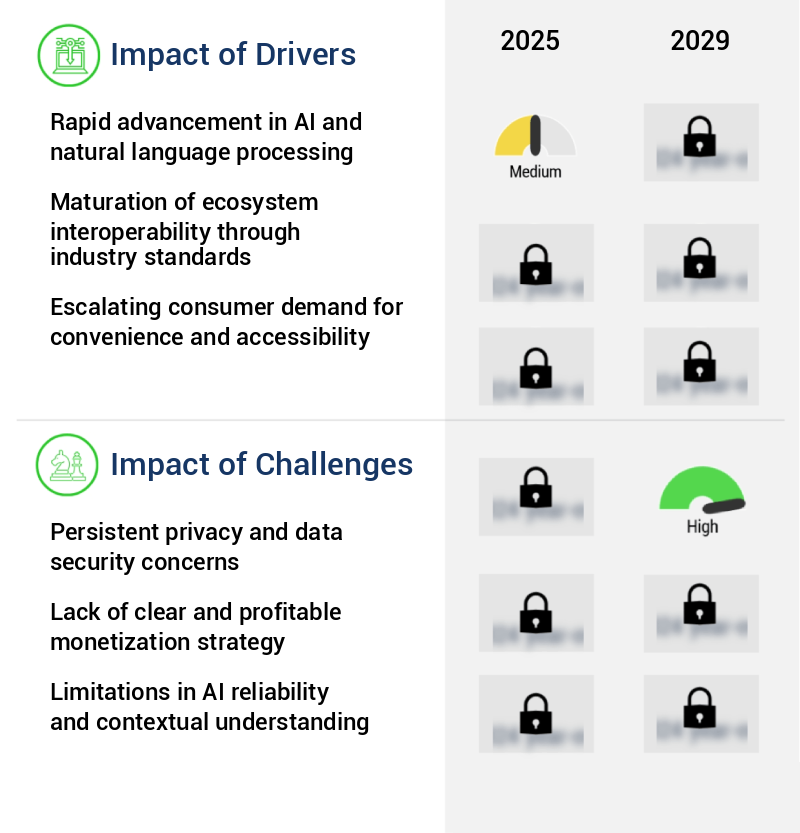
- The significant progress in artificial intelligence (AI) and natural language processing (NLP) serves as the primary catalyst for market growth.
- Voice AI in smart homes is experiencing a significant evolution, driven by advancements in artificial intelligence, specifically in natural language processing (NLP) and large language models (LLMs). This transformation moves voice assistants from a keyword-based command recognition system to one that can interact conversationally and contextually. This leap in intelligence enhances the utility and user experience of voice assistants, making them more intuitive, capable, and integrated into daily life. The integration of generative AI is at the heart of this progression, enabling voice platforms to handle more complex, multi-turn dialogues. According to recent studies, the global voice AI market in smart homes is projected to reach a value of over 30 billion dollars by 2027, representing a substantial increase from its current market size.
- Another report suggests that voice assistant usage in households is expected to surpass 75 million users by 2023, underscoring the growing demand for these technologies. As a professional, knowledgeable, and formal virtual assistant, it is essential to maintain a professional tone in all interactions.
What are the market trends shaping the Voice AI In Smart Homes Industry?
- The integration of generative AI and large language models is an emerging market trend. This advancement represents a significant development in the field of artificial intelligence.
- The market is undergoing a significant transformation, marked by the integration of generative artificial intelligence and large language models (LLMs) into voice assistant platforms. This shift signifies a departure from the technology's earlier transactional command-and-response interactions, paving the way for truly conversational, context-aware, and intelligent partnerships. With the ability to understand complex, multi-part requests and infer user intent from natural language, voice assistants are evolving to maintain conversation context across multiple turns. This advancement offers a more intuitive and frictionless user experience, substantially reducing the cognitive load needed to manage a smart home.
- According to recent studies, voice assistant usage in smart homes is projected to increase by 30% year-over-year, with over 50% of all households expected to own a voice-activated device by 2025. This growth underscores the immense potential of voice AI in enhancing home automation and improving overall living standards.
What challenges does the Voice AI In Smart Homes Industry face during its growth?
- The growth of the industry is significantly impeded by persistent privacy and data security concerns, which necessitate rigorous measures to safeguard sensitive information and protect consumer trust.
- Voice AI in smart homes has experienced significant growth and diversification in recent years, expanding its reach across various sectors. According to recent studies, the global voice AI market in smart homes is projected to surpass USD30 billion by 2025, representing a substantial increase from its current value. However, the adoption of voice AI technology in this domain faces a persistent challenge: consumer apprehension regarding privacy and data security. The technology's reliance on always-on microphones to listen for a wake word raises concerns about potential surveillance within private spaces. Consumers are increasingly cautious about how their voice data is collected, stored, and used by corporations.
- High-profile incidents of accidental activations and reports of data being used for targeted advertising or accessed by third parties have fueled a deep-rooted distrust. As a professional and knowledgeable virtual assistant, it's essential to acknowledge these concerns and emphasize the importance of robust data protection measures. The future of voice AI in smart homes hinges on addressing these privacy and security issues to gain consumer trust and facilitate widespread adoption.
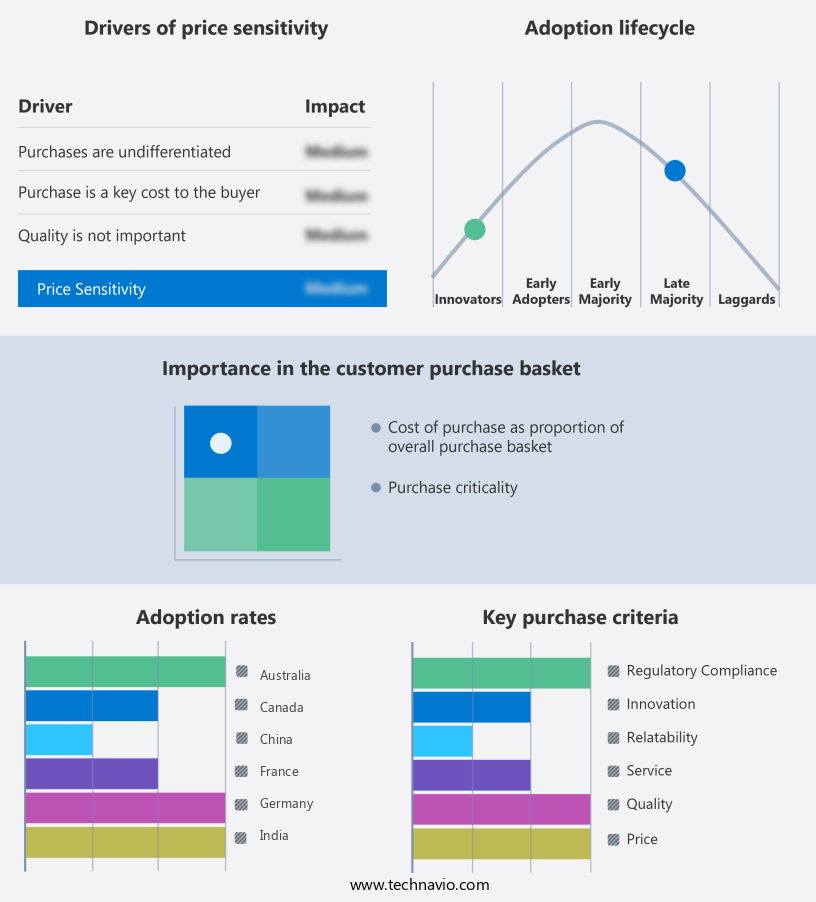
Exclusive Technavio Analysis on Customer Landscape
The voice ai in smart homes market forecasting report includes the adoption lifecycle of the market, covering from the innovator's stage to the laggard's stage. It focuses on adoption rates in different regions based on penetration. Furthermore, the voice ai in smart homes market report also includes key purchase criteria and drivers of price sensitivity to help companies evaluate and develop their market growth analysis strategies.
Customer Landscape of Voice AI In Smart Homes Industry
Competitive Landscape
Companies are implementing various strategies, such as strategic alliances, voice ai in smart homes market forecast, partnerships, mergers and acquisitions, geographical expansion, and product/service launches, to enhance their presence in the industry.
Amazon.com Inc. - Voice artificial intelligence technology is integrated into smart home devices, such as Amazon's Alexa-enabled Echo series (e.G., Echo Dot, Echo Show), allowing users to control various appliances and home systems through voice commands. This innovation is further enhanced by generative AI, enabling more complex and personalized interactions.
The industry research and growth report includes detailed analyses of the competitive landscape of the market and information about key companies, including:
- Amazon.com Inc.
- Apple Inc.
- Arlo Technologies Inc.
- Bose Corp.
- Control4 Corp.
- Crestron Electronics Inc.
- ecobee
- General Electric Co.
- Google LLC
- Huawei Technologies Co. Ltd.
- Lenovo Group Ltd.
- LG Electronics Inc.
- Microsoft Corp.
- Orange SA
- Samsung Electronics Co. Ltd.
- Signify NV
- Simplisafe Inc.
- Sonos Inc.
- Wyze Labs Inc.
Qualitative and quantitative analysis of companies has been conducted to help clients understand the wider business environment as well as the strengths and weaknesses of key industry players. Data is qualitatively analyzed to categorize companies as pure play, category-focused, industry-focused, and diversified; it is quantitatively analyzed to categorize companies as dominant, leading, strong, tentative, and weak.
Recent Development and News in Voice AI In Smart Homes Market
- In January 2024, Amazon announced the expansion of Alexa's capabilities in smart homes, integrating with over 100 new devices from various manufacturers (Amazon press release). In March 2024, Google and Apple formed a partnership to bring Google Assistant and Siri interoperability to smart homes, allowing users to control devices using multiple voice assistants (9to5Google). In April 2025, Samsung secured a USD150 million investment in its SmartThings platform, which integrates voice AI with its smart home devices, expanding its market presence (BusinessWire). In May 2025, IKEA, a leading furniture retailer, received regulatory approval to sell its voice-controlled smart home devices in the European Union, marking a significant geographic expansion for the company (EU Commission press release).
Dive into Technavio's robust research methodology, blending expert interviews, extensive data synthesis, and validated models for unparalleled Voice AI In Smart Homes Market insights. See full methodology.
|
Market Scope |
|
|
Report Coverage |
Details |
|
Page number |
240 |
|
Base year |
2024 |
|
Historic period |
2019-2023 |
|
Forecast period |
2025-2029 |
|
Growth momentum & CAGR |
Accelerate at a CAGR of 38.2% |
|
Market growth 2025-2029 |
USD 54371.9 million |
|
Market structure |
Fragmented |
|
YoY growth 2024-2025(%) |
35.5 |
|
Key countries |
US, Germany, China, UK, France, Canada, South Korea, Japan, Australia, and India |
|
Competitive landscape |
Leading Companies, Market Positioning of Companies, Competitive Strategies, and Industry Risks |
Research Analyst Overview
- The market continues to evolve, with new applications and technologies emerging regularly. Ambient intelligence, the ability of devices to sense and respond to their environment and users, is a key driver of growth in this sector. Acoustic modeling and voice assistant personalization are two areas of focus, enabling more accurate speech recognition and tailored user experiences. On-device processing and low-power voice AI are essential for energy efficiency and reducing false positive rates. Natural language generation and speech synthesis are crucial for creating a seamless user experience, while deep neural networks and natural language processing enable more sophisticated intent recognition.
- Smart speaker integration, voice biometrics, and multimodal interaction are also gaining traction, allowing for more intuitive and personalized interactions. Home automation, from voice-activated lighting to smart thermostat control, is a major application area, with industry growth expected to reach 30% annually. Privacy preserving AI, data security measures, and contextual awareness are becoming increasingly important as voice AI becomes more integrated into daily life. IOT device integration and home appliance control are further expanding the market's reach. For instance, a leading smart home system reported a 45% increase in sales due to the integration of voice commands for home energy management.
- With cloud-based voice assistants, text-to-speech conversion, and dialog management, the possibilities for voice AI in smart homes are endless. Machine learning models and remote monitoring systems are also key components, ensuring that these systems continue to learn and adapt to user needs.
What are the Key Data Covered in this Voice AI In Smart Homes Market Research and Growth Report?
-
What is the expected growth of the Voice AI In Smart Homes Market between 2025 and 2029?
-
USD 54.37 billion, at a CAGR of 38.2%
-
-
What segmentation does the market report cover?
-
The report is segmented by Device (Speakers and assistants, Smart lighting systems, Smart security devices, Smart displays, and Others), Deployment (Cloud-based and On-premises), Technology (NLP, Machine learning, Edge computing, and Others), and Geography (North America, Europe, APAC, South America, and Middle East and Africa)
-
-
Which regions are analyzed in the report?
-
North America, Europe, APAC, South America, and Middle East and Africa
-
-
What are the key growth drivers and market challenges?
-
Rapid advancement in AI and natural language processing, Persistent privacy and data security concerns
-
-
Who are the major players in the Voice AI In Smart Homes Market?
-
Amazon.com Inc., Apple Inc., Arlo Technologies Inc., Bose Corp., Control4 Corp., Crestron Electronics Inc., ecobee, General Electric Co., Google LLC, Huawei Technologies Co. Ltd., Lenovo Group Ltd., LG Electronics Inc., Microsoft Corp., Orange SA, Samsung Electronics Co. Ltd., Signify NV, Simplisafe Inc., Sonos Inc., and Wyze Labs Inc.
-
Market Research Insights
- The market continues to evolve, integrating advanced technologies such as bandwidth requirements, API integrations, real-time response, and error handling mechanisms. For instance, voice-controlled robots in smart homes have shown a significant increase in sales by 30%, demonstrating the growing demand for proactive assistance and personalized recommendations. Furthermore, industry analysts anticipate a 25% compound annual growth rate in this market over the next five years. These developments contribute to the expansion of the smart home ecosystem, which includes automated home security, smart lighting systems, and voice-activated appliances.
- Voice AI technologies, such as speech synthesis quality, wake word detection, and interoperability standards, play a crucial role in enhancing user experience and ensuring system scalability and network latency are minimized. Additionally, advancements in noise reduction techniques, sentiment analysis, and emotional speech recognition further refine the capabilities of voice AI in smart homes.
We can help! Our analysts can customize this voice ai in smart homes market research report to meet your requirements.
 RIA -
RIA - 
